CD1- and CD1+ porcine blood dendritic cells are enriched for the orthologues of the two major mammalian conventional subsets
- PMID: 28106145
- PMCID: PMC5247722
- DOI: 10.1038/srep40942
CD1- and CD1+ porcine blood dendritic cells are enriched for the orthologues of the two major mammalian conventional subsets
Abstract
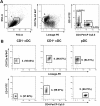
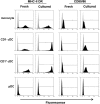
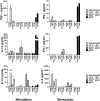
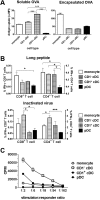
Conventional dendritic cells (cDC) are professional antigen-presenting cells that induce immune activation or tolerance. Two functionally specialised populations, termed cDC1 and cDC2, have been described in humans, mice, ruminants and recently in pigs. Pigs are an important biomedical model species and a key source of animal protein; therefore further understanding of their immune system will help underpin the development of disease prevention strategies. To characterise cDC populations in porcine blood, DC were enriched from PBMC by CD14 depletion and CD172a enrichment then stained with lineage mAbs (Lin; CD3, CD8α, CD14 and CD21) and mAbs specific for CD172a, CD1 and CD4. Two distinct porcine cDC subpopulations were FACSorted CD1- cDC (Lin-CD172+ CD1-CD4-) and CD1+ cDC (Lin-CD172a+ CD1+ CD4-), and characterised by phenotypic and functional analyses. CD1+ cDC were distinct from CD1- cDC, expressing higher levels of CD172a, MHC class II and CD11b. Following TLR stimulation, CD1+ cDC produced IL-8 and IL-10 while CD1- cDC secreted IFN-α, IL-12 and TNF-α. CD1- cDC were superior in stimulating allogeneic T cell responses and in cross-presenting viral antigens to CD8 T cells. Comparison of transcriptional profiles further suggested that the CD1- and CD1+ populations were enriched for the orthologues of cDC1 and cDC2 subsets respectively.
Figures


Similar articles
-
Development of Pig Conventional Dendritic Cells From Bone Marrow Hematopoietic Cells in vitro.Front Immunol. 2020 Oct 8;11:553859. doi: 10.3389/fimmu.2020.553859. eCollection 2020. Front Immunol. 2020. PMID: 33162975 Free PMC article.
-
Characterization and Transcriptomic Analysis of Porcine Blood Conventional and Plasmacytoid Dendritic Cells Reveals Striking Species-Specific Differences.J Immunol. 2016 Dec 15;197(12):4791-4806. doi: 10.4049/jimmunol.1600672. Epub 2016 Nov 11. J Immunol. 2016. PMID: 27837108
-
Characterization of conventional and plasmacytoid dendritic cells in swine secondary lymphoid organs and blood.Vet Immunol Immunopathol. 2006 Dec 15;114(3-4):224-37. doi: 10.1016/j.vetimm.2006.08.009. Epub 2006 Sep 14. Vet Immunol Immunopathol. 2006. PMID: 16978709
-
Porcine T lymphocytes and NK cells--an update.Dev Comp Immunol. 2009 Mar;33(3):310-20. doi: 10.1016/j.dci.2008.06.003. Epub 2008 Jul 2. Dev Comp Immunol. 2009. PMID: 18601948 Review.
-
Human dendritic cells in cancer.Sci Immunol. 2022 Apr;7(70):eabm9409. doi: 10.1126/sciimmunol.abm9409. Epub 2022 Apr 1. Sci Immunol. 2022. PMID: 35363544 Review.
Cited by
-
Development of Pig Conventional Dendritic Cells From Bone Marrow Hematopoietic Cells in vitro.Front Immunol. 2020 Oct 8;11:553859. doi: 10.3389/fimmu.2020.553859. eCollection 2020. Front Immunol. 2020. PMID: 33162975 Free PMC article.
-
Antigen Targeting of Porcine Skin DEC205+ Dendritic Cells.Vaccines (Basel). 2022 Apr 26;10(5):684. doi: 10.3390/vaccines10050684. Vaccines (Basel). 2022. PMID: 35632440 Free PMC article.
-
Dendritic Cells in Xenotransplantation: Shaping the Cellular Immune Response Toward Tolerance.Xenotransplantation. 2025 Mar-Apr;32(2):e70037. doi: 10.1111/xen.70037. Xenotransplantation. 2025. PMID: 40243284 Free PMC article. Review.
-
Mechanism of activation of porcine dendritic cells by an α-D-glucan nanoparticle adjuvant and a nanoparticle/poly(I:C) combination adjuvant.Front Immunol. 2022 Sep 5;13:990900. doi: 10.3389/fimmu.2022.990900. eCollection 2022. Front Immunol. 2022. PMID: 36131928 Free PMC article.
-
Characterization of the Myeloid Cell Populations' Resident in the Porcine Palatine Tonsil.Front Immunol. 2018 Aug 15;9:1800. doi: 10.3389/fimmu.2018.01800. eCollection 2018. Front Immunol. 2018. PMID: 30158925 Free PMC article.
References
Publication types
MeSH terms
Substances
LinkOut - more resources
Full Text Sources
Other Literature Sources
Molecular Biology Databases
Research Materials
Miscellaneous

