. 2017 Jan 20:8:14112.
doi: 10.1038/ncomms14112.

Rapid generation of hypomorphic mutations

Affiliations

Rapid generation of hypomorphic mutations

Laura L Arthur et al. Nat Commun. .

Erratum in

  • Corrigendum: Rapid generation of hypomorphic mutations.
    Arthur LL, Chung JJ, Janakirama P, Keefer KM, Kolotilin I, Pavlovic-Djuranovic S, Chalker DL, Grbic V, Green R, Menassa R, True HL, Skeath JB, Djuranovic S. Arthur LL, et al. Nat Commun. 2017 Feb 16;8:14705. doi: 10.1038/ncomms14705. Nat Commun. 2017. PMID: 28205645 Free PMC article. No abstract available.

Abstract

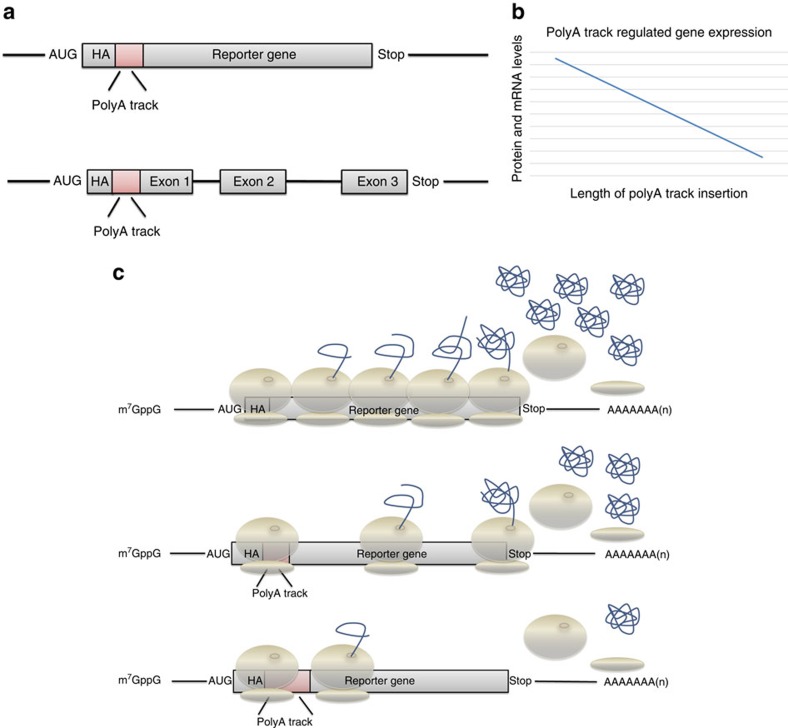
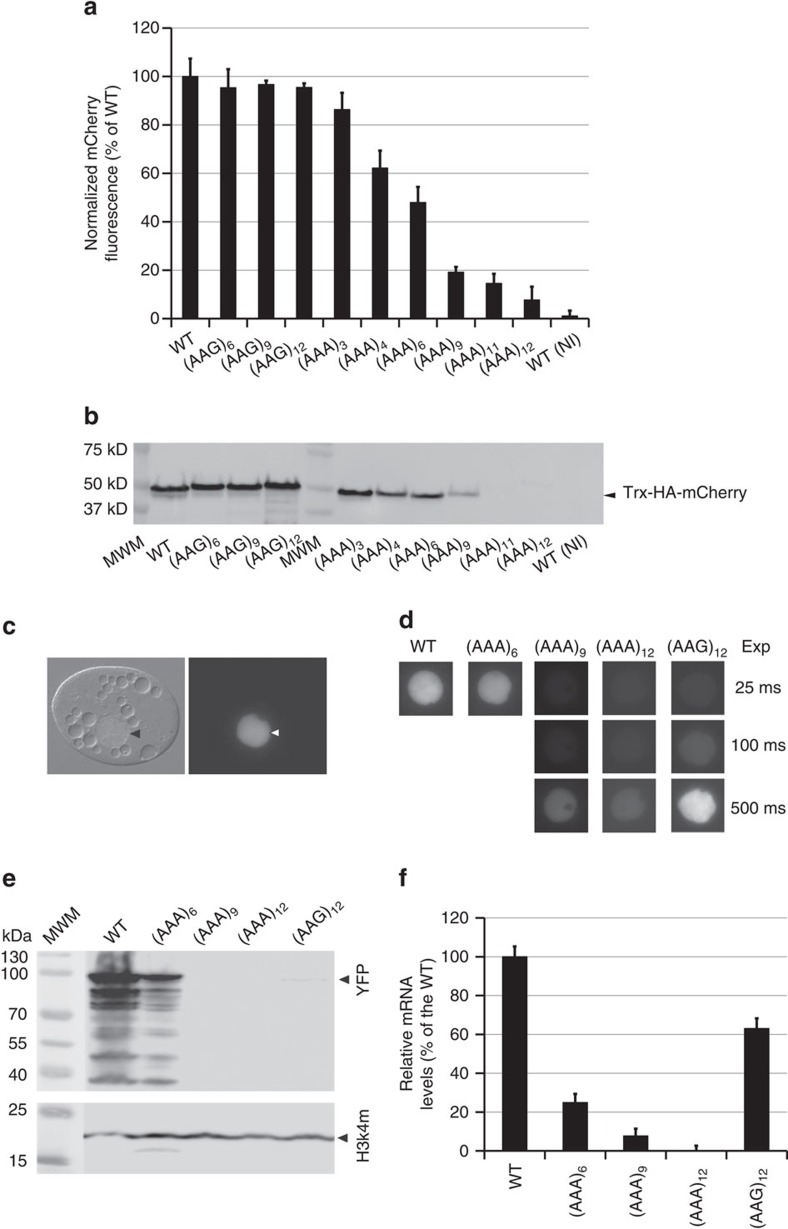
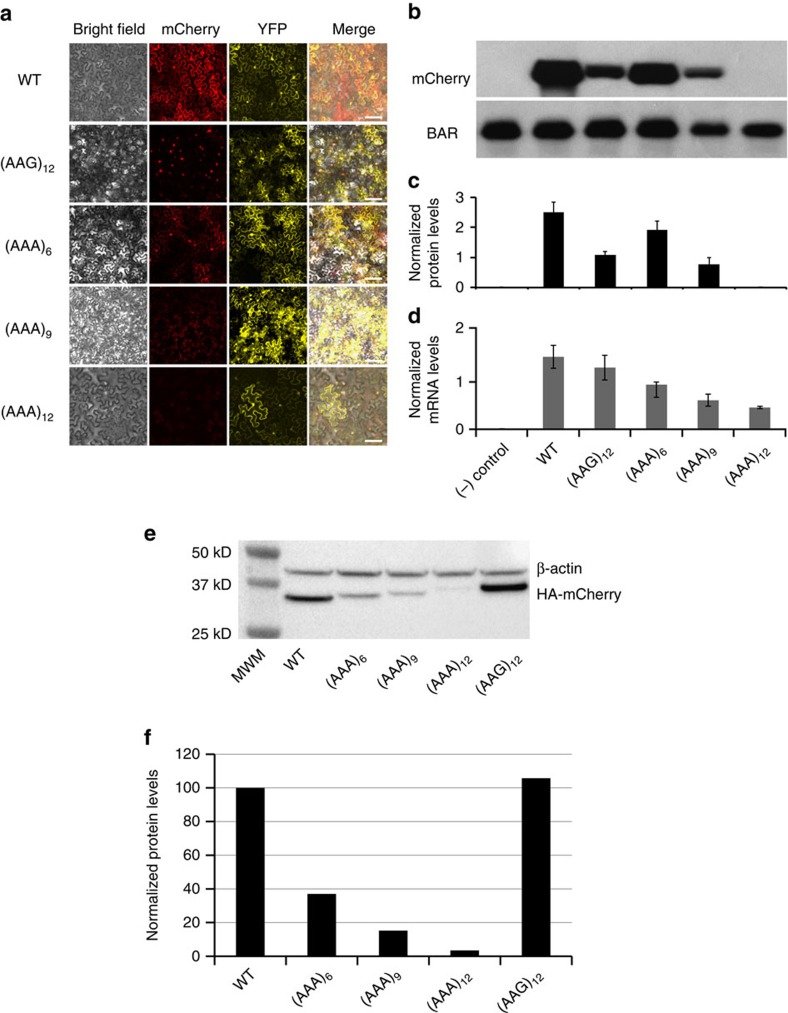
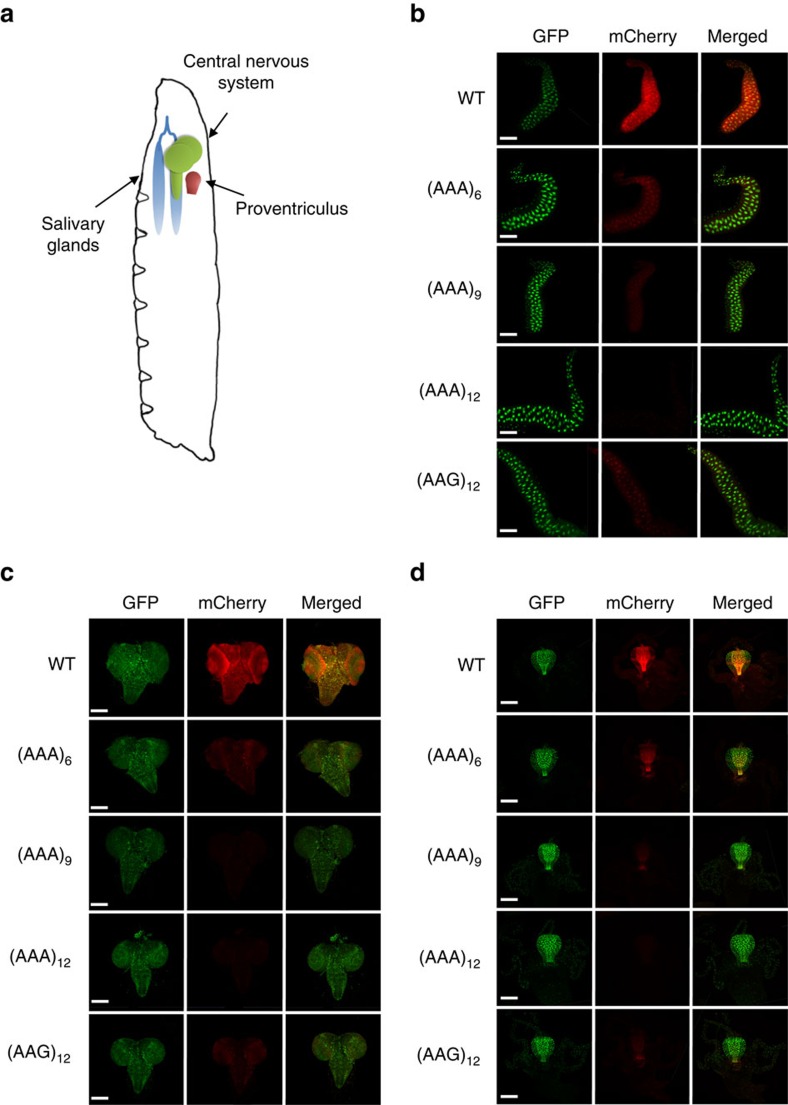
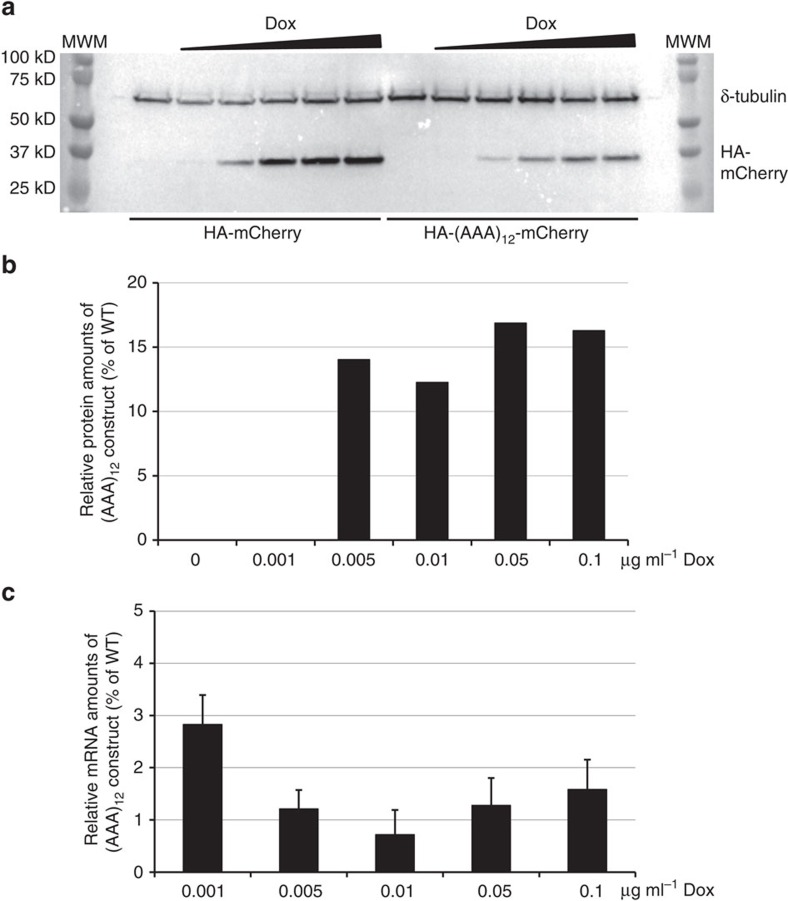
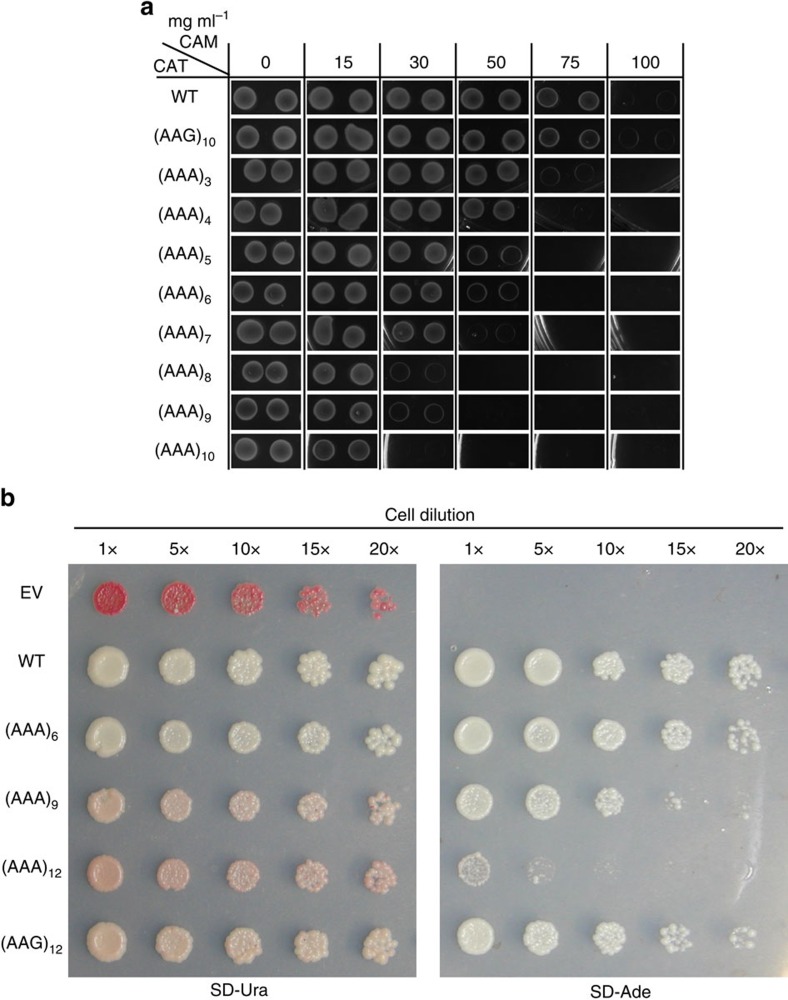
Hypomorphic mutations are a valuable tool for both genetic analysis of gene function and for synthetic biology applications. However, current methods to generate hypomorphic mutations are limited to a specific organism, change gene expression unpredictably, or depend on changes in spatial-temporal expression of the targeted gene. Here we present a simple and predictable method to generate hypomorphic mutations in model organisms by targeting translation elongation. Adding consecutive adenosine nucleotides, so-called polyA tracks, to the gene coding sequence of interest will decrease translation elongation efficiency, and in all tested cell cultures and model organisms, this decreases mRNA stability and protein expression. We show that protein expression is adjustable independent of promoter strength and can be further modulated by changing sequence features of the polyA tracks. These characteristics make this method highly predictable and tractable for generation of programmable allelic series with a range of expression levels.


Conflict of interest statement

The authors declare no competing financial interests.

Figures

Figure 1
Figure 1. Design and mechanism of polyA track tag regulated gene expression.
(a) Scheme of inserted polyA tracks in the reporter genes used in this study. Hemagglutinin (HA) tag (grey) and polyA tracks (red) were introduced in the coding region of the reporter genes next to the start AUG codon. Exon boundaries as well as termination codon (Stop) are indicated. (b) Proposed correlation between gene products levels, mRNA and protein, and the length of inserted polyA track tags. The reduction in levels of both reporter protein and mRNA is dependent on increasing length of consecutive adenosine nucleotides in the coding sequence. (c) Scheme of translation of eukaryotic reporter mRNA with or without inserted polyA tracks. The length of inserted polyA track tag determines the protein output of the regulated reporter gene as indicated by the number of globular protein structures. Features of the eukaryotic mRNAs (m7GpppG—cap, AUG—start codon, Stop—termination codon and polyA tail), as well as HA-tag, position of the polyA track tag, ribosome and nascent polypeptide chain are illustrated in the scheme.
Figure 2
Figure 2. Regulation of reporter gene by polyA tracks in the single-cell prokaryotic and eukaryotic organisms.
(a) Percentage of mCherry fluorescence of tested LysAAG ((AAG)6–12) and LysAAA((AAA)3–12) insertion constructs compared with wild type fluorescence (WT, no insertion construct). mCherry fluorescence was assayed at excitation wavelength of 475±9 nm and emission was detected at 620±9 nm. Error bars indicate mean mCherry fluorescence values±s.d. for three individual E. coli colonies for each construct. Background levels of mCherry expression can be estimated from the fluorescence of the non-induced wild type construct (WT(NI)). (b) Western blot analysis of mCherry constructs expressed in E. coli cells. Equal amounts of E. coli cell lysates with Thioredoxin(Trx) fusion proteins were used for analysis. Fusion proteins were detected using HA-tag specific antibody. Positions of the fusion protein (Trx-HA-mCherry) and sizes of molecular weight markers (MWM) are indicated. (c) Representative differential interference contrast microscopy (left panel) and the corresponding fluorescence image (right panel −25 ms exposure) of a T. thermophila cell expressing the wild type (WT) MLP1-HA-YFP fusion. Arrowheads denote the position of the macronucleus. (d) MPL1-HA-YFP accumulation within macronuclei of live T. thermophila cells expressing an allelic series of fusion proteins—WT, (AAA)6-12, and (AAG)12—was visualized by epifluorescence microscopy. Different exposures times are indicated on the right to demonstrate the relative accumulation of each variant. (e) Western blot analysis was performed with whole cell lysates made from T. thermophila cells expressing the MLP-HA-YFP fusion proteins. Protein from equivalent cell numbers was loaded in each lane and detected using YFP specific antibody (top panel) and normalized to the nuclear histone species, histone H3 trimethyl-lysine 4 (H3K4m) (bottom panel). Positions of the full-length fusion protein (YFP), normalization control (H3k4m), and sizes of molecular weight markers (MWM) are indicated. Degradation of excess fusion protein is readily apparent as faster migrating species below the full-length MLP1-HA-YFP. (f) Steady state levels of fusion gene constructs measured by qRT-PCR. Relative levels of the mRNA for (AAG)12 and (AAA)6–12 are presented as percentage of the wild type (WT) construct mRNA levels. Error bars represent mean±s.d. values (n=3).
Figure 3
Figure 3. Regulation of reporter gene by polyA tracks in the eukaryotic tissue cultures.
(a) Fluorescence images of N. benthamiana epidermal cells transiently expressing wild type (WT), (AAG)12 and (AAA)6-12 mCherry constructs. YFP expression was used as a transfection control. The scale bars in images are 100 μm. (b)—Western blot analysis, (c)—protein level estimate and (d)—mRNA levels for transfected (−) insert control and WT, (AAG)12 and (AAA)6–12 mCherry constructs expressed transiently in N. benthamiana epidermal cells. (b) Primary HA-tag antibody was used for detection of HA-mCherry constructs (molecular weight 34 kDa). Phosphinotricin acetyl transferase (BAR) specific antibody was used as a loading and normalization control (molecular weight 22 kDa) (c). Levels of mCherry protein from different constructs were derived from detected band intensities normalized for BAR accumulation detected in the same sample. Error bars represent mean values±standard error from biological replicates (n=8). (d) mRNA levels for different mCherry constructs were calculated as cycle threshold (Ct) values and normalized to BAR gene mRNA values. Error bars represent mean values±s.e. from biological replicates (n=3). (e) Western blot analysis of transient mCherry constructs expression in HeLa cells. WT, 12 LysAAG ((AAG)12) and 6–12 LysAAA ((AAA)6-12) mCherry proteins were detected using HA-tag specific primary antibody. β-actin was used as a loading control and was detected using specific antibody. Positions of the fusion protein (HA-mCherry), normalization control (β-actin) and sizes of molecular weight markers (MWM) are indicated. (f) Quantification of the mCherry protein levels from detected western blot intensities. Levels of mCherry were normalized to β-actin band intensities and represented as a percentage of the wild type construct values.
Figure 4
Figure 4. PolyA tracks regulate mCherry reporter gene expression in different organs of D. melanogaster.
(a) Diagram of third instar fruit fly larva showing approximate location of salivary glands (SG, blue), central nervous system (CNS, green) and proventriculus (PV, red). Fluorescence imaging of formaldehyde fixed SG (b), CNS (c) and PV (d), dissected from larvae expressing wild type (WT), (AAG)12 and (AAA)6-12 mCherry constructs. mCherry and GFP indicate images acquired by selective fluorescence filter setting. Overlay of mCherry and GFP fluorescence is shown in the merged panel. The scale bars in images are 200 μm.
Figure 5
Figure 5. PolyA tracks regulate mCherry reporter expression independently of the promoter strength.
(a) Western blot analysis of the cell lysates from Flp-In T-REx 293 stable cell lines expressing doxycycline (Dox) inducible wild type (HA-mCherry) and 12 LysAAA insertion construct (HA-(AAA)12-mCherry) from a single locus. Dox concentration in the media was varied from 0 to 0.1 μg ml−1. Constitutively expressed δ-tubulin was used as a loading control and was detected using specific antibody. Positions of the fusion protein (HA-mCherry), normalization control (δ-tubulin) and sizes of molecular weight markers (MWM) are indicated. (b) Quantification of the mCherry protein levels from detected western blot intensities. Levels of mCherry were normalized to δ-tubulin band intensities and represented as a percentage of the wild type construct values at each Dox concentration. Numbers indicate concentration of Dox in the media. (c) Steady state mRNA levels of the 12 LysAAA insertion construct ((AAA)12) measured by qRT-PCR. Relative levels of the mRNA for (AAA)12 are presented as percentage of the wild type (WT) construct mRNA level at each Dox concentration. Error bars represent mean±s.d. values (n=3). Numbers indicate final concentration of Dox in the media.
Figure 6
Figure 6. Regulation of drug resistance and metabolic survival by insertion of polyA track tags in genes from E. coli and S. cerviseae.
(a) Survival of E. coli cells expressing wildtype (WT), 10LysAAG ((AAG)10) and 3–10 LysAAA (AAA)3-10 chloramphenicol acetyltransferase (CAT) constructs on chloramphenicol (CAM) selective media. Pulse induced E. coli cells, expressing different CAT constructs, were plated on selective antibiotic plates with varying amounts of CAM in the media (0–100 mg ml−1). Two independent clones were assessed for each construct. E. coli colonies were imaged 16 h after plating. (b) Assays for ADE1 gene regulation by polyA tracks ((AAA)6-12). Ability of S. cerevisiae ade1Δ cells to produce sufficient levels of functional Ade1 protein were assayed by reintroduction of single copy vector with wild type (WT), 12 LysAAG ((AAG)12) and 6–12 LysAAA ((AAA)6-12) Ade1 construct. Empty vector (EV) served as a negative control. Yeast colonies show differential red coloration, on the selective SD-Ura media, which is proportional to the activity of Ade1 protein. Adenine dropout media (SD-Ade) selects for yeast cells expressing sufficient amounts of functional Ade1 protein. Dilutions of the yeast cultures showing relative survival and growth are indicated.

References

    1. Muller H. J. Further studies on the nature and causes of gene mutations. Proc. 6th Int. Congr. Genet. 1, 213–255 (1932).
    1. Bonde M. T. et al.. Predictable tuning of protein expression in bacteria. Nat. Methods 13, 233–236 (2016). - PubMed
    1. Breslow D. K. et al.. A comprehensive strategy enabling high-resolution functional analysis of the yeast genome. Nat. Methods 5, 711–718 (2008). - PMC - PubMed
    1. Chappell J., Watters K. E., Takahashi M. K. & Lucks J. B. A renaissance in RNA synthetic biology: New mechanisms, applications and tools for the future. Curr. Opin. Chem. Biol. 28, 47–56 (2015). - PubMed
    1. Dawlaty M. M. & van Deursen J. M. Gene targeting methods for studying nuclear transport factors in mice. Methods 39, 370–378 (2006). - PubMed

Publication types