

Antibiotic Pollution in Marine Food Webs in Laizhou Bay, North China: Trophodynamics and Human Exposure Implication
- PMID: 28106989
- PMCID: PMC5618103
- DOI: 10.1021/acs.est.6b04556
Antibiotic Pollution in Marine Food Webs in Laizhou Bay, North China: Trophodynamics and Human Exposure Implication
Abstract
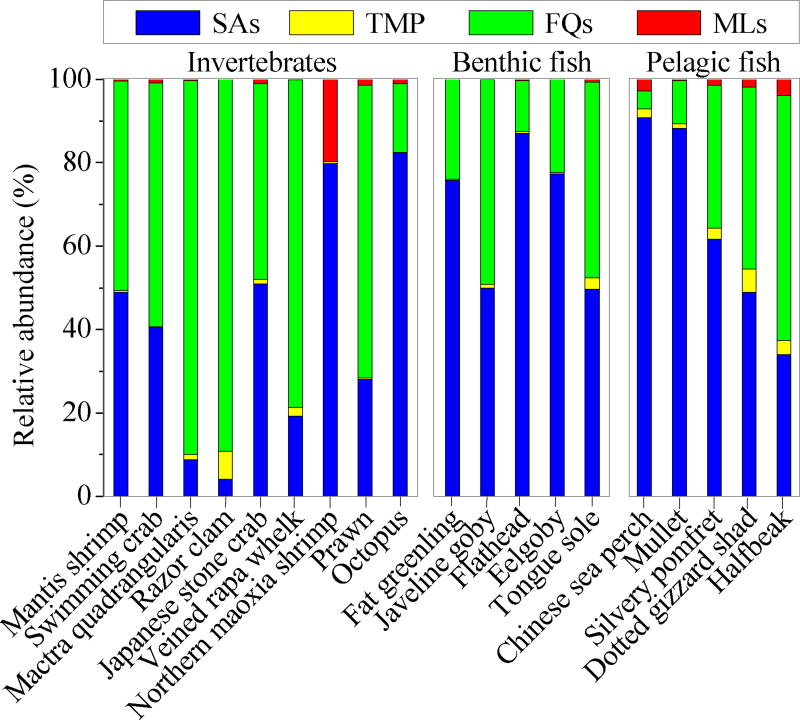
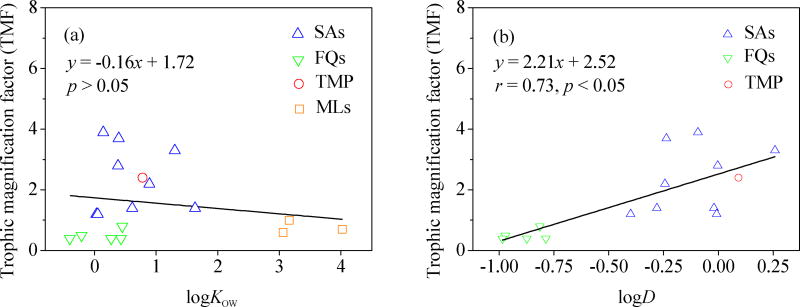
Little information is available about the bioaccumulation and biomagnification of antibiotics in marine food webs. Here, we investigate the levels and trophic transfer of 9 sulfonamide (SA), 5 fluoroquinolone (FQ), and 4 macrolide (ML) antibiotics, as well as trimethoprim in nine invertebrate and ten fish species collected from a marine food web in Laizhou Bay, North China in 2014 and 2015. All the antibiotics were detected in the marine organisms, with SAs and FQs being the most abundant antibiotics. Benthic fish accumulated more SAs than invertebrates and pelagic fish, while invertebrates exhibited higher FQ levels than fish. Generally, SAs and trimethoprim biomagnified in the food web, while the FQs and MLs were biodiluted. Trophic magnification factors (TMF) were 1.2-3.9 for SAs and trimethoprim, 0.3-1.0 for FQs and MLs. Limited biotransformation and relatively high assimilation efficiencies are the likely reasons for the biomagnification of SAs. The pH dependent distribution coefficients (log D) but not the lipophilicity (log KOW) of SAs and FQs had a significant correlation (r = 0.73; p < 0.05) with their TMFs. Although the calculated estimated daily intakes (EDI) for antibiotics suggest that consumption of seafood from Laizhou Bay is not associated with significant human health risks, this study provides important insights into the guidance of risk management of antibiotics.
Figures
 ), blue diamonds (
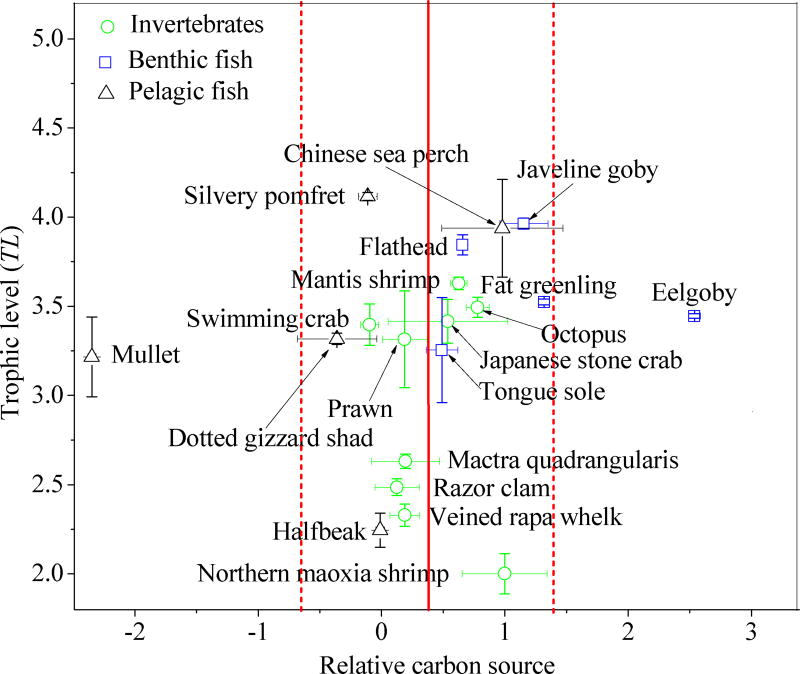
 ) and black triangles (△) represent invertebrates, benthic fish and pelagic fish, respectively. Data are presented as mean ± one standard deviation of relative carbon sources (n = 3) and TL values (n = 3). The red vertical solid line and dotted lines represent the mean value of relative carbon sources for all species and the boundaries of relative carbon sources for species in the same food web.
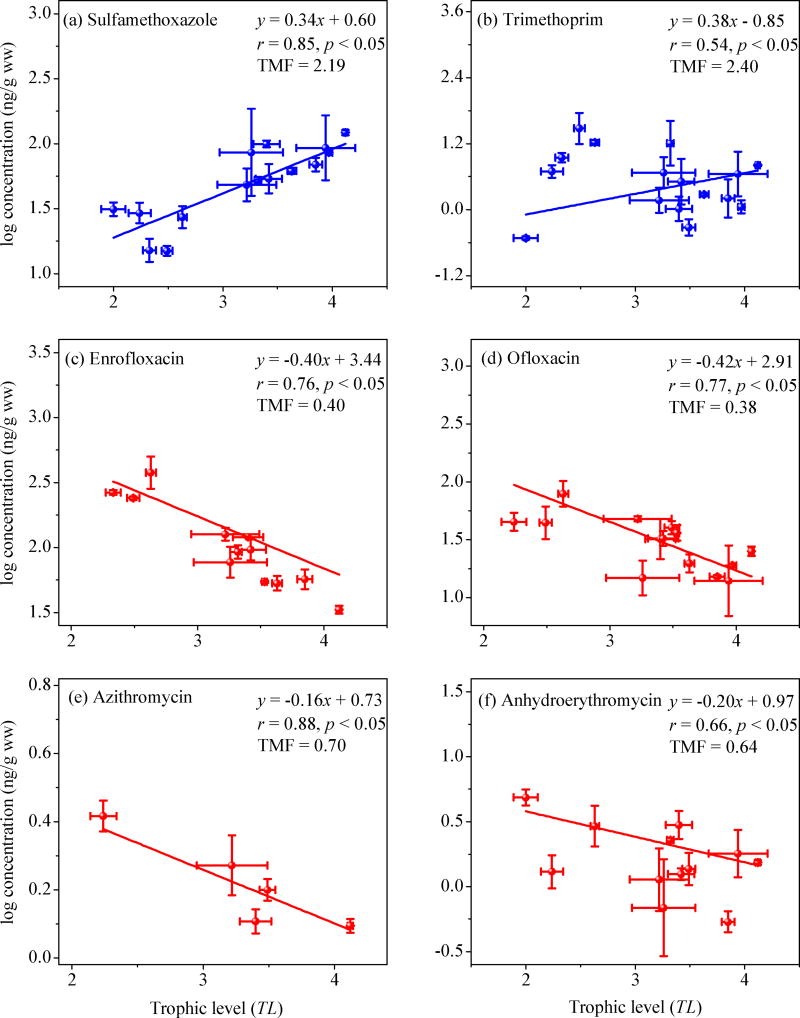
 ), red circles (
 ), green inverted triangles (
 ) and orange diamonds (
 ), respectively. Equations, correlation coefficients (r) and p-values of the regression analyses are shown. LogKOW and logD values of antibiotics (Table S1) were collected from elsewhere.
References
Publication types
MeSH terms
Substances
Grants and funding
LinkOut - more resources
Full Text Sources
Other Literature Sources
