Multicenter Study
. 2017 Apr;124(4):1135-1152.
doi: 10.1213/ANE.0000000000001797.

The SLUScore: A Novel Method for Detecting Hazardous Hypotension in Adult Patients Undergoing Noncardiac Surgical Procedures

Affiliations
Multicenter Study

The SLUScore: A Novel Method for Detecting Hazardous Hypotension in Adult Patients Undergoing Noncardiac Surgical Procedures

Wolf H Stapelfeldt et al. Anesth Analg. 2017 Apr.

Abstract

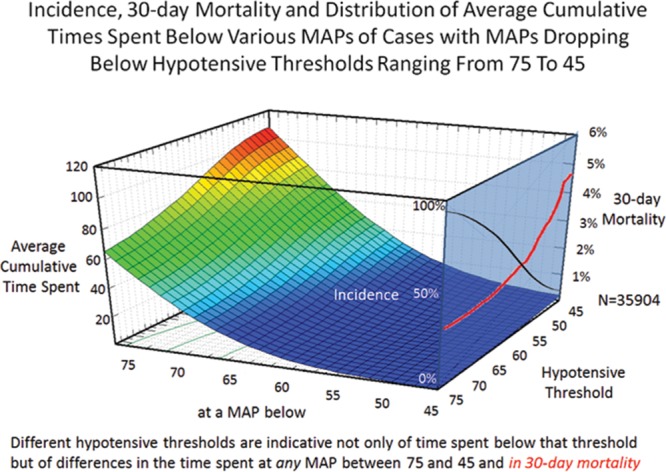
Background: It has been suggested that longer-term postsurgical outcome may be adversely affected by less than severe hypotension under anesthesia. However, evidence-based guidelines are unavailable. The present study was designed to develop a method for identifying patients at increased risk of death within 30 days in association with the severity and duration of intraoperative hypotension.

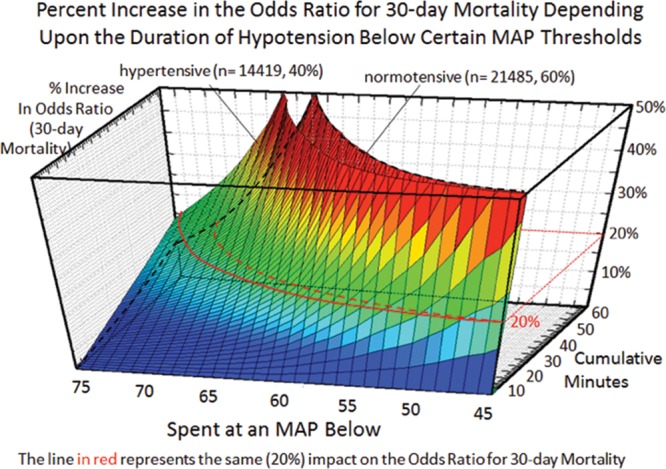
Methods: Intraoperative mean arterial blood pressure recordings of 152,445 adult patients undergoing noncardiac surgery were analyzed for periods of time accumulated below each one of the 31 thresholds between 75 and 45 mm Hg (hypotensive exposure times). In a development cohort of 35,904 patients, the associations were sought between each of these 31 cumulative hypotensive exposure times and 30-day postsurgical mortality. On the basis of covariable-adjusted percentage increases in the odds of mortality per minute elapsed of hypotensive exposure time, certain sets of exposure time limits were calculated that portended certain percentage increases in the odds of mortality. A novel risk-scoring method was conceived by counting the number of exposure time limits that had been exceeded within each respective set, one of them being called the SLUScore. The validity of this new method in identifying patients at increased risk was tested in a multicenter validation cohort consisting of 116,541 patients from Cleveland Clinic, Vanderbilt and Saint Louis Universities. Data were expressed as 95% confidence interval, P < .05 considered significant.

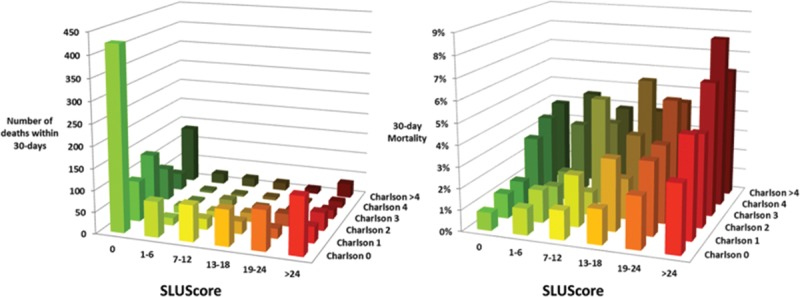
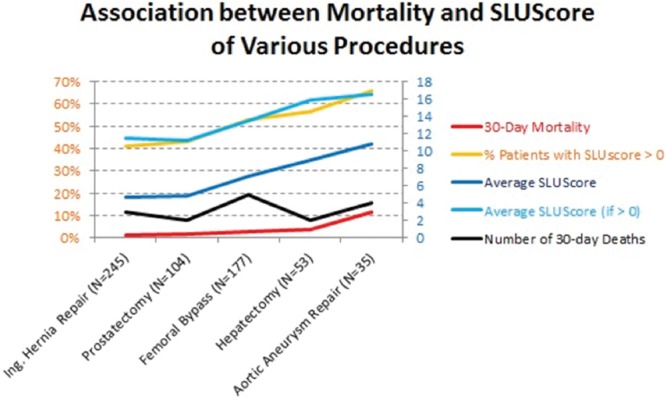
Results: Progressively greater hypotensive exposures were associated with greater 30-day mortality. In the development cohort, covariable-adjusted (age, Charlson score, case duration, history of hypertension) exposure limits were identified for time accumulated below each of the thresholds that portended certain identical (5%-50%) percentage expected increases in the odds of mortality. These exposure time limit sets were shorter in patients with a history of hypertension. A novel risk score, the SLUScore (range 0-31), was conceived as the number of exposure limits exceeded for one of these sets (20% set). A SLUScore > 0 (average 13.8) was found in 40% of patients who had twice the mortality, adjusted odds increasing by 5% per limit exceeded. When tested in the validation cohort, a SLUScore > 0 (average 14.1) identified 35% of patients who had twice the mortality, each incremental limit exceeded portending a 5% compounding increase in adjusted odds of mortality, independent of age and Charlson score (C = 0.73, 0.72-0.74, P < .05).

Conclusions: The SLUScore represents a novel method for identifying nearly 1 in every 3 patients experiencing greater 30-day mortality portended by more severe intraoperative hypotensive exposures.


Conflict of interest statement

Conflicts of Interest: See Disclosures at the end of the article.

Figures

Figure 1.
Figure 1.
Different hypotensive thresholds are indicative not only of time spent below that threshold but of differences in the average cumulative time spent below any mean arterial blood pressure (MAP) between 75 and 45 mm Hg. While nearly all patients crossed the 75 mm Hg threshold, incidence decreased (right blue plane, black curve), whereas 30-day mortality increased (red curve) of patients crossing progressively lower MAP thresholds.
Figure 2.
Figure 2.
Relationship between severity (x-axis) and duration (y-axis) of cumulative hypotensive exposures with 30-day mortality (z-axis). Although even extended exposures below a mean arterial blood pressure (MAP) of 75 had relatively little impact, even just a few minutes accumulated below an MAP of 50 portended a sharp increase in 30-day mortality. Note that for each hypotensive MAP threshold, less time was required to be accumulated in patients with a history of hypertension than in normal patients to incur the same relative increase in the odds ratio for 30-day mortality, the red lines indicating a 20% increase in normal patients (dotted line) versus patients with a history of hypertension (solid line).
Figure 3.
Figure 3.
Number of deaths and 30-day all-cause mortality of a total of 116,541 patients from the 3 different organizations with regard to their Charlson comorbidity score and SLUScore. Both scoring systems independently portended decreased 30-day survival in association with progressively greater scores. With nearly 90% of patients having a Charlson score ≤2, overall more patients’ decreased survival occurred in association with a progressively greater SLUScore than a progressively greater Charlson score.
Figure 4.
Figure 4.
Association between the observed mortality (red, left abscissa) of 5 distinct, sufficiently homogeneous surgical procedures identified in the limited Saint Louis University patient cohort subset (ranging from inguinal hernia repairs to abdominal aortic aneurysm repairs, performed in the indicated number of patients) with these patients’ final SLUScores in terms of incidence of SLUScore > 0 (orange, left abscissa), average SLUScore > 0 (light blue, right abscissa), overall average SLUScore (blue, right abscissa), and observed number of deaths (black, right abscissa). Please note that progressively “higher risk” procedures (those with a higher observed mortality) were also associated with progressively higher SLUScores, meaning that these procedures were associated with greater hypotensive exposures as quantified by their SLUScore. This finding reinforces the idea that the SLUScore cannot be interpreted as any direct measure of the risk associated with hypotensive exposures alone because the type of surgical procedure during which they occur remains a confounding factor that could not be adjusted for because of the low absolute number of deaths incurred with each type of procedure. Still, the SLUScore accomplishes what it was meant and designed to do, namely to help allow those substantial fractions of patients to be identified who are at some greater risk, portended by their greater hypotensive exposures, because of whatever (essentially unknown) procedural risk in conjunction with worse hypotension, independent of other less modifiable factors such as patient age and comorbidity. Both procedural risk (through more refined and potentially less-invasive surgical procedures) and ostensibly some portion of overall risk apparently associated with—if not potentially caused by—accompanying hypotensive exposures (through efforts aimed at minimizing any prolonged periods of hypotension) may be principally amenable to potential future reduction resulting in lower SLUScores and improved outcomes.
Figure 5.
Figure 5.
Association between the SLUScore time limits (see Table 5) and the magnitude of the decrease in mean arterial blood pressure (MAP) relative to 75 mm Hg. Approximately every 5.2 mm Hg decrease in MAP caused the associated SLUScore time limits to be reduced by 50%, suggesting progressively decreased blood flow. Because the association with MAP is not linear but exponential, it is suggestive of a progressive increase in vascular resistance with hypotension. Given the well-known relative sparing of cardiac and cerebral vascular beds, hypotensive vasoconstriction would have most likely produced splanchnic ischemic injury, leading to adverse outcome.
Figure 6.
Figure 6.
Association between patients’ SLUScore and the incidence of various postoperative complications as captured in Saint Louis University’s NSQIP database. A progressive SLUScore portended an increased risk of postoperative renal failure, (deep) organ space infection, and septic shock, suggesting possible splanchnic hypoperfusion as the pathophysiologic abnormality associated with hypotensive exposures.

References

    1. Monk TG, Saini V, Weldon BC, et al. Anesthetic management and one-year mortality after noncardiac surgery. Anesth Analg. 2005;100:4–10. - PubMed
    1. Bijker JB, van Klei WA, Vergouwe Y, et al. Intraoperative hypotension and 1-year mortality after noncardiac surgery. Anesthesiology. 2009;111:1217–1226. - PubMed
    1. Sessler DI, Sigl JC, Kelley SD, et al. Hospital stay and mortality are increased in patients having a “triple low” of low blood pressure, low bispectral index, and low minimum alveolar concentration of volatile anesthesia. Anesthesiology. 2012;116:1195–1203. - PubMed
    1. Stapelfeldt WH, Dalton J, Bromley P, et al. Risk-based decision support thresholds for hypotension in adult patients undergoing non-cardiac surgery. Am Soc Anesthesiol. 2012, A074 (oral presentation).
    1. Walsh M, Devereaux PJ, Garg AX, et al. Relationship between intraoperative mean arterial pressure and clinical outcomes after noncardiac surgery: toward an empirical definition of hypotension. Anesthesiology. 2013;119:507–515. - PubMed

Publication types