. 2017 Jan 20;13(1):e1005241.
doi: 10.1371/journal.pcbi.1005241. eCollection 2017 Jan.

Complex Dynamics of Virus Spread from Low Infection Multiplicities: Implications for the Spread of Oncolytic Viruses

Affiliations

Complex Dynamics of Virus Spread from Low Infection Multiplicities: Implications for the Spread of Oncolytic Viruses

Ignacio A Rodriguez-Brenes et al. PLoS Comput Biol. .

Erratum in

Abstract

While virus growth dynamics have been well-characterized in several infections, data are typically collected once the virus population becomes easily detectable. Earlier dynamics, however, remain less understood. We recently reported unusual early dynamics in an experimental system using adenovirus infection of human embryonic kidney (293) cells. Under identical experimental conditions, inoculation at low infection multiplicities resulted in either robust spread, or in limited spread that eventually stalled, with both outcomes occurring with approximately equal frequencies. The reasons underlying these observations have not been understood. Here, we present further experimental data showing that inhibition of interferon-induced antiviral states in cells results in a significant increase in the percentage of robust infections that are observed, implicating a race between virus replication and the spread of the anti-viral state as a central mechanism. Analysis of a variety of computational models, however, reveals that this alone cannot explain the simultaneous occurrence of both viral growth outcomes under identical conditions, and that additional biological mechanisms have to be invoked to explain the data. One such mechanism is the ability of the virus to overcome the antiviral state through multiple infection of cells. If this is included in the model, two outcomes of viral spread are found to be simultaneously stable, depending on initial conditions. In stochastic versions of such models, the system can go by chance to either state from identical initial conditions, with the relative frequency of the outcomes depending on the strength of the interferon-based anti-viral response, consistent with the experiments. This demonstrates considerable complexity during the early phase of the infection that can influence the ability of a virus to become successfully established. Implications for the initial dynamics of oncolytic virus spread through tumors are discussed.


Conflict of interest statement

The authors have declared that no competing interests exist.

Figures

Fig 1
Fig 1. Limited and robust infections.
Ad-293 cells were infected with low doses of AdEGFPuci under conditions of plaque formation (10–100 infectious units/5 cm culture dish, agar overlay), and areas of infection were visualized by fluorescence microscopy for GFP. Limited (A) and robust areas (B) were observed on the same plates at 12 days post-infection. The bars represent 500 μ. The limited area of infection is also shown at expanded magnification in panel A. The robust area (B) required multiple photographic fields, and a montage is shown.
Fig 2
Fig 2
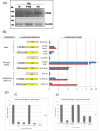
(A,B) Induction of OAS2 expression by AdEGFPuci infection. A) Ad-293 cells were infected with AdEGFPuci at an MOI of 10, and RNA was extracted 72 hr post-infection (Ad). For comparison, cells were incubated in medium alone (M or Mock), or they were treated for the same period with 50 μg/ml human interferon β (IFNβ). The RNAs were used in RT-PCR reactions for several interferon-responsive genes; only OAS2 RNA showed significant enhancement after AdEGFPuci infection; low level of enhancement by IFNβ was also observed. Amplification for the same number of cycles for β-actin RNA was performed for normalization. B) Ad-293 cells were transfected with luciferase reporter plasmids driven by a canonical interferon response element (5XISRE), the upstream regulatory sequences of the OAS2 promoter (OAS2), or the equivalent luciferase construct lacking promoter/enhancer sequences (Null). The transfected cells were treated with 50 μg/ml IFNβ, infected with AdEGFPuci (MOI of 10), or not treated (Mock), and lysates from replicate cultures were harvested at 24 and 72 hr. Luciferase assays were carried out using the dual luciferase assay system, and luciferase activities relative to the reference renilla luciferase activity are shown in arbitrary units. Activities at 24 hr are shown in blue, and those at 72 hr are shown in red. Bars indicate standard deviations from replicate cultures. C) Inhibition of induction of OAS2. i). Ad-293 cells were incubated with valproic acid (VPA) at different concentrations along with 50 μg/ml IFNβ. At 24 and 72 hr, levels of OAS2 RNA in the cells were measured by qRT-PCR. The levels of OAS2 RNA relative to no VPA treatment (set at 1) are shown for the different VPA concentrations. ii). Ad-293 cells were incubated with 1 μg/ml anti-IFNAR mAb, or 5 ng/ml rapamycin, along with 50 μg/ml IFNβ. qRT-PCR assays for OAS2 RNA (relative to no treatment) are shown for 24 and 72 hr post-treatment. Error bars represent standard deviations of triplicate assays.
Fig 3
Fig 3
A) Bistability in model (3). The trajectories labeled with “1” depict an example of a weak limited infection. The trajectories labeled with “2” depict a robust viral infection. The only difference between the plots is the initial number of infected cells, four for the limited infection and five for the robust infection. B) Stochastic version of model (3). Panel shows two simulations with identical initial conditions. Stochastic events at early stages of the infection can push the results into in either a weak limited infection that is eventually extinguished (labeled “1”), or in a persistent robust infection that significantly reduces the overall number of cells (labeled “2'”). C) Distribution of the maximum number of infected cells when there is a limited infection. Although the initial number of infected cells is very small (four cells) at their maximum extension limited infections average approximately 43 cells. Results are based on 1000 simulations. D) Probability of the emergence of a robust infection as a function of the normalized level of the antiviral induction rate γ. Results are based on the 1000 simulations for each level of the antiviral induction rate depicted in the panel. Initial conditions: y1(0) = 4, and x1(0) = 996 (all other cell types equal to zero). Error bars indicate 95% confidence intervals. Parameters: In all panels λ = 10, d = 0.01, β = 0.001, g = 0.1, and a = 0.05; γ = 10 in panels A) and B) and it is equal to 5 in C); in panel D) the 100% level of the antiviral induction rate corresponds to a value of γ = 50.
Fig 4
Fig 4
A) Spatial spread of a robust infection in the stochastic metapopulation model based on system (model (4)). There are n = 51 local patches of cells. The expected number of cells in each patch prior to the infection is k = 121 (indicated by the dashed lines). At the start of the simulation all patches contain k uninfected cells and three infected cells are placed in the middle of the spatial array (i = 26). B) Time evolution of the infected and uninfected cell populations for the simulation in panel A. The populations refer to the total number of cells in the spatial array. C) Example of a limited infection in the metapopulation model. The infection first takes off, but then stalls and regresses until it is eventually extinguished from the cell population. D) Probability of the emergence of a robust infection as a function of the normalized level of the antiviral induction rate γ. Based on the 1000 simulations for each level of the antiviral induction rate. Error bars indicate 95% confidence intervals. Parameters in panels A-D: λ = 0.0194, d = 0.0194, g = 0.0202, a = 0.0792, β = 1, γ = 10000, and m = 2. Panels (E-G): Robust and limited infections in the two dimensional agent-based model. E) At time t = 0 nine infected cells are placed in the center of a 300 × 300 lattice filled with uninfected cells. Stochastically the simulations result in either limited or robust infections. F) Snapshot of a robust infection, taken at a time point when the system stochastically oscillated around a steady state (see Figure D(i) in Supplementary Materials). Even if there is a ring structure during initial growth, this breaks down over time due to the stochastic dynamics and does not persist in the long-term. G) Snapshot of a limited infection at its maximum extension. Parameters: r = 0.1262, β = 1, γ = 6.238 × 10⁴, g = 18.29, a = 2.403. (See Figure D for the time series of the simulations in the Supplementary Materials).

Similar articles

Cited by

References

    1. Nowak MA, May RM (2000) Virus dynamics. Mathematical principles of immunology and virology.: Oxford University Press.
    1. Perelson AS (2002) Modelling viral and immune system dynamics. Nature Rev Immunol 2: 28–36. - PubMed
    1. Perelson AS, Ribeiro RM (2013) Modeling the within-host dynamics of HIV infection. BMC Biol 11: 96 10.1186/1741-7007-11-96 - DOI - PMC - PubMed
    1. Nowak MA, Lloyd AL, Vasquez GM, Wiltrout TA, Wahl LM, et al. (1997) Viral dynamics of primary viremia and antiretroviral therapy in simian immunodeficiency virus infection. J Virol 71: 7518–7525. - PMC - PubMed
    1. Bangham CRM, Hall S.E., Jeffrey K.J.M, Vine A.M., Witkover A., Nowak M.A., Wodarz D., Usuku K., Osame M. (1999) Genetic control and dynamics of the cellular immune response to the human T-cell leukaemia virus, HTLV-1. Philosophical Transactions of the Royal Society, Series B 354: 691–700. - PMC - PubMed

Publication types