. 2017 Jan 20;12(1):e0169661.
doi: 10.1371/journal.pone.0169661. eCollection 2017.

Parenclitic Network Analysis of Methylation Data for Cancer Identification

Affiliations

Parenclitic Network Analysis of Methylation Data for Cancer Identification

Alexander Karsakov et al. PLoS One. .

Abstract

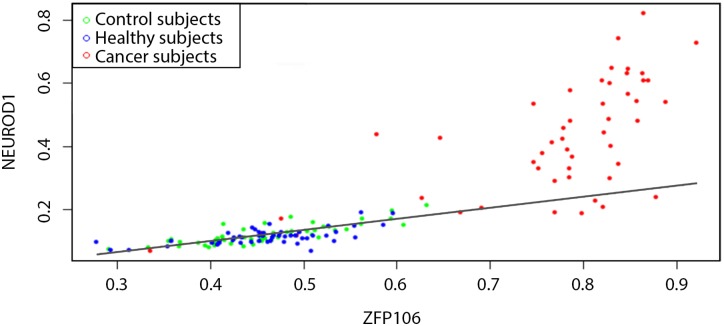
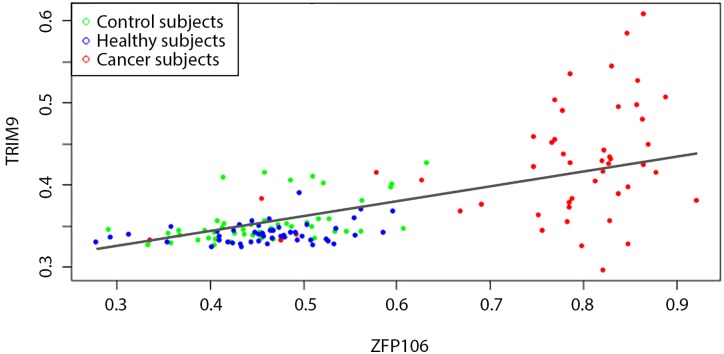
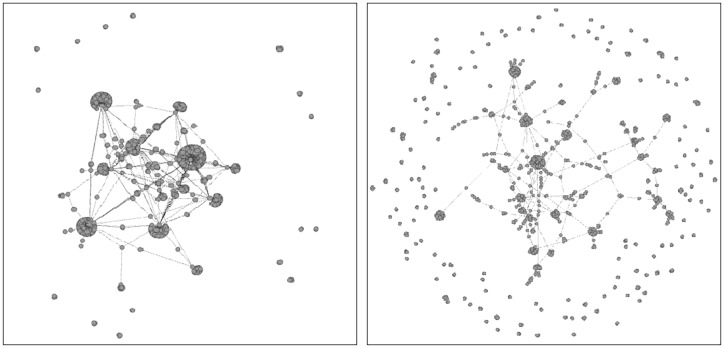
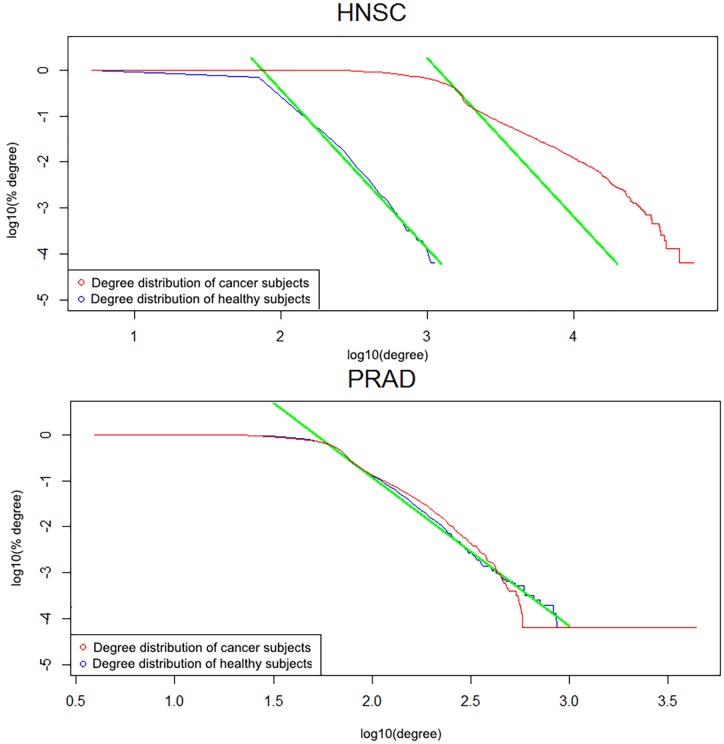
We make use of ideas from the theory of complex networks to implement a machine learning classification of human DNA methylation data, that carry signatures of cancer development. The data were obtained from patients with various kinds of cancers and represented as parenclictic networks, wherein nodes correspond to genes, and edges are weighted according to pairwise variation from control group subjects. We demonstrate that for the 10 types of cancer under study, it is possible to obtain a high performance of binary classification between cancer-positive and negative samples based on network measures. Remarkably, an accuracy as high as 93-99% is achieved with only 12 network topology indices, in a dramatic reduction of complexity from the original 15295 gene methylation levels. Moreover, it was found that the parenclictic networks are scale-free in cancer-negative subjects, and deviate from the power-law node degree distribution in cancer. The node centrality ranking and arising modular structure could provide insights into the systems biology of cancer.


Conflict of interest statement

The authors have declared that no competing interests exist.

Figures

Fig 1
Fig 1. Determining the edge weight between ZFP106 and NEUROD1 genes.
Each point corresponds to gene methylation levels in the control group (green), other BRCA-negative (blue) and BRCA-positive (red) subjects. The solid line shows the linear regression model (1). The mismatch to Eq (2) is, in general, a good discriminator between healthy and tumour samples.
Fig 2
Fig 2. Determining the edge weight between ZFP106 and TRIM9 genes.
Each point corresponds to gene methylation levels in the control group (green), other BRCA-negative (blue) and BRCA-positive (red) subjects. The solid line shows the linear regression model (1). While the data sets for healthy and tumour samples are quite distinct, the mismatch Eq (2) is of the same order of magnitude for both classes. Employing the Mahalanobis distance Eq (3) overcomes this problem.
Fig 3
Fig 3. Typical examples of parenclictic networks constructed from gene methylation profiles for cancer (left) and normal (right) samples from BRCA data.
Only a 1000 of the strongest edges and their incident nodes are shown. Note the pronounced modular structure for the cancer network.
Fig 4
Fig 4. Average complementary cumulative node degree distribution (the fraction of nodes, for which the degree exceeds a given value) for HNSC (top) and PRAD (bottom) subjects.
Green lines on the log-log plots display the power-law model best fit.

References

    1. Feinberg A, Ohlsson R, Henikoff S. The epigenetic progenitor origin of human cancer. Nat Rev Genet. 2006; 7: 21–33. 10.1038/nrg1748 - DOI - PubMed
    1. Cooney C. Epigenetics: DNA-Based Mirror of our Environment? Disease Markers. 2007; 23: 121–137. 10.1155/2007/394034 - DOI - PMC - PubMed
    1. Christensen BC, Houseman EA, Marsit CJ, Zheng S, Wrensch MR, Wiemels JL, et al. Aging and environmental exposures alter tissue-specific dna methylation dependent upon cpg island context. PLoS Genetics. 2009; 5: e1000602 10.1371/journal.pgen.1000602 - DOI - PMC - PubMed
    1. Jaffe AE, Feinberg AP, Irizarry RA, Leek JT. Significance analysis and statistical dissection of variably methylated regions. Biostatistics. 2012; 13: 166–178. 10.1093/biostatistics/kxr013 - DOI - PMC - PubMed
    1. Hansen KD, Timp W, Bravo HC, Sabunciyan S, Langmead B, McDonald OG, et al. Increased methylation variation in epigenetic domains across cancer types. Nat Genet. 2011; 43: 768–775. 10.1038/ng.865 - DOI - PMC - PubMed

LinkOut - more resources