. 2017 Jan 20;12(1):e0170561.
doi: 10.1371/journal.pone.0170561. eCollection 2017.

Quantification of Pulmonary Fibrosis in a Bleomycin Mouse Model Using Automated Histological Image Analysis

Affiliations

Quantification of Pulmonary Fibrosis in a Bleomycin Mouse Model Using Automated Histological Image Analysis

Jean-Claude Gilhodes et al. PLoS One. .

Abstract

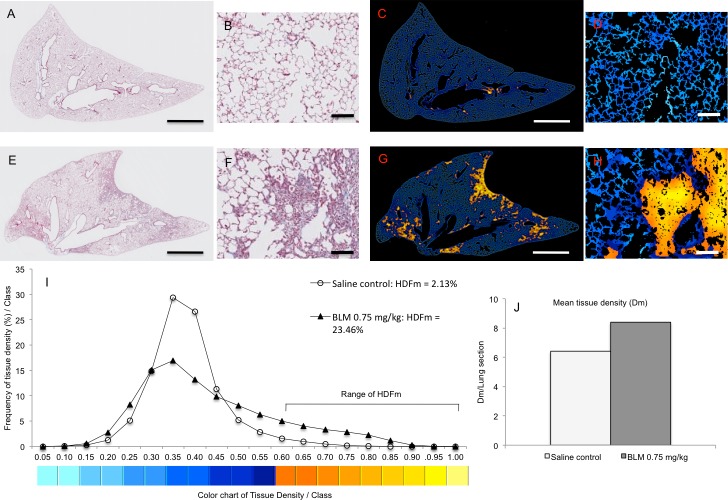
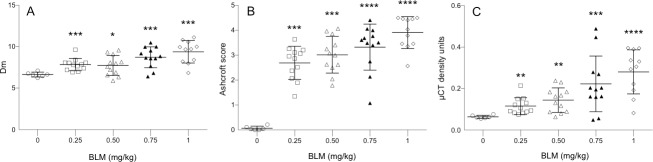
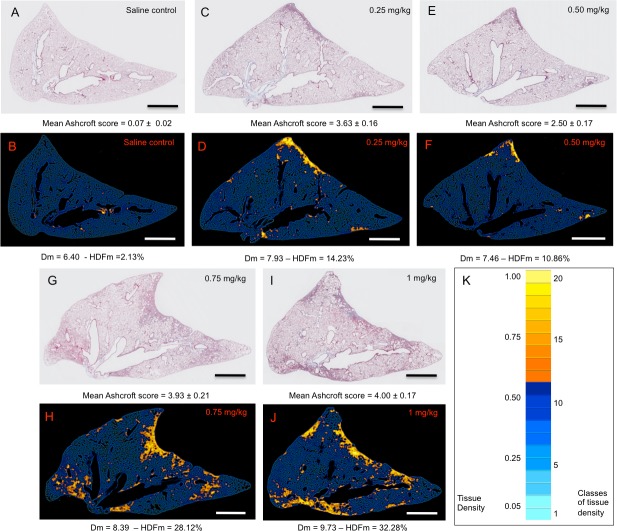
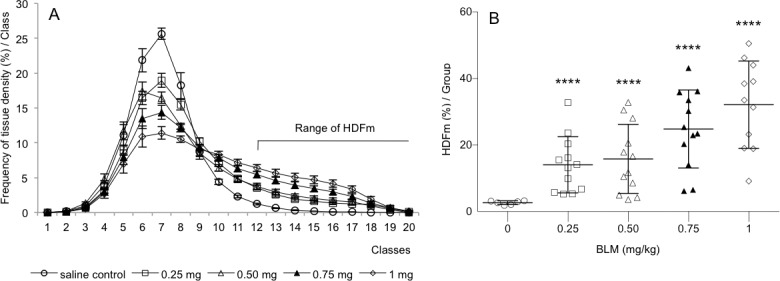
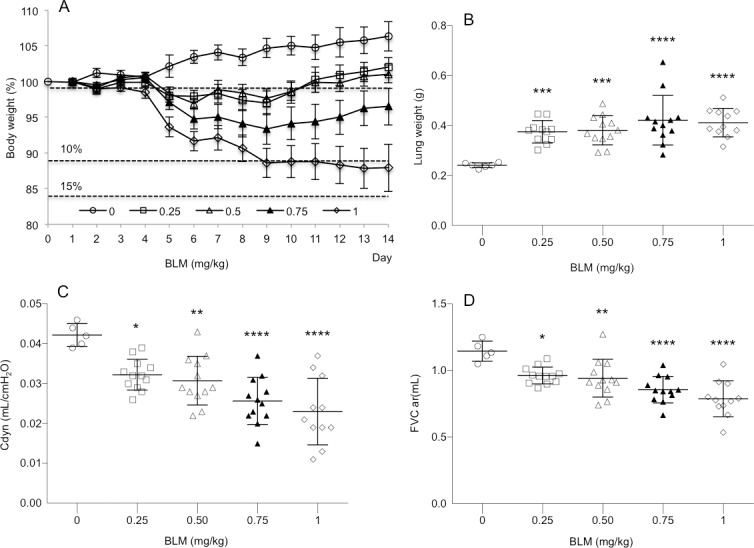
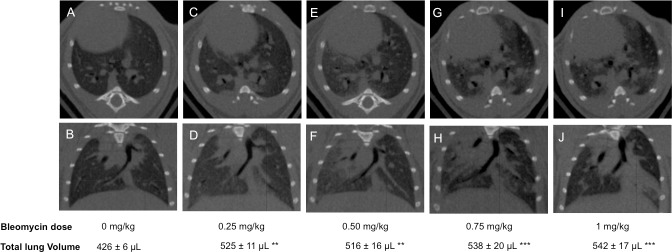
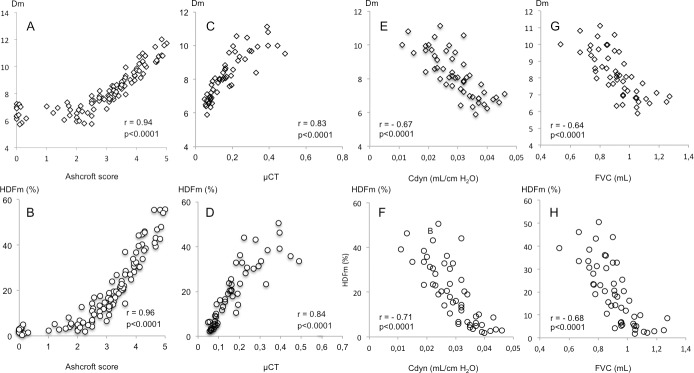
Current literature on pulmonary fibrosis induced in animal models highlights the need of an accurate, reliable and reproducible histological quantitative analysis. One of the major limits of histological scoring concerns the fact that it is observer-dependent and consequently subject to variability, which may preclude comparative studies between different laboratories. To achieve a reliable and observer-independent quantification of lung fibrosis we developed an automated software histological image analysis performed from digital image of entire lung sections. This automated analysis was compared to standard evaluation methods with regard to its validation as an end-point measure of fibrosis. Lung fibrosis was induced in mice by intratracheal administration of bleomycin (BLM) at 0.25, 0.5, 0.75 and 1 mg/kg. A detailed characterization of BLM-induced fibrosis was performed 14 days after BLM administration using lung function testing, micro-computed tomography and Ashcroft scoring analysis. Quantification of fibrosis by automated analysis was assessed based on pulmonary tissue density measured from thousands of micro-tiles processed from digital images of entire lung sections. Prior to analysis, large bronchi and vessels were manually excluded from the original images. Measurement of fibrosis has been expressed by two indexes: the mean pulmonary tissue density and the high pulmonary tissue density frequency. We showed that tissue density indexes gave access to a very accurate and reliable quantification of morphological changes induced by BLM even for the lowest concentration used (0.25 mg/kg). A reconstructed 2D-image of the entire lung section at high resolution (3.6 μm/pixel) has been performed from tissue density values allowing the visualization of their distribution throughout fibrotic and non-fibrotic regions. A significant correlation (p<0.0001) was found between automated analysis and the above standard evaluation methods. This correlation establishes automated analysis as a novel end-point measure of BLM-induced lung fibrosis in mice, which will be very valuable for future preclinical drug explorations.


Conflict of interest statement

The authors declare that their commercial affiliation as given in the funding statement does not alter the adherence to all PLOS ONE policies on sharing data and materials.

Figures

Fig 1
Fig 1. Representative images of original and 2D-reconstructed lung sections for the quantification and the mapping of pulmonary tissue density by means of digital automatic analysis.
Masson trichrome-stained images (A, E) and their respective 2D-reconstructed images (C, G) correspond to a lung section from saline control (A, C) and BLM-treated (0.75 mg/kg) lungs (E, G). Panels B, D, F, H show details from their original stained (B, F) and 2D-reconstructed (D, H) images at higher magnification. Lung tissue density was determined from thousands of micro-tiles crisscrossing entire lung sections. For mapping thousands tissue density values throughout lung section density values were graded in 20 classes of increasing values (I) and pseudocolours were assigned from blue (low density values) to yellow (high density values) according to their classification. Note that high density values (yellow) were restricted in alveolar parenchyma of BLM-treated lung (G, H) and located in fibrotic lesions evidenced in the respective original stained image (E, F). The frequency of tissue density (I) was determined from the classification of the whole unitary density values obtained in each lung section (A, E). HDFm index corresponds to the sum of the frequencies of the highest tissue density (classes 12 to 20) expressed in fibrotic foci. The mean tissue density (Dm) (J) was evaluated for each lung section from thousands of micro-tiles. Scale bars: 1 mm (A, C, E, G), 100 μm (B, D, F, H).
Fig 2
Fig 2. Bleomycin (BLM) administration resulted in elevated lung tissue density and fibrotic Ashcroft scoring.
14 days after intratracheal BLM administration at doses of 0.25, 0.5, 0.75 and 1.0 mg/kg lung tissue alterations was assessed on the same whole lung slices stained with Masson trichrome by automatic histological analysis (A) and Ashcroft scoring (B) and in vivo in the same animals by means of micro-CT analysis (C). BLM-treated mice (n = 12/dosing group) were compared to saline control mice (n = 6). Data are shown as mean ± s.e.m. The mean tissue density (Dm) determined by automatic histological analysis (A) was assessed from thousands of micro-tiles covering the whole lung sections of each group of mice. *p<0.05, **p<0.01, ***p<0.001, ****p<0.0001 was considered statistically significant in comparison to the non BLM-treated control group. ns: non-significant.
Fig 3
Fig 3. Representative original images of Masson trichrome stained lung sections and their corresponding automated 2D-reconstructed images according to their respective lung tissue density values.
Original images (A, C, E, G, I) correspond to representative Masson trichrome stained lung sections from saline control (A) and BLM-treated lungs at 0.25 mg/kg (C), 0.50 mg/kg (E), 0.75 mg/kg (G) and 1 mg/kg (I). Reconstructed-2D lung sections of their respective original images were obtained by grading their tissue density values, obtained from thousands micro-tiles, in 20 classes of increasing values. Pseudocolours were then assigned to tissue densities according to their class from light blue (low density values) to yellow (high density values) (K). For each original image of saline control and BLM-treated lungs the value of their Ascroft score (mean ± s.e.m.) was indicated. Regarding their corresponding 2D-reconstructed images the value of their Dm (mean ± s.e.m.) and HDFm was indicated, respectively. Note that high density values visualized in 2D-reconstructed images were focalized in fibrotic regions evidenced in their corresponding Masson trichrome stained lung sections. Scale bars: 1 mm.
Fig 4
Fig 4. Distribution of tissue density frequency and determination of high tissue density frequency (HDFm) in saline control and bleomycin (BLM)-treated lungs.
Lung tissue density was determined from several thousands of micro-tiles covering the whole lung sections of saline control (n = 6) and BLM-treated (n = 12/dosing group) mice. A: Tissue density values were graded in 20 classes of increasing values (mean ± s.e.m) and their frequency per class was expressed in percent (compared to the total number of density values). B: BLM administration induced a dose-dependent increase of HDFm which corresponded to the sum of the percentage of tissue densities from class 12 to 20. ****p<0.0001 was considered statistically significant in comparison to the non BLM-treated control group.
Fig 5
Fig 5. Bleomycin (BLM) administration resulted in a reduced body weight gain and increased lung wet weight and in parallel in impaired lung functions.
14 days after intratracheal BLM administration at doses of 0.25, 0.5, 0.75 and 1.0 mg/kg the mean ± s.e.m. body weight (A), lung wet weight (B), dynamic lung compliance (Cdyn) (C) and force vital capacity (FVC) (D) were determined in saline control (n = 6) and BLM-treated (n = 12/dosing group) mice. *p<0.05, **p<0.01, ***p<0.001, ****p<0.0001 was considered statistically significant in comparison to the non bleomycin-treated control group.
Fig 6
Fig 6. Representative micro-CT images of lung sections from saline control and bleomycin-treated mice.
Transverse (top row) and corresponding coronal (bottom row) micro-CT images acquired at 14 days after saline (control) (A, B) and bleomycin administration at the concentration of 0.25 mg/kg (C, D), 0.50 mg/kg (E, F), 0.75 mg/kg (G, H) and 1mg/kg (I, J). Total lung volume is given as mean ± s.e.m. (n = 12/dosing group). **p<0.01, ***p<0.001 was considered statistically significant in comparison to the non bleomycin-treated control group.
Fig 7
Fig 7. Correlation of tissue density (Dm) and high frequency density (HDFm) indexes with Ashcroft score, micro-CT and lung function measurements in the bleomycin mice model.
The agreement of the Dm and HDFm measurements with those obtained with Ashcroft scoring (A, B), micro-CT analysis (C, D), dynamic lung compliance (Cdyn) (E, F) and force vital capacity (FVC) (G, H) was evaluated using linear regression analysis. Data correspond to mean values per animal of saline control (n = 6) and BLM-treated (0.25, 0.50, 0.75, 1 mg/kg) (n = 12/dosing group) mice. r = Spearman correlation coefficient.

References

    1. Raghu G, Rochwerg B, Zhang Y, Garcia CA, Azuma A, Behr J, et al. (2015) An Official ATS/ERS/JRS/ALAT Clinical Practice Guideline: Treatment of Idiopathic Pulmonary Fibrosis. An Update of the 2011 Clinical Practice Guideline. Am J Respir Crit Care Med 192: 3–19. - PubMed
    1. Richeldi L, du Bois RM, Raghu G, Azuma A, Brown KK, Costabel U, et al. (2014) Efficacy and safety of nintedanib in idiopathic pulmonary fibrosis. N Engl J Med 370: 2071–2082. 10.1056/NEJMoa1402584 - DOI - PubMed
    1. King TE, Bradford WZ, Castro-Bernardini S, Fagan EA, Glaspole I, Glassberg MK, et al. (2014) A phase 3 trial of pirfenidone in patients with idiopathic pulmonary fibrosis. N Engl J Med 370: 2083–2092. 10.1056/NEJMoa1402582 - DOI - PubMed
    1. Moeller A, Ask K, Warburton D, Gauldie J, Kolb M (2008) The bleomycin animal model: a useful tool to investigate treatment options for idiopathic pulmonary fibrosis? Int J Biochem Cell Biol 40: 362–382. 10.1016/j.biocel.2007.08.011 - DOI - PMC - PubMed
    1. Schaefer CJ, Ruhrmund DW, Pan L, Seivert SD, Kossen K (2011) Antifibrotic activities of pirfenidone in animal models. Eur Respir Rev 20: 85–97. 10.1183/09059180.00001111 - DOI - PMC - PubMed