Multicenter Study
. 2018 Jan;67(1):128-137.
doi: 10.1136/gutjnl-2016-312432. Epub 2017 Jan 20.

Metabolic biomarker signature to differentiate pancreatic ductal adenocarcinoma from chronic pancreatitis

Affiliations
Multicenter Study

Metabolic biomarker signature to differentiate pancreatic ductal adenocarcinoma from chronic pancreatitis

Julia Mayerle et al. Gut. 2018 Jan.

Erratum in

Abstract

Objective: Current non-invasive diagnostic tests can distinguish between pancreatic cancer (pancreatic ductal adenocarcinoma (PDAC)) and chronic pancreatitis (CP) in only about two thirds of patients. We have searched for blood-derived metabolite biomarkers for this diagnostic purpose.

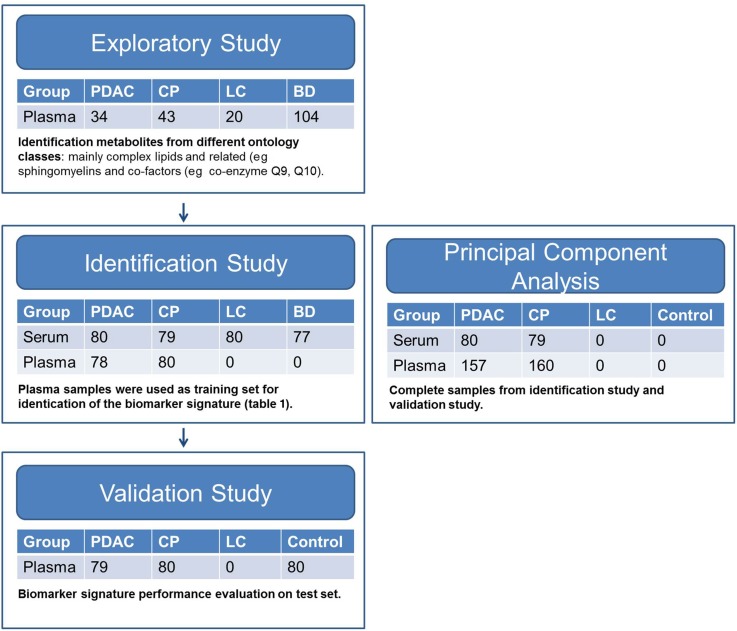
Design: For a case-control study in three tertiary referral centres, 914 subjects were prospectively recruited with PDAC (n=271), CP (n=282), liver cirrhosis (n=100) or healthy as well as non-pancreatic disease controls (n=261) in three consecutive studies. Metabolomic profiles of plasma and serum samples were generated from 477 metabolites identified by gas chromatography-mass spectrometry and liquid chromatography-tandem mass spectrometry.

Results: A biomarker signature (nine metabolites and additionally CA19-9) was identified for the differential diagnosis between PDAC and CP. The biomarker signature distinguished PDAC from CP in the training set with an area under the curve (AUC) of 0.96 (95% CI 0.93-0.98). The biomarker signature cut-off of 0.384 at 85% fixed specificity showed a sensitivity of 94.9% (95% CI 87.0%-97.0%). In the test set, an AUC of 0.94 (95% CI 0.91-0.97) and, using the same cut-off, a sensitivity of 89.9% (95% CI 81.0%-95.5%) and a specificity of 91.3% (95% CI 82.8%-96.4%) were achieved, successfully validating the biomarker signature.

Conclusions: In patients with CP with an increased risk for pancreatic cancer (cumulative incidence 1.95%), the performance of this biomarker signature results in a negative predictive value of 99.9% (95% CI 99.7%-99.9%) (training set) and 99.8% (95% CI 99.6%-99.9%) (test set). In one third of our patients, the clinical use of this biomarker signature would have improved diagnosis and treatment stratification in comparison to CA19-9.

Keywords: PANCREATIC CANCER; PANCREATITIS.


Conflict of interest statement

Competing interests: None declared.

Figures

Figure 1
Figure 1
Study design. Description of the exploratory, identification study and validation study. In addition, description of cohort for the principal component analysis (see figure 2A). The identification study was performed in two centres on serum and plasma. Plasma samples were used to generate a training set. Samples for the validation study were recruited independently as test set. Participant numbers are given for each study phase. PDAC, pancreatic ductal adenocarcinoma; CP, chronic pancreatitis; LC, liver cirrhosis; BD, blood donors; controls, non-pancreatic disease preoperative patients.
Figure 2
Figure 2
(A) Principal component analysis of pancreatic ductal adenocarcinoma (PDAC) and chronic pancreatitis (CP) metabolomics data from the combined identification and validation data sets (plasma and serum samples). The numbers on the axes are representative for the fraction of variability captured by the principal component. In total, 36 principal components were calculated capturing 55% of the variability. Data were log10 transformed and scaled to unit variance. (B) Number of significant metabolite changes in PDAC versus CP. Plasma and serum data sets comprise two independent sample collections from two different hospitals. Statistical analysis was done by a linear model on log10-transformed data with disease, gender, BMI, age and storage time as fixed effects on the identification study. Multiple testing was addressed by calculating the false discovery rate (FDR) described by Benjamini and Hochberg. Significance level was set to p<0.05 and FDR<0.2.
Figure 3
Figure 3
(A–D) ROC curves of the biomarker (biomarker signature) results on EDTA plasma samples from all patients with pancreatic cancer versus patients with chronic pancreatitis (CP) (A) as well as from patients with resectable pancreatic ductal adenocarcinoma (PDAC) only in comparison to the patients with CP (B). The left panel represents the training set, whereas the right panel depicts the test set. ROC curves of the biomarker (biomarker signature) results on serum samples from all patients with pancreatic cancer versus blood donors and on EDTA plasma samples from all patients with pancreatic cancer versus non-pancreatic controls (C) as well as from patients with resectable PDAC only (D) in comparison to blood donors or non-pancreatic controls. EN included a 10-fold cross-validation and was applied on log10-transformed data. AUC, area under the curve.
Figure 4
Figure 4
(A) Score of the pancreatic biomarker signature identified in the training set and applied on the test set. Non-pancreatic controls in green (n=80), chronic pancreatitis in yellow (n=80) and pancreatic cancer in blue (n=79). Box plots give median, upper quartile and lower quartile by the box and the upper adjacent and lower adjacent values by the whiskers. The upper adjacent value is the largest observation that is less than or equal to the upper inner fence, which is the third quartile plus 1.5-fold IQR. The lower adjacent value gives the corresponding value for downregulation. The diagnostic cut-off of the pancreatic biomarker score was set to ≥0.384. (B) Scatter plot for graphical representation of the biomarker signature score. Classifiers are the biomarker signature generated in the training set and presented here for the test set. Y-axis score of biomarker signature with the cut-off of ≥0.384 and CA19-9 on the X axis with the cut-off ≥37 U/mL. Chronic pancreatitis in yellow circles (n=80) and pancreatic cancer in blue circles (n=79). Numbers give subjects that benefit from the biomarker signature and all numbers in the respective area of the plot.

Comment in

References

    1. Rahib L, Smith BD, Aizenberg R, et al. . Projecting cancer incidence and deaths to 2030: the unexpected burden of thyroid, liver, and pancreas cancers in the United States. Cancer Res 2014;74:2913–21. 10.1158/0008-5472.CAN-14-0155 - DOI - PubMed
    1. Peery AF, Dellon ES, Lund J, et al. . Burden of gastrointestinal disease in the United States: 2012 update. Gastroenterology 2012;143:1179–87 e1–3. - PMC - PubMed
    1. Lowenfels AB, Maisonneuve P, Cavallini G, et al. . Pancreatitis and the risk of pancreatic cancer. International Pancreatitis Study Group. N Engl J Med 1993;328:1433–7. 10.1056/NEJM199305203282001 - DOI - PubMed
    1. Duffy MJ, Sturgeon C, Lamerz R, et al. . Tumor markers in pancreatic cancer: a European Group on Tumor Markers (EGTM) status report. Ann Oncol 2010;21:441–7. - PubMed
    1. Gui JC, Yan WL, Liu XD. CA19-9 and CA242 as tumor markers for the diagnosis of pancreatic cancer: a meta-analysis. Clin Exp Med 2013;14:225–33. - PubMed

Substances