. 2017 Mar 15;77(6):1453-1464.
doi: 10.1158/0008-5472.CAN-16-1645. Epub 2017 Jan 20.

Bone Marrow Adipocytes Facilitate Fatty Acid Oxidation Activating AMPK and a Transcriptional Network Supporting Survival of Acute Monocytic Leukemia Cells

Affiliations

Bone Marrow Adipocytes Facilitate Fatty Acid Oxidation Activating AMPK and a Transcriptional Network Supporting Survival of Acute Monocytic Leukemia Cells

Yoko Tabe et al. Cancer Res. .

Abstract

Leukemia cells in the bone marrow must meet the biochemical demands of increased cell proliferation and also survive by continually adapting to fluctuations in nutrient and oxygen availability. Thus, targeting metabolic abnormalities in leukemia cells located in the bone marrow is a novel therapeutic approach. In this study, we investigated the metabolic role of bone marrow adipocytes in supporting the growth of leukemic blasts. Prevention of nutrient starvation-induced apoptosis of leukemic cells by bone marrow adipocytes, as well as the metabolic and molecular mechanisms involved in this process, was investigated using various analytic techniques. In acute monocytic leukemia (AMoL) cells, the prevention of spontaneous apoptosis by bone marrow adipocytes was associated with an increase in fatty acid β-oxidation (FAO) along with the upregulation of PPARγ, FABP4, CD36, and BCL2 genes. In AMoL cells, bone marrow adipocyte coculture increased adiponectin receptor gene expression and its downstream target stress response kinase AMPK, p38 MAPK with autophagy activation, and upregulated antiapoptotic chaperone HSPs. Inhibition of FAO disrupted metabolic homeostasis, increased reactive oxygen species production, and induced the integrated stress response mediator ATF4 and apoptosis in AMoL cells cocultured with bone marrow adipocytes. Our results suggest that bone marrow adipocytes support AMoL cell survival by regulating their metabolic energy balance and that the disruption of FAO in bone marrow adipocytes may be an alternative, novel therapeutic strategy for AMoL therapy. Cancer Res; 77(6); 1453-64. ©2017 AACR.


Conflict of interest statement

Conflict of Interest: The authors declare no competing financial interests.

Figures

Figure 1
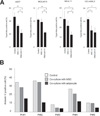
Figure 1. BM adipocytes protect acute monocytic leukemia cells from apoptosis
(A) U937, MOLM13, and MV4;11 AMoL cells and OCI-AML3 AMMoL cells were cultured 48 h in the presence or absence of MSCs or MSC-derived BM adipocytes under serum-starved conditions. Percentages of cell death were determined by cell counts using the Trypan blue exclusion method. Graphs show the mean ± SD of the results from three independent experiments. *p < 0.05; **p < 0.01. (B) Primary cells from five AMoL patients were cultured 48 h in the presence or absence of MSCs or MSC-derived BM adipocytes. Percentage of apoptotic cells (annexin V positive) was detected by flow cytometry.
Figure 2
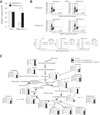
Figure 2. Co-culture with BM adipocytes and FAO inhibition induce metabolic alterations in U937 cells
(A) U937 cells were treated with FAO inhibitor etomoxir (50 µM) for 48 h in the presence or absence of MSC-derived BM adipocytes under serum-starved conditions. Percentage of apoptotic cells (annexin V positive) was detected by flow cytometry. Graphs show the mean ± SD of results of three independent experiments. Cont, controls; *p < 0.05. (B) U937 cells were treated with FAO inhibitor etomoxir (50 µM) for 24 h in the presence or absence of MSC-derived BM adipocytes under serum-starved conditions. The representatives of histogram of CellROX in the viable cells of indicated conditions of three independent experiments are shown. Mean fluorescence intensity (MFI) are the mean ± SD of results of three independent experiments. (C) Quantified levels of metabolites in U937 cells co-cultured with BM adipocytes in the presence or absence of etomoxir were determined by CE-TOF-MS analysis. The quantification data are superimposed on a metabolic pathway map that includes the glycolysis and Krebs pathways. Results shown are representative of three independent CE-TOF-MS experiments. Bars, SD. All p-values were determined by the Wilcoxon matched pair test. *p < 0.05; **p < 0.01.
Figure 3
Figure 3. Co-culture with BM adipocytes induces gene and protein expression changes and AMPK activation in AMoL cells
Cells were cultured with or without BM adipocytes for 24 h. (A) Quantitative RT-PCR analysis showing mRNA expression of PPARγ, CD36, FABP4, CPT-1, and BCL2 in U937 cells after 24 h co-culture with MSCs or MSC-derived BM adipocytes; Co, controls. The abundance of transcripts of each gene relative to the abundance of GAPDH transcripts was determined as described in Materials and Methods. Graphs show representative data from three independent experiments. (B) Cell surface CD36 expression was determined by flow cytometry in AMoL primary samples or U937 cells co-cultured with MSCs or MSC-derived BM adipocytes for 48 h. For U937 cells, graph shows the mean ± SD from three independent experiments. *p < 0.05. (C) Fatty acid uptake by U937 cells was evaluated under conditions of co-culture with or without BM adipocytes under serum-starved conditions for 16 h. Cells were plated at 50,000 cells / well, after which fatty acid mixture (dodecanoic acid fluorescent fatty acid substrate) was added and incubated for 1 h. Fluorescence signal was measured with a plate reader using bottom read mode. Graphs show the mean ± SD of the results from three independent experiments. **p < 0.01. (D) Expression levels of ATF4 protein in U937 cells after co-culture with BM adipocytes with or without etomoxir (EX) were detected by immunoblotting. α-tubulin was used as a loading control. The results shown are representative of three independent experiments. (E, F) Expression levels of HSP70, p38MAPK, p-p38MAPK, AMPK, p-AMPK, AKT, p-AKT, 4EBP1, p-4EBP1, and LC3 proteins in U937 cells after co-culture with BM adipocytes for 24 h with or without etomoxir (EX) were detected by immunoblotting; Cont, controls. Results shown are representative of three independent experiments. The intensity of the immunoblot signals compared to that of α-tubulin was quantified using Image J software. (G) Immunoblot analysis of total and phosphorylated AMPK in OCI-AML3 cells transfected with control short hairpin RNA (shRNA) or shRNA against AMPK, and effects of AMPK knockdown on cell survival under serum-starved conditions in the presence or absence of MSCs or MSC-derived BM adipocytes cultured 48 h. Percentages of cell death were determined by cell counts using the Trypan blue exclusion method. Graphs show the mean ± SD of the results from three independent experiments. *p < 0.05; **p < 0.01, shC; control shRNA, shAMPK; shRNA against AMPK. (H) Expression of ADIPOR1 mRNA in U937 cells co-cultured with MSCs or MSC-derived BM adipocytes for 24 h, with or without etomoxir (Ex) as indicated, shown by quantitative RT-PCR analysis. The abundance of transcripts of ADIPOR1 gene relative to the abundance of GAPDH transcripts was determined as described in Materials and Methods. Graphs show representative data from three independent experiments. (I) Expression of ADIPOQ mRNA in MSCs and MSC-derived BM adipocytes was analyzed by quantitative RT-PCR analysis. The abundance of transcripts of ADIPOQ gene relative to the abundance of GAPDH transcripts was determined. Graphs show representative data from three independent experiments. Culture supernatants were collected after 24 h incubation and analyzed for adiponectin concentration. Data sets are mean values ± SD of three independent experiments. *p < 0.05.
Figure 4
Figure 4. BM adipocytes support AMoL antiapoptosis via FAO stimulation, with activation of AMPK and HSP chaperone proteins and modulation of transcription factors in vitro
BM adipocytes induce upregulation of PPARγ, CD36, and FABP4 gene transcription, which stimulates fatty acid endocytosis. In mitochondria, fatty acids are consumed for FAO, which is accompanied by mitochondrial uncoupling, resulting in diminished formation of mitochondrial ROS and decrease of intracellular oxidative stress. The networks of transcriptional regulation and fatty acid metabolism support AMoL cells in a quiescent state associated with activation of AMPK, p38 with autophagy induction, upregulation of HSP antiapoptotic chaperone proteins and acquisition of chemotherapy resistance. FAO inhibition by etomoxir induces the integrated stress response, which stimulates transcriptional activation of ATF4, FABP4, fatty acid binding protein 4; AMPK, AMP-activated protein kinase; p38, p38 mitogen-activated protein kinase; ADIPOR1, adiponectin receptor 1; ATF4, activating transcription factor 4.

Similar articles

Cited by

References

    1. Hassan M, Abedi-Valugerdi M. Hematologic malignancies in elderly patients. Haematologica. 2014;99(7):1124–1127. - PMC - PubMed
    1. Vander Heiden MG, Cantley LC, Thompson CB. Understanding the Warburg effect: the metabolic requirements of cell proliferation. Science. 2009;324(5930):1029–1033. - PMC - PubMed
    1. Jones RG, Thompson CB. Tumor suppressors and cell metabolism: a recipe for cancer growth. Genes Dev. 2009;23(5):537–548. - PMC - PubMed
    1. Gut P, Verdin E. The nexus of chromatin regulation and intermediary metabolism. Nature. 2013;502(7472):489–498. - PubMed
    1. Zhao Y, Butler EB, Tan M. Targeting cellular metabolism to improve cancer therapeutics. Cell Death Dis. 2013;4:e532. - PMC - PubMed

MeSH terms

Substances