. 2017 Apr;23(4):586-599.
doi: 10.1261/rna.059568.116. Epub 2017 Jan 20.

RNA-binding specificity landscape of the pentatricopeptide repeat protein PPR10

Affiliations

RNA-binding specificity landscape of the pentatricopeptide repeat protein PPR10

Rafael G Miranda et al. RNA. 2017 Apr.

Abstract

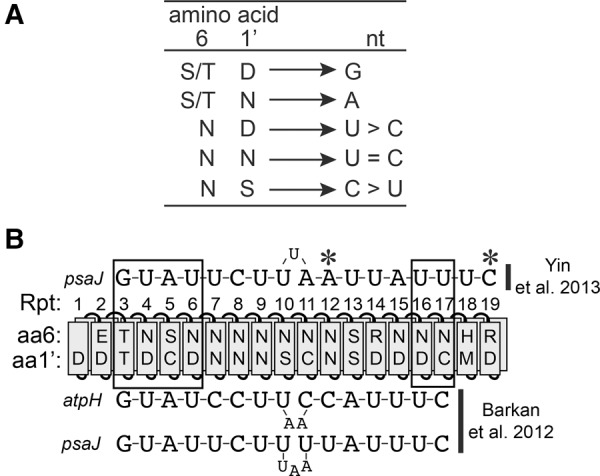
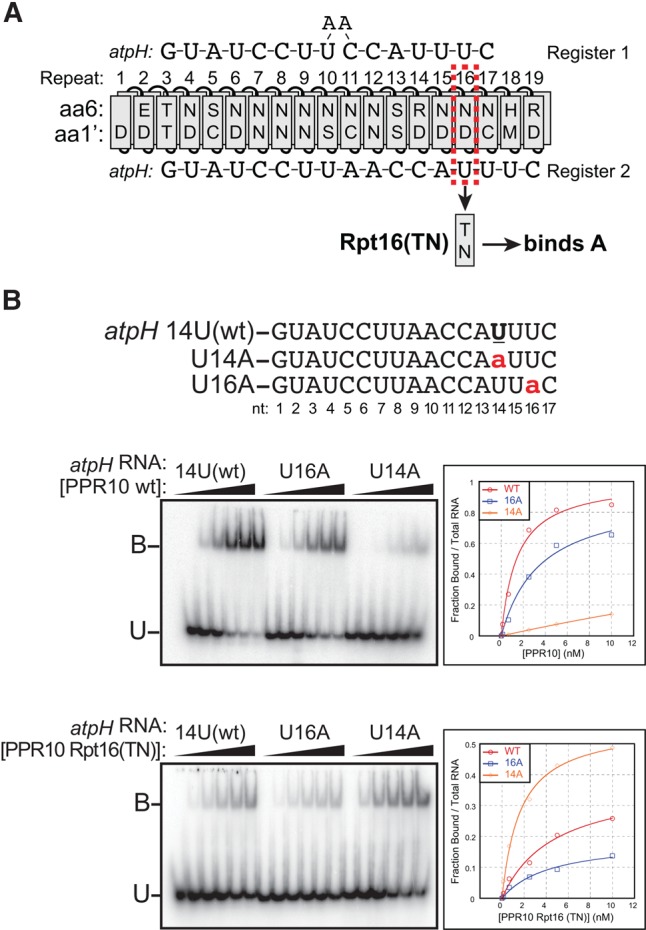
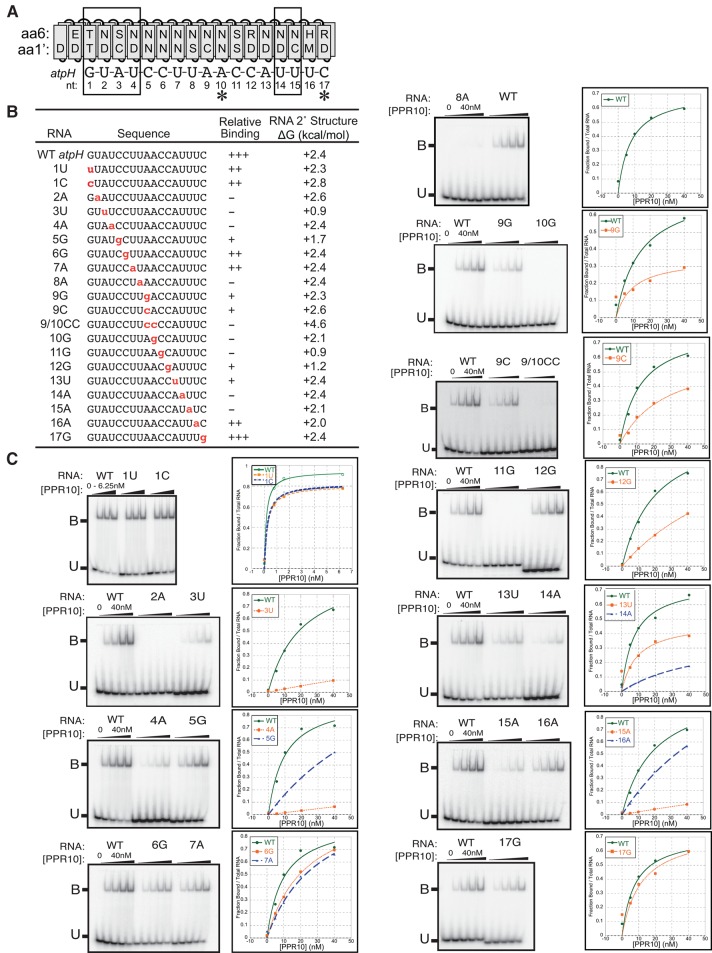
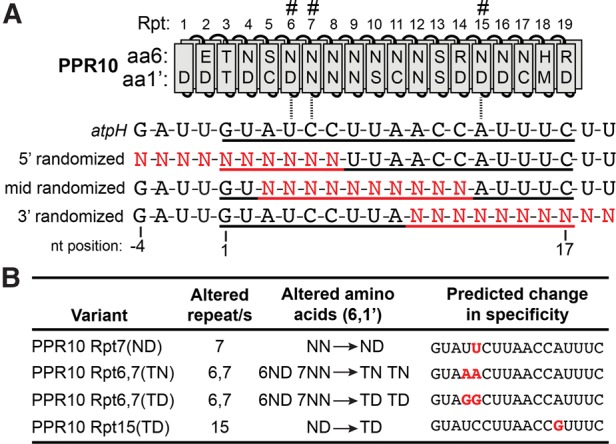
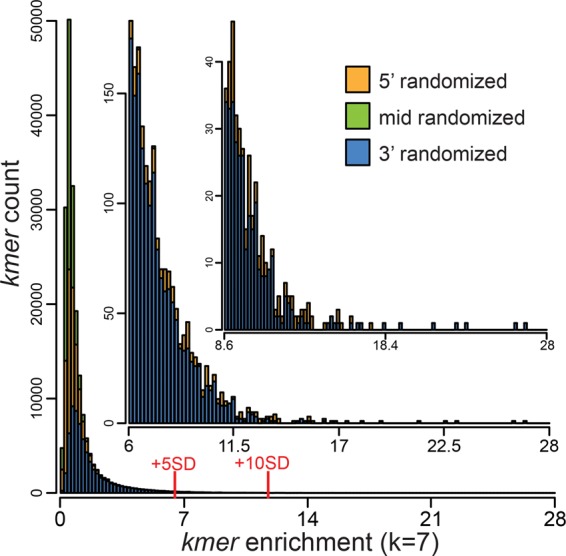
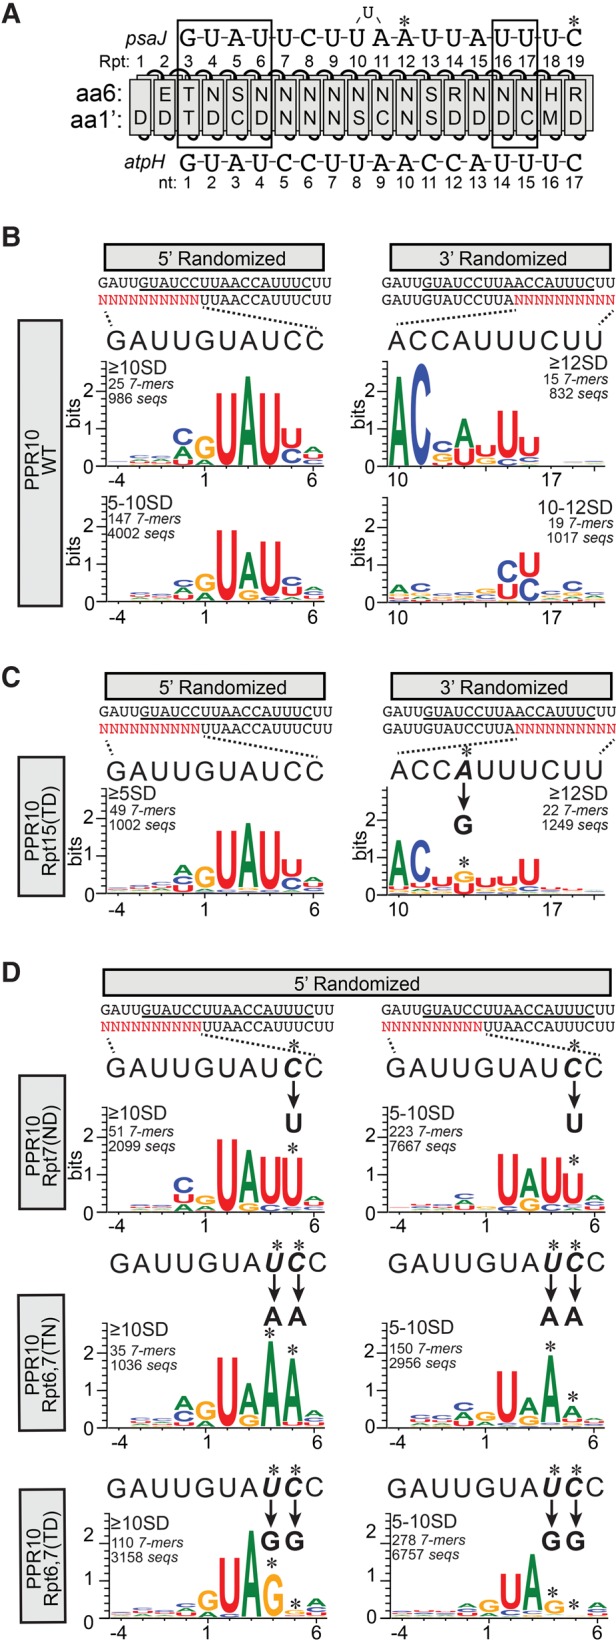
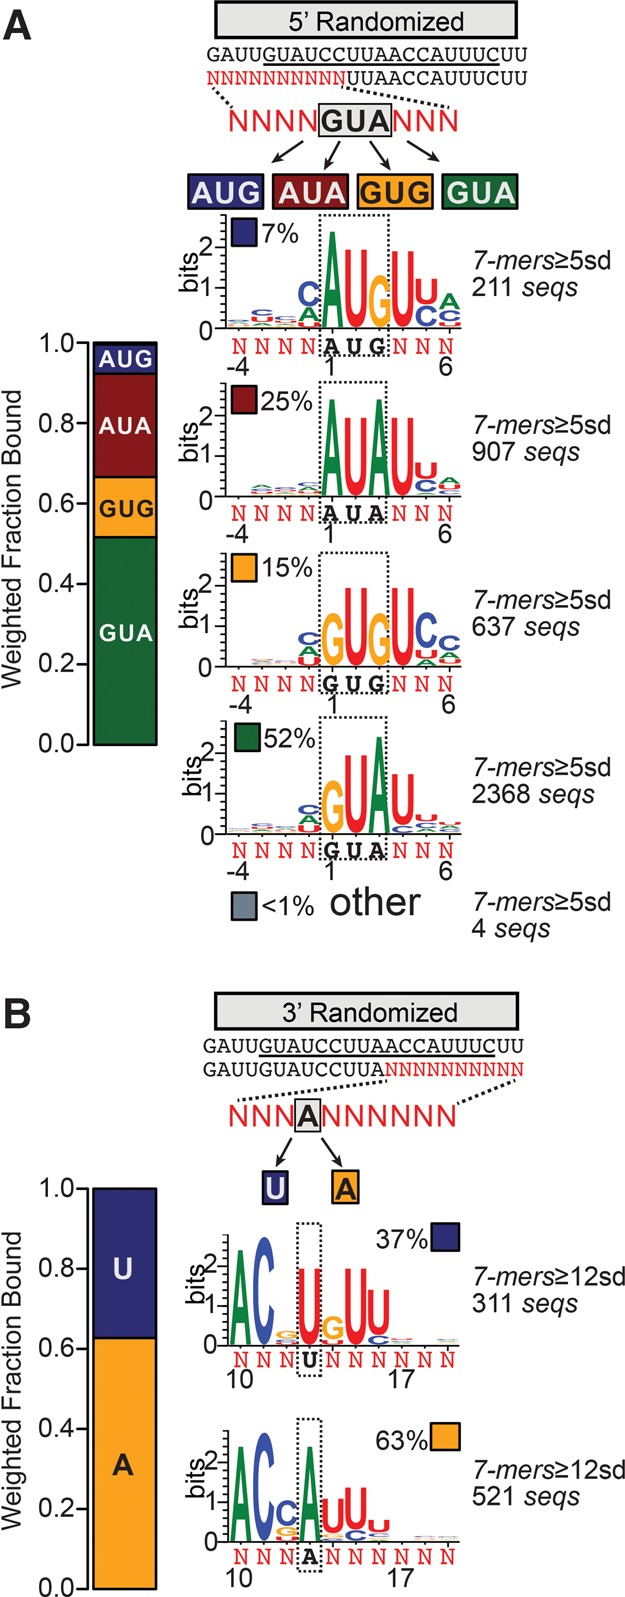
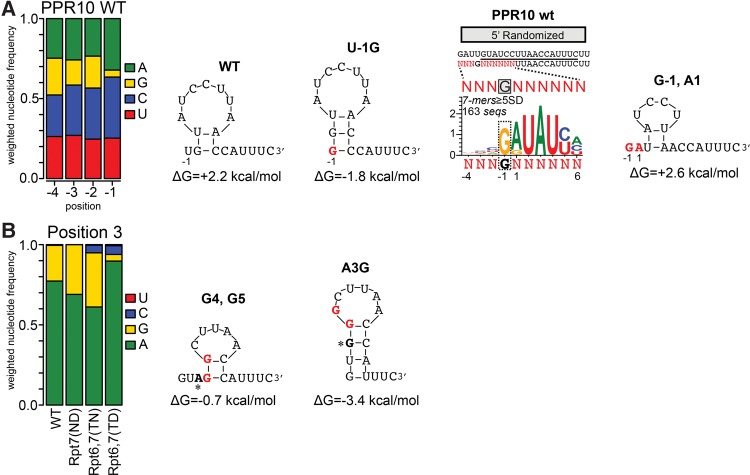
Pentatricopeptide repeat (PPR) proteins comprise a large family of helical repeat proteins that influence gene expression in mitochondria and chloroplasts. PPR tracts can bind RNA via a modular one repeat-one nucleotide mechanism in which the nucleotide is specified by the identities of several amino acids in each repeat. This mode of recognition, the so-called PPR code, offers opportunities for the prediction of native PPR binding sites and the design of proteins to bind specified RNAs. However, a deep understanding of the parameters that dictate the affinity and specificity of PPR-RNA interactions is necessary to realize these goals. We report a comprehensive analysis of the sequence specificity of PPR10, a protein that binds similar RNA sequences of ∼18 nucleotides (nt) near the chloroplast atpH and psaJ genes in maize. We assessed the contribution of each nucleotide in the atpH binding site to PPR10 affinity in vitro by analyzing the effects of single-nucleotide changes at each position. In a complementary approach, the RNAs bound by PPR10 from partially randomized RNA pools were analyzed by deep sequencing. The results revealed three patches in which nucleotide identity has a major impact on binding affinity. These include 5 nt for which protein contacts were not observed in a PPR10-RNA crystal structure and 4 nt that are not explained by current views of the PPR code. These findings highlight aspects of PPR-RNA interactions that pose challenges for binding site prediction and design.

Keywords: RNA-binding protein; bind-n-seq; chloroplast; helical repeat protein.


Figures

FIGURE 1.
FIGURE 1.
Overview of PPR10–RNA interactions and the PPR code. (A) The PPR code. The nucleotide preference of canonical PPR motifs is determined by the combination of amino acids at positions 6 and 1′ (the first amino acid in the next repeat). These correspond to amino acids 5 and 35 according to the nomenclature of Yin et al. (2013). Only experimentally validated amino acid codes are shown. The specificities of TD, TN, ND, NN, and NS were demonstrated in Barkan et al. (2012). The specificities of SN and SD were demonstrated in Shen et al. (2016). (B) Diagram of PPR10 aligned to its native atpH and psaJ binding sites. PPR motifs are indicated by rectangles representing helix A (front) and helix B (behind). The identities of the specificity-determining amino acids (aa6 and 1′) are indicated (Barkan et al. 2012). The alignment above is extrapolated from the PPR10–psaJ RNA crystal structure (Yin et al. 2013), whereas the alignment below maximizes the number of matches predicted by the canonical PPR code (Barkan et al. 2012). Boxes indicate modular PPR–nucleotide contacts, and asterisks mark nucleotides involved in noncanonical contacts in the PPR10–psaJ crystal structure (Yin et al. 2013).
FIGURE 2.
FIGURE 2.
Compensatory mutation experiment to establish the register between the C terminus of PPR10 and the 3′-region of the atpH binding site. (A) Diagram of PPR10 aligned in two proposed registers to the atpH binding site. Register 1 was proposed in Barkan et al. (2012) and Register 2 was proposed in Yin et al. (2013). To distinguish between the registers, the nucleotide specifying amino acids in Repeat 16 were changed from 6N,1′D to 6T,1′N, which is predicted to change the bound nucleotide from U to A. (B) Gel mobility shift assays showing that PPR10 variant Rpt16(TN) binds preferentially to the U14A substituted atpH binding site, supporting Register 2. This assay was repeated three times with similar results. A representative experiment is shown.
FIGURE 3.
FIGURE 3.
Effects of single-nucleotide changes in the atpH site on PPR10 binding affinity. (A) Alignment between PPR10 and the atpH binding site. Boxes mark the modular PPR–nucleotide contacts detected in the PPR10–psaJ crystal structure (Yin et al. 2013) and asterisks mark nucleotides that make nonmodular protein contacts in that structure. (B) RNAs used for gel mobility shift assays. Nucleotide substitutions are marked in red. Relative binding affinities were approximated based on the data shown in panel C; mutant RNAs were placed into relative affinity bins by comparing their binding behavior to that of the wild-type RNA when assayed with the identical protein dilutions on the same gel. The thermodynamic stability of RNA secondary structure predicted for each sequence (Mfold prediction [Zuker 2003], 37°C, default parameters) is shown to the right. (C) Gel mobility shift assays. PPR10 was used at the concentrations indicated in the graphs. All assays used the same preparation of PPR10 except the assays with 1U and 1C RNAs. Each assay was repeated either two or three times, with similar results. A representative assay is shown in each case.
FIGURE 4.
FIGURE 4.
Design of bind-n-seq experiments. (A) RNA pools used for bind-n-seq assays. PPR10 is aligned to the sequence of its in vivo footprint in the atpH 5′UTR, with its minimal binding site underlined (Prikryl et al. 2011). The PPR motifs that were modified in the variants used for the bind-n-seq experiments are marked with hashmarks. The three pools of synthetic oligoribonucleotides diagrammed below were combined in equimolar amounts for use in the binding reactions. The nucleotide positions are numbered based on position in the minimal binding site. (B) PPR10 variants used in bind-n-seq assays. The Rpt7(ND), Rpt6,7(TN), and Rpt 6,7(TD) variants were shown previously to exhibit the predicted changes in sequence specificity in gel mobility shift assays (Barkan et al. 2012). PPR10 Rpt15(TD) had not been studied previously; its predicted specificity is inferred from the specificity of the 6T,1′D code in other contexts (see Fig. 1A).
FIGURE 5.
FIGURE 5.
Frequency distribution of 7-mer enrichment values in the PPR10 bind-n-seq experiment. Enrichment values were calculated for each 7-mer at each position as the frequency of that 7-mer in the bound fraction divided by its frequency at the same position in the input library. The graph shows the number of different 7-mers (y-axis) at each enrichment value (x-axis). 7-mers from the 5′-, 3′-, and middle-randomized pools are colored in orange, blue, and green, respectively. Insets show expansions of the data in the tail of the distribution. The subsets of 7-mers that were enriched more than 5 or 10 standard deviations above the mean are marked. Analogous plots for the PPR10 variants that were analyzed by bind-n-seq are shown in Supplemental Figure S2. The frequency distribution of 7-mers in the input pool is plotted in Supplemental Figure S1C.
FIGURE 6.
FIGURE 6.
Sequence logos representing sequences harboring 7-mers that were enriched in PPR10 bind-n-seq assays. (A) Diagram of PPR10 aligned with its native atpH and psaJ binding sites. The protein and RNAs are annotated as in Figure 1. (B) Sequence logos representing data from the bind-n-seq assay with wild-type PPR10. Analyses of data from the 5′ and 3′ randomized pools are shown on the left and right, respectively. The oligonucleotide with the randomized region (in red) is displayed beneath the sequence of PPR10's footprint (minimal PPR10 binding site underlined). The wild-type sequence corresponding to each randomized region is expanded above the logos to facilitate comparisons. Position 1 is defined as the start of the minimal atpH binding site based on the register imposed by the constant region of each oligonucleotide. The enrichment cutoffs of the 7-mers used to generate each logo (in standard deviations above the mean), the number of different 7-mers in that subset, and the number of different sequences in that subset are indicated. (C) Sequence logos representing data from PPR10 variant Rpt15(TD). Logos are annotated as described in panel B. The change in sequence specificity predicted by the PPR code for the Rpt15(TD) variant is indicated, and the corresponding position in the logo is marked with an asterisk. (D) Sequence logos representing data from PPR10 variants Rpt7(ND), Rpt6,7(TN), and Rpt6,7(TD). Logos are shown only for data from the 5′ randomized oligonucleotide, which is the region expected to interact with the modified repeats. No substantive differences from the wild-type were observed in the sequences selected from the 3′ region. Logos are annotated as in panel B.
FIGURE 7.
FIGURE 7.
Parsing motifs that contribute to PPR10 bind-n-seq sequence logos. (A) Logos resulting from parsing sequences containing enriched 7-mers (≥5 SD above the mean) from the 5′-randomized pool based on nucleotide identity at positions 1 and 3. Fixed nucleotides (boxed black text) are shown below each logo. The bar plot to the left indicates the fractional contribution of sequences harboring each motif to the sequence set. (B) Logos resulting from parsing sequences containing enriched 7-mers (≥12 SD above the mean) from the 3′-randomized pool based on nucleotide identity at position 13. Fixed nucleotides and their fractional representation are indicated as in panel A.
FIGURE 8.
FIGURE 8.
Sequence covariations in the bind-n-seq data illustrate the inhibition of PPR10 binding by RNA secondary structure. RNA structures were predicted by M-fold (Zuker 2003). (A) Basis for selection against G at position −1. The bar graph shows the representation of each nucleotide at each indicated position in sequences harboring 7-mers that were enriched in the WT PPR10 assay (≥5 SD above the mean). Frequencies are weighted by the enrichment value of the corresponding sequence. The subset of these sequences harboring G at position −1 was used to generate the sequence logo to the right. The impact of various nucleotide identities at positions 1 and −1 on RNA structure are diagrammed, with nucleotides that differ from the WT site highlighted in red. (B) Basis for selection against G at position 3 by PPR10 variant Rpt6,7(TD). The bar graph shows the representation of each nucleotide at position 3 among sequences harboring enriched 7-mers (≥5 SD above the mean) in bind-n-seq assays with the indicated proteins. The structures predicted for the preferred Rpt6,7(TD) binding site and for the A3G substituted site are diagrammed, with nucleotides that differ from the WT sequence highlighted in red and position 3 indicated by an asterisk.
FIGURE 9.
FIGURE 9.
Summary of PPR10's nucleotide preferences within the atpH binding site. Every nucleotide was queried by both gel mobility shift and bind-n-seq with the exception of nucleotides 7, 8, and 9, for which bind-n-seq data are not available. The protein–RNA contacts observed in a PPR10–psaJ crystal structure (Yin et al. 2013) are illustrated to the left, with modular contacts in dashed boxes and nucleotides that make nonmodular contacts marked with asterisks. Modular interactions that can be inferred from data presented here are marked with boxes to the right. Nucleotide positions in the atpH sequence are shaded to reflect the degree to which PPR10 binding is affected by the nucleotide identity at that position. Darker shading indicates increased nucleotide selectivity.

Similar articles

Cited by

References

    1. Abil Z, Zhao H. 2015. Engineering reprogrammable RNA-binding proteins for study and manipulation of the transcriptome. Mol Biosyst 11: 2658–2665. - PubMed
    1. Ban T, Zhu JK, Melcher K, Xu HE. 2015. Structural mechanisms of RNA recognition: sequence-specific and non-specific RNA-binding proteins and the Cas9-RNA-DNA complex. Cell Mol Life Sci 72: 1045–1058. - PMC - PubMed
    1. Barkan A, Small I. 2014. Pentatricopeptide repeat proteins in plants. Annu Rev Plant Biol 65: 415–442. - PubMed
    1. Barkan A, Rojas M, Fujii S, Yap A, Chong YS, Bond CS, Small I. 2012. A combinatorial amino acid code for RNA recognition by pentatricopeptide repeat proteins. PLoS Genet 8: e1002910. - PMC - PubMed
    1. Campbell ZT, Wickens M. 2015. Probing RNA-protein networks: biochemistry meets genomics. Trends Biochem Sci 40: 157–164. - PMC - PubMed

MeSH terms