. 2016 Dec 1;45(6):1866-1886.
doi: 10.1093/ije/dyw314.

Triangulation in aetiological epidemiology

Affiliations

Triangulation in aetiological epidemiology

Debbie A Lawlor et al. Int J Epidemiol. .

Abstract

Triangulation is the practice of obtaining more reliable answers to research questions through integrating results from several different approaches, where each approach has different key sources of potential bias that are unrelated to each other. With respect to causal questions in aetiological epidemiology, if the results of different approaches all point to the same conclusion, this strengthens confidence in the finding. This is particularly the case when the key sources of bias of some of the approaches would predict that findings would point in opposite directions if they were due to such biases. Where there are inconsistencies, understanding the key sources of bias of each approach can help to identify what further research is required to address the causal question. The aim of this paper is to illustrate how triangulation might be used to improve causal inference in aetiological epidemiology. We propose a minimum set of criteria for use in triangulation in aetiological epidemiology, summarize the key sources of bias of several approaches and describe how these might be integrated within a triangulation framework. We emphasize the importance of being explicit about the expected direction of bias within each approach, whenever this is possible, and seeking to identify approaches that would be expected to bias the true causal effect in different directions. We also note the importance, when comparing results, of taking account of differences in the duration and timing of exposures. We provide three examples to illustrate these points.

Keywords: Aetiological epidemiology; Mendelian randomization; RCTs; causality; instrumental variables; natural experiments; negative control studies; triangulation; within-sibships studies.


Figures

Figure 1.
Figure 1.
Illustrative example of instrumental variable analyses in RCTs and Mendelian randomization studies to answer aetiological questions of the effect of a risk factor (LDLc) on an outcome (CHD). The figure shows directed acyclic graphs (DAGs) of instrumental variable (IV) analyses to test the causal effect of low-density lipoprotein cholesterol (LDLc) on coronary heart disease (CHD). In a and b, the IV is randomization to receiving a statin or not (i.e. this is an example of IV analyses to test an intermediate in an RCT); statins are 3-hydroxy-3-methylglutaryl-coenzyme (HMG-CoA) reductase inhibitors. In (c) and (d), the IV is genetic variants in the HMGCR gene (i.e. this is an MR study); these variants mimic HMG-CoA reductase inhibition. In (e) and (f) the IV is genetic variants (MR) that are independent of those in the HMGCR genes. The three key assumptions of IV analyses are illustrated in (a), (c) and (e), that the: (i) IV ‘Z’ (randomization to statins in a and genetic variants related to LDLc in (c) and (e) is (or is plausibly) robustly related to the risk factor (LDLc in all figures); (ii) IV is not related to confounders (shown by letter C in all figures) for the risk factor-outcome association (shown by the lack of an arrow from C to Z in all figures); (iii) IV only affects the outcome ‘Y’ (CHD) through its effect on the risk factor ‘X’ (LDLc). This last assumption is known as the exclusion restriction criteria. In the RCT of statins example, we know that assumption (i) is true, and if the RCT is well conducted then assumption (ii) will be true. If, however, statins are directly (independently of LDLc) related to other factors which then affect CHD, assumption (iii) will be violated and the estimated causal effect a biased estimate of the true effect of LDLc. There is some evidence that statins do relate to a wide range of other lipids and fatty acids in addition to LDLc, though whether these are caused by the statins independent of LDLc and affect CHD is currently unknown. If they do (as shown as an illustrative example in (b) then the estimate of the LDLc effect on CHD is likely to be biased (what is assumed to be the effect of LDLc on CHD will be the combined effect of LDLc and other lipids/fatty acids on CHD). In the MR example of variants in the HMGCR gene, we know that assumption (i) is correct and there is evidence that assumption (ii) is also this is likely to be true. As with the RCT example, in MR we are often most worried about violation of assumption (iii), due to genuine (horizontal) pleiotropy in MR–i.e. that variants in HMGCR influence other factors independently of LDLc which in turn (independently of LDLc) affect CHD (d). As these variants are mimicking the action of statins, then any pleiotropy is likely to be similar to that seen for statins (d). By contrast, (e) and (f) show the use of genetic variants that are unrelated to HMGCR. Although there may still be violation of the exclusion restriction criteria (due to genuine pleiotropy) with these variants, it is unlikely to be related to violation of the exclusion restriction criteria in an RCT of statins because the variants have been selected on the basis that their actions are on a different path from those of statins.
Figure 2.
Figure 2.
Triangulation of effect of systolic blood pressure on CHD risk from three approaches (RCT, multivariable regression and MR). Both graphs show the effect of exposure to 10 mmHg lower systolic blood pressure (SBP) on risk of coronary heart disease (CHD). In (a), squares represent the effect estimate for the association between 10 mmHg lower systolic blood pressure (SBP) and the risk of CHD; horizontal lines represent 95% confidence intervals (CI). The relative risk ratios (RRR) and their 95% CI are given for each approach on the righthand side of the graph. The P-values to the right of the RRR values (P diff) are testing the null hypothesis that results from the different approaches and are consistent with results from the first MR study (reference study). In (b), squares represent the proportional risk reduction (1−risk ratio) of CHD per 10 mmHg lower SBP plotted against the estimated mean length of exposure to 10 mmHg lower SBP; vertical lines represent 1 standard error (SE) above and below the point estimate of proportional risk reduction. Results are plotted against the estimated duration of exposure to lower SBP for each approach. Reproduced from reference 53 with permission.
Figure 3.
Figure 3.
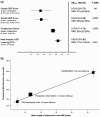
Results for triangulation across different approaches to determine the effect of maternal circulating pregnancy glucose on birthweight. a: Difference in mean birthweight (g) per 1 mmol/l greater fasting glucose. b: Difference in mean birthweight (g) per 1 mmol/l greater fasting glucose against the cumulative number of weeks of exposure (in completed gestational weeks) to 1 mmol/l greater fasting glucose. In (a), the effects are shown of 1 mmol/l maternal gestational fasting glucose on difference in mean birthweight in grams (g) from different approaches. MV, multivariable regression in prospective pregnancy cohorts; Euro, European-origin mother-offspring pairs; W Brit, White British mother-offspring pairs; minimal adjust, adjusted for infant sex and gestational age only; full adjust, fuller adjustment with additional adjustment for maternal age, BMI, parity, education and receipt of income support. In (b), the estimates are shown of the fuller adjusted MV analyses in White British (WB) and Pakistani (P) mother-offspring pairs, together with the IV analyses in the RCT and MR approaches, plotted against estimated length of cumulative exposure to fasting glucose for each approach in completed gestational weeks. The mean length of exposure in the MV of White British and Pakistani pairs is the same (13 weeks), but in order to visualize both they have been separated to 12.5 and 13.5 weeks. The regression line is forced through zero and shows that the RCT result appears to be an outlier (exaggerating the effect of glucose on birthweight).

References

    1. Hernan MA, Alonso A, Logan R. et al. Observational studies analyzed like randomized experiments: an application to postmenopausal hormone therapy and coronary heart disease. Epidemiology 2008;19:766–79. - PMC - PubMed
    1. Vanderweele TJ. Explanation in Causal Inference. New York, NY: Oxford University Press, 2015.
    1. Pearce N, Vandenbroucke JP.. Causation, Mediation and Explanation Essay review of: VanderWeele TJ ‘Explanation in causal inference’. New York, NY: Oxford University Press, 2015. Int J Epidemiol 2016;45:1895–903. - PMC - PubMed
    1. Vandenbroucke JP, Broadbent A, Pearce N.. Causality and causal inference in epidemiology: the need for a pluralistic approach. Int J Epidemiol 2016;45:1776–86. - PMC - PubMed
    1. Daniel RM, De Stavola BL, Vansteelandt S.. The formal approach to quantitative causal inference in epidemiology: misguided or misrepresented? Int J Epidemiol 2016;45:1817–29. - PMC - PubMed

Publication types