. 2017 Feb;66(2):392-406.
doi: 10.2337/db16-0500. Epub 2016 Nov 8.

Macrophage Proliferation Sustains Adipose Tissue Inflammation in Formerly Obese Mice

Affiliations

Macrophage Proliferation Sustains Adipose Tissue Inflammation in Formerly Obese Mice

Brian F Zamarron et al. Diabetes. 2017 Feb.

Abstract

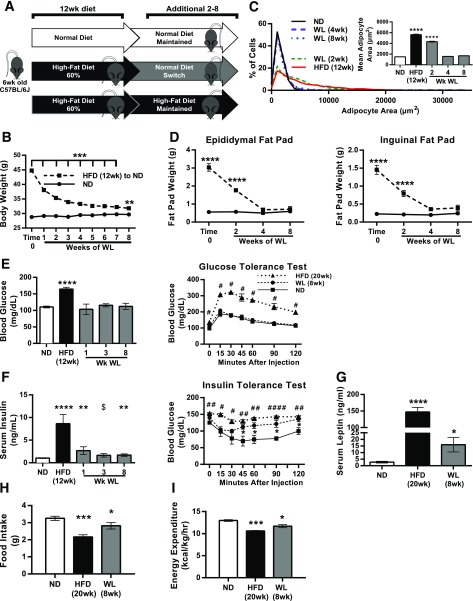
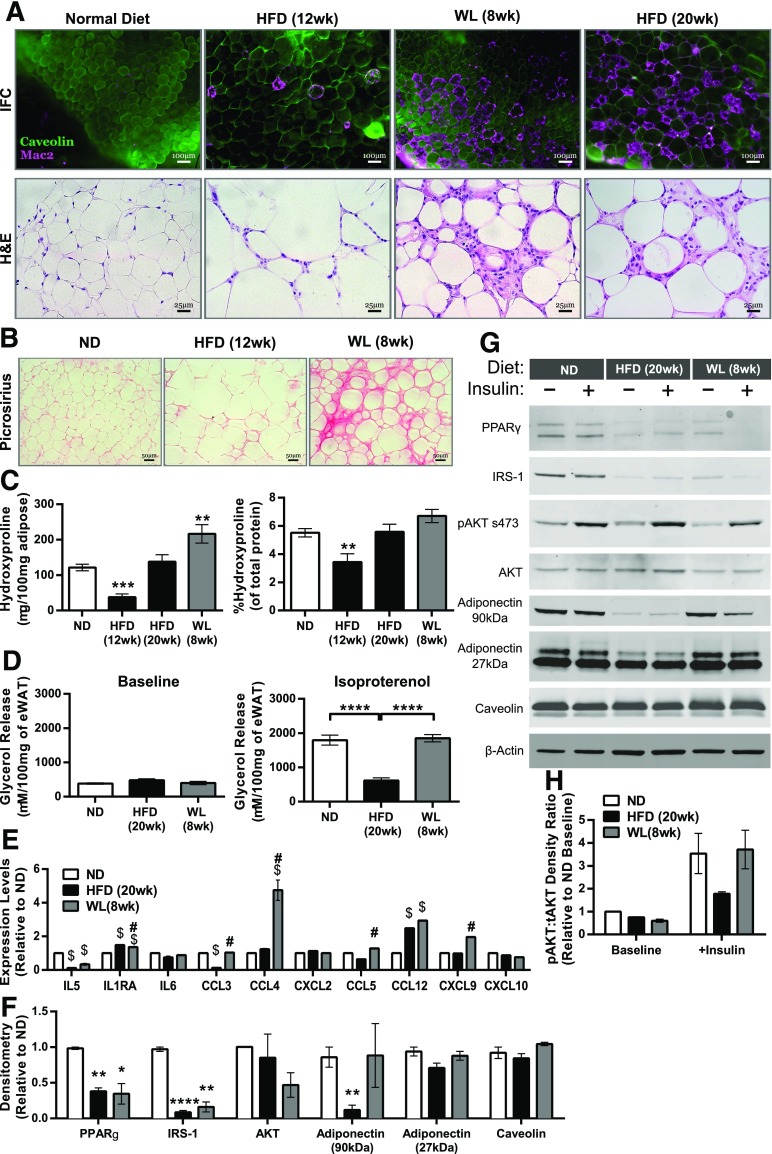
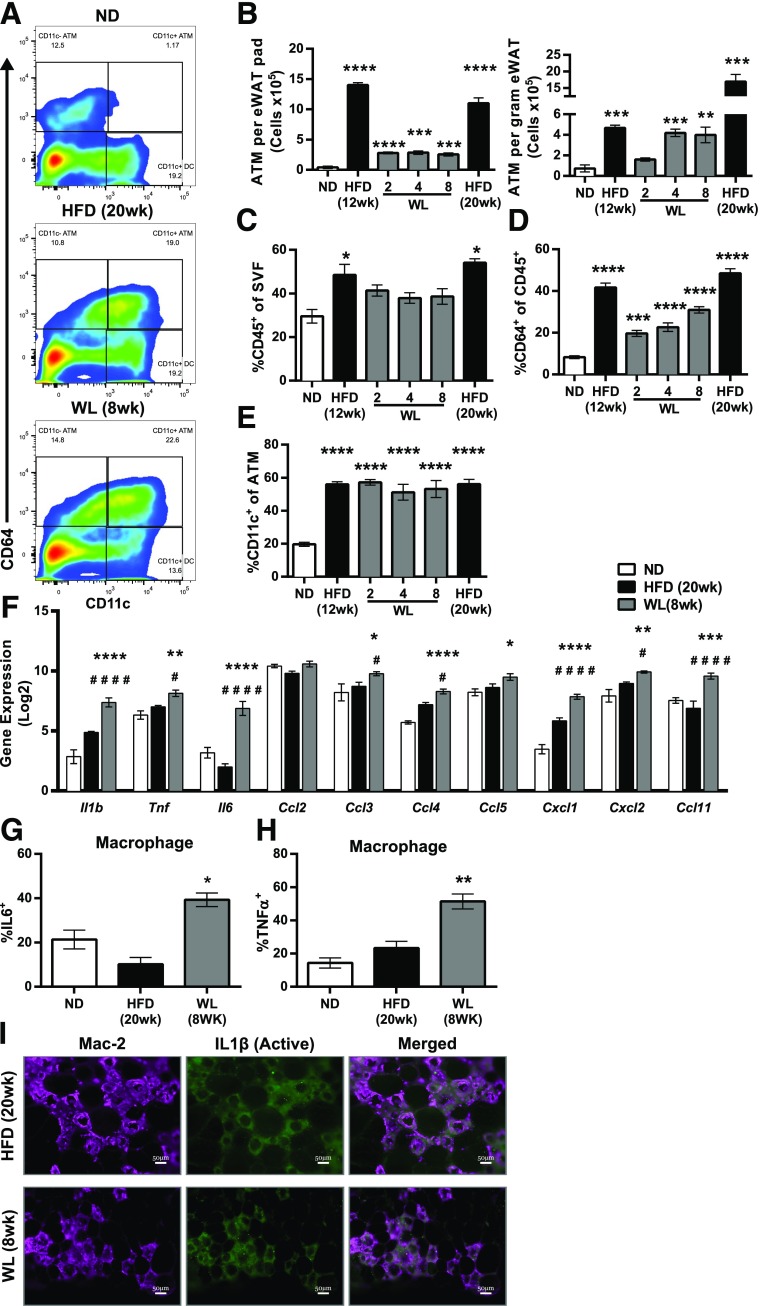
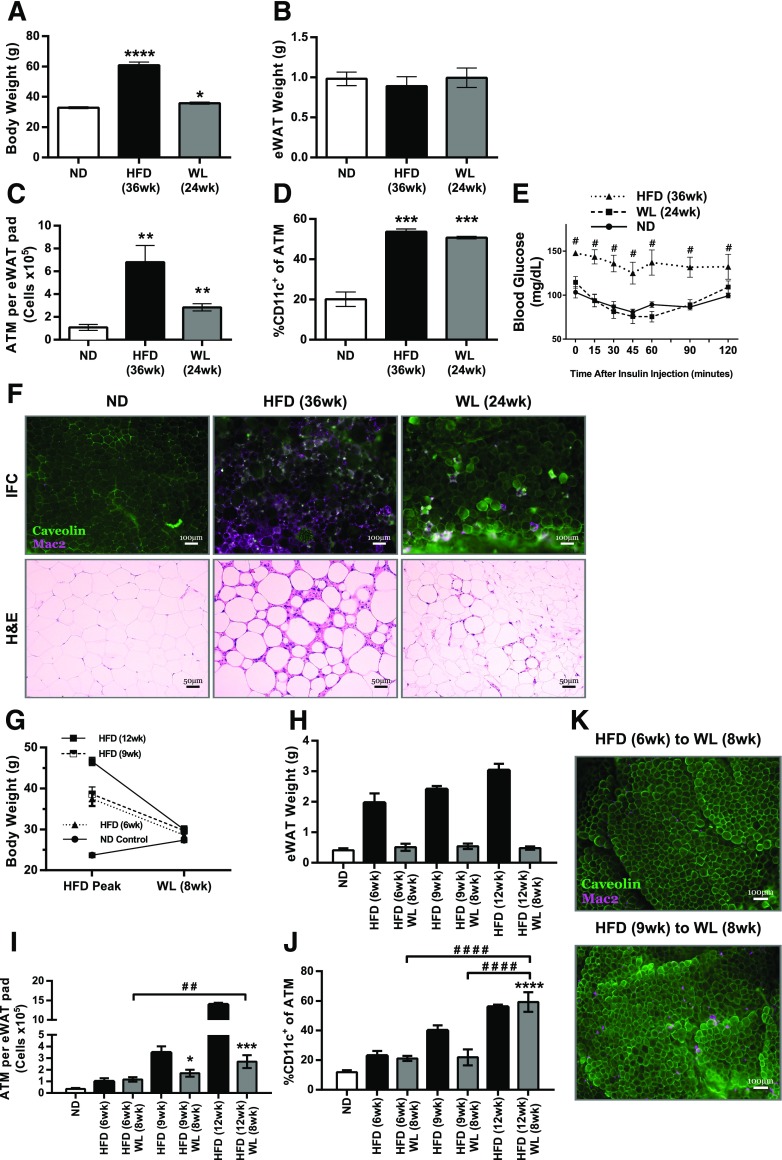
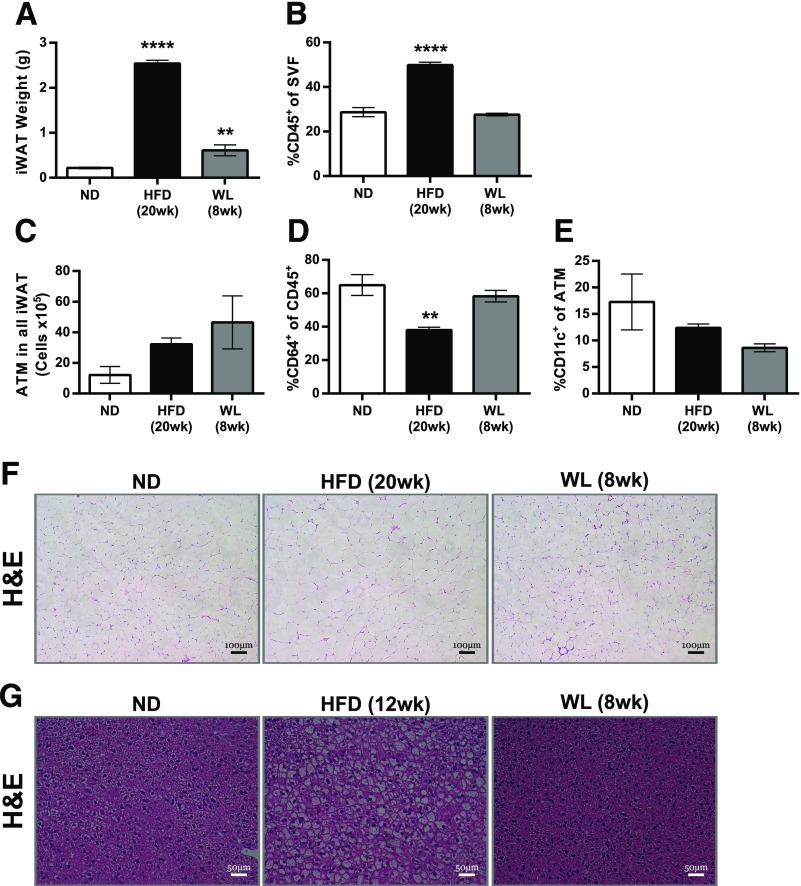
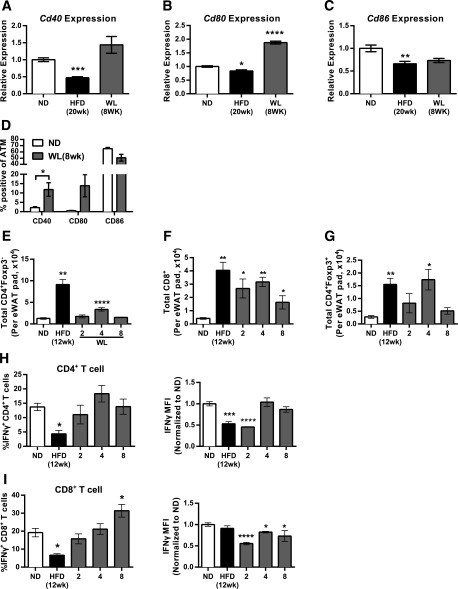
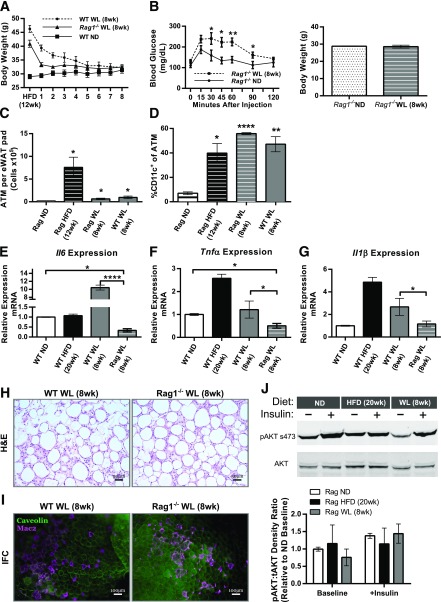
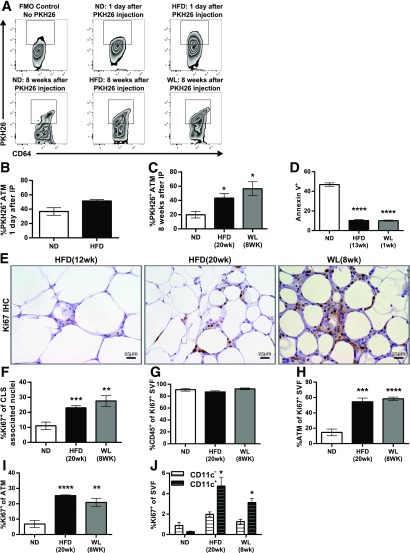
Obesity causes dramatic proinflammatory changes in the adipose tissue immune environment, but relatively little is known regarding how this inflammation responds to weight loss (WL). To understand the mechanisms by which meta-inflammation resolves during WL, we examined adipose tissue leukocytes in mice after withdrawal of a high-fat diet. After 8 weeks of WL, mice achieved similar weights and glucose tolerance values as age-matched lean controls but showed abnormal insulin tolerance. Despite fat mass normalization, total and CD11c+ adipose tissue macrophage (ATM) content remained elevated in WL mice for up to 6 months and was associated with persistent fibrosis in adipose tissue. ATMs in formerly obese mice demonstrated a proinflammatory profile, including elevated expression of interferon-γ, tumor necrosis factor-α, and interleukin-1β. T-cell-deficient Rag1-/- mice showed a degree of ATM persistence similar to that in WT mice, but with reduced inflammatory gene expression. ATM proliferation was identified as the predominant mechanism by which ATMs are retained in adipose tissue with WL. Our study suggests that WL does not completely resolve obesity-induced ATM activation, which may contribute to the persistent adipose tissue damage and reduced insulin sensitivity observed in formerly obese mice.


Figures

Figure 1
Figure 1
Glucose tolerance normalization but persistently elevated insulin with WL. A: Illustration showing obesity induction and the WL model. B: Body weight curve after WL (ND-fed mice, n ≥ 12; mice with WL, n ≥ 16). C: Adipocyte size distribution and average adipocyte size. D: Fat pad weight curve after WL (n = 4). E: Fasted blood glucose and glucose tolerance after WL (n ≥ 4). #HFD vs. ND. F: Fasted serum insulin (n ≥ 4) and insulin tolerance after WL (n = 4). #HFD vs. ND; $WL vs. ND. G: Fasted serum leptin concentrations (n = 8). H and I: Food intake measures (H) and energy expenditure (I) (n = 4). *P < 0.05, ## or **P < 0.01, ***P < 0.001, #### or ****P < 0.0001; significance compares with the ND-fed control group unless otherwise indicated.
Figure 2
Figure 2
Epididymal AT maintains features associated with obesity despite WL. A: Immunofluorescence (IFC) and H-E–stained eWAT slides representing each diet condition, showing the development and maintenance of CLSs. B: Picrosirius red staining of eWAT slides representing diet conditions. C: Hydroxyproline quantification of eWAT (n ≥ 4). D: Isoproterenol-stimulated glycerol release from whole eWAT explants (n = 8). E: eWAT explant multiplex cytokine array (n = 2 per condition). $P < 0.05 vs. ND; #P < 0.05 vs. HFD. F: Quantification of densitometry measurements from immunoblots of whole eWAT (ND, n = 2; HFD, n = 4; WL, n = 4; ANOVA with Dunnett multiple comparisons). G: Representative immunoblots from mice injected i.p. with or without 1 U/kg insulin for 10 min, with two mice pooled per lane. H: Phosphorylated AKT s473 relative to total AKT (tAKT) from immunoblots (n = 2 for baseline; n = 3 for insulin administered). *P < 0.05; **P < 0.01; ***P < 0.001; ****P < 0.0001. Significance compares with the ND-fed control group unless otherwise indicated.
Figure 3
Figure 3
Maintenance of inflammatory CD11c+ ATMs despite WL. A: Representative flow plots showing our macrophage (CD45+CD64+) and dendritic cell (CD45+CD64CD11c+) gating strategy. B: Total ATM content per eWAT pad (left) and ATM content per gram of eWAT (right) (n = 4). C: Frequency of CD45+ immune cells among all eWAT SVFs (n ≥ 4). D: Frequency of CD64+ ATMs among all CD45+ SVFs (n ≥ 4). E: Frequency of CD11c+ ATMs among all CD45+CD64+ ATMs (n ≥ 4). F: Expression of select immune genes from microarrays of flow-sorted ATMs (two-way ANOVA with Dunnett multiple comparisons, α = 0.05). #Significance compared with the WL to HFD groups. G and H: Intracellular cytokine staining of unstimulated SVF showing IL-6 protein expression (G) and TNF-α protein expression (H) from eWAT ATMs (n = 4). I: Immunofluorescence from eWAT showing cleaved IL-1β deposition surrounding CLSs in mice during obesity and after WL. Scale bars: 50 μm. B–E, G, and H, significance compared with the ND-fed control group. # or *P < 0.05; **P < 0.01; ***P < 0.001; #### or ****P < 0.0001. *Significance compares with ND; #significance compares with HFD.
Figure 4
Figure 4
Obesity-induced effects can persist in AT as long as 6 months after removing the HFD. Body weight (A) and eWAT weight (B) of mice after 24 weeks of WL, along with those of respective controls (n = 4). C: Total CD45+CD64+ ATM content per eWAT pad for mice with 6 months of WL (n = 4 for all diet conditions). D: Frequency of CD11c+ ATMs among all CD45+CD64+ ATMs (n = 4). E: GTT results (n = 4). #P < 0.05; significance compares HFD with ND. F: Immunofluorescence (IFC) and H-E stained slides representing each diet condition, showing CLS development and maintenance. G and H: Body weight (G) and eWAT weight (H) after WL among mice in the 6-, 9-, or 12-week HFD feeding groups (n = 4 for all diet conditions). I: Total CD45+CD64+ ATM content per eWAT pad for mice fed the HFD for a short time (n = 4). J: Frequency of CD11c+ ATMs among all CD45+CD64+ ATMs (n = 4 for all diet conditions). HJ: ANOVA with Tukey multiple comparisons (α = 0.05) was used to compare WL averages to each other and to the ND-fed group. HFD points were not included in the analyses. K: Representative IFC images from eWAT showing macrophage accumulation. *P < 0.05; ## or **P < 0.01; ***P < 0.001; #### or ****P < 0.0001. *Significance compares with ND; #significance between weight loss time points.
Figure 5
Figure 5
Inguinal AT and liver changes with WL. A: iWAT weights. B: Frequency of CD45+ leukocytes among the total iWAT SVFs. C: Total CD45+CD64+ ATMs in iWAT. D: Frequency of ATMs among all CD45+ iWAT SVF leukocytes. E: Frequency of CD11c+ cells among all ATMs. n = 4 for A–E. F and G: H-E–stained iWAT (F) and (G) liver slides. **P < 0.01 and ****P < 0.0001. Significance compares with the ND-fed control group.
Figure 6
Figure 6
AT T-cell activation with WL. Quantitative RT-PCR from flow-sorted ATMs of mice evaluating Cd40 (A), Cd80 (B), and Cd86 (C) gene expression (ATMs pooled from a total of 12 mice from the ND and HFD groups and 6 mice from the WL group; ND n = 4, HFD n = 4, WL n = 2). D: Surface marker expression of Cd40, Cd80, and Cd86 evaluated by flow cytometry (n = 4). Total AT T-cell count per eWAT pad evaluated by flow cytometry for conventional CD4+ T cells (E), CD8+ T cells (F), and Foxp3+CD4+ T-regulatory cells (G) (n ≥ 4 for EG). H and I: Intracellular cytokine stain on phorbol myristic acetate/ionomycin stimulated the SVF to allow evaluation of IFN-γ production potential from CD4+ T cells (H) and CD8+ T cells (I). *P < 0.05; **P < 0.01; ***P < 0.001; ****P < 0.0001. Significance compares with the ND-fed control group. MFI, median fluorescence intensity.
Figure 7
Figure 7
T cells are not required for CD11c+ macrophage accumulation but may control the inflammatory activation state. A: Body weight curves during WL (n ≥ 4). B: Glucose tolerance in Rag1−/− knockout mice after WL (left) and normalization of total body weight (right) (n = 4). C: Total CD45+CD64+ ATM content per eWAT pad for Rag1−/− mice (n ≥ 4). D: Frequency of CD11c+ ATMs among all CD45+CD64+ ATMs (n ≥ 4). Quantitative RT-PCR from flow-sorted ATMs evaluating Il6 (E), Tnfα (F), and Il1β (G) gene expression (ATMs pooled from a total of 12 mice from the ND and HFD groups and 6 mice from the WL group; WT ND n = 4, WT HFD n = 4, WT WL n = 2, Rag WL n = 4). H and I: H-E stained slides (H) and representative immunofluorescence (IFC) images (I) showing CLS development and maintenance despite WL. tAKT, total AKT; +Insulin, insulin administered. *P < 0.05; **P < 0.01; ****P < 0.0001. Significance compares with the ND-fed control group unless otherwise indicated.
Figure 8
Figure 8
Macrophages are maintained through increased proliferation and reduced apoptosis. A: Representative flow cytometry plots gated on CD45+CD64+ ATMs showing PKH26+ cells 1 day after injection, 8 weeks after injection, and a fluorescence minus one control (FMO) for PKH26. B and C: Frequency of PKH26+ ATM either 1 day after injection (B) or 8 weeks after injection (C). D: Annexin V staining of SVFs as evaluated by flow cytometry (n = 4). E and F: Representative Ki67 immunohistochemistry (IHC) slides (E) and quantification of Ki67+ nuclei surrounding CLSs from the immunohistochemistry images (F) (n ≥ 7). G: Frequency of CD45+ immune cells among all Ki67+ SVFs (n = 4). H: Frequency of ATMs among all Ki67+ cells (n = 4). I: Frequency of Ki67+ cells among all ATMs (n = 4). J: Frequency of Ki67+ CD11c (white) or Ki67+ CD11c+ (black) ATMs as a percentage of the entire SVF (n = 4). *P < 0.05; **P < 0.01; ***P < 0.001; ****P < 0.0001. Significance compares with the ND-fed control group except in J. Significance values for J compare CD11c+ with CD11c.

References

    1. Lumeng CN, Saltiel AR. Inflammatory links between obesity and metabolic disease. J Clin Invest 2011;121:2111–2117 - PMC - PubMed
    1. Thaler JP, Yi CX, Schur EA, et al. . Obesity is associated with hypothalamic injury in rodents and humans. J Clin Invest 2012;122:153–162 - PMC - PubMed
    1. Gregor MF, Hotamisligil GS. Inflammatory mechanisms in obesity. Annu Rev Immunol 2011;29:415–445 - PubMed
    1. Xu H, Barnes GT, Yang Q, et al. . Chronic inflammation in fat plays a crucial role in the development of obesity-related insulin resistance. J Clin Invest 2003;112:1821–1830 - PMC - PubMed
    1. Weisberg SP, McCann D, Desai M, Rosenbaum M, Leibel RL, Ferrante AW Jr. Obesity is associated with macrophage accumulation in adipose tissue. J Clin Invest 2003;112:1796–1808 - PMC - PubMed

Publication types

MeSH terms