. 2017 Feb 21;8(8):13886-13897.
doi: 10.18632/oncotarget.14684.

Loss of endothelial cell-specific molecule 1 promotes the tumorigenicity and metastasis of prostate cancer cells through regulation of the TIMP-1/MMP-9 expression

Affiliations

Loss of endothelial cell-specific molecule 1 promotes the tumorigenicity and metastasis of prostate cancer cells through regulation of the TIMP-1/MMP-9 expression

Chien-Min Chen et al. Oncotarget. .

Abstract

The Endothelial cell specific molecule-1 (ESM1) protein has been involved in proliferation and metastatic progression in multiple tumors. However, there are no studies regarding the mechanism of ESM1 in prostate cancer. We found that ESM1 knockdown in prostate cancer cells resulted in increased cell proliferation and colony formation ability response evidenced by decreased expression of p21 and increased expression of cyclin D1 in prostate cancer cells. Moreover, we revealed that knockdown ESM1 also induced the epithelial-mesenchymal transition (EMT), motility and invasiveness in accordance with the upregulated the MMP-9 expression, while downregulated the TIMP-1 expression. Recombinant human (Rh) TIMP-1 significantly attenuated ESM1-mediated cell migration and invasion. Additionally, ESM1 knockdown increased in vivo tumorigenicity and metastasis of prostate cancer cells. These findings provide the first evidence that the imbalance of MMP-9/TIMP-1, is one of the regulation mechanisms by which ESM1 promotes tumorigenicity and metastasis of prostate cancer cells.

Keywords: endothelial cell specific molecule 1; epithelial-mesenchymal transition; metastasis; prostate cancer cells; tumorigenicity.


Conflict of interest statement

CONFLICTS OF INTEREST

None.

Figures

Figure 1
Figure 1. Expression of ESM1 in prostate cancer cells and knockdown ESM1 on the expression of ESM1 of PC3 and DU145 cells
(A) Total lysate from PC3, DU145, and 22Rv1, LNCap cells were isolated and analyzed by western blotting (B) Total RNAs were isolated and then qRT-PCR assay was applied to detect ESM1 mRNA expression. (C) PC3 and DU145 cells were infected with shLuc or shESM1 and then purpomylin (2 or 10 mg/ml) for 5 days. Then, total lysates were isolated and analyzed by western blotting. (D) qRT-PCR assay was applied to detect ESM1. β-actin was used as internal control for protein equal loading. Values are expressed as the mean ± SE of three independent experiments. **p < 0.01.
Figure 2
Figure 2. Knockdown of ESM1 on the proliferation of PC3 and DU145 cell lines
(A) The shLuc or shESM1-PC3 and -DU145 cells on the cell viability were evaluated using a MTT assay after 1 and 2 days. (B) The clonogenic ability of shLuc or shESM1-PC3 and shESM1-DU145 cells were incubated for 14 days and total colony numbers were calculated. (C) Western blots analysis on ESM1, cyclin D1 and p21 expression in shLuc or shESM1-PC3 and shESM1-DU145 cells. Quantification of migrated cells was shown as a histogram chart. Data are presented as the mean ± SE of at least three independent experiments. β-actin was used as internal control for protein equal loading. **p < 0.01, compared with shLuc cells.
Figure 3
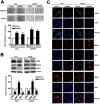
Figure 3. Knockdown of ESM1 on the migration and invasion of PC3 and DU145 cell lines
(A) The abilities of migration and invasion of shLuc or shESM1-PC3 and shESM1-DU145 cells were determined by using a migration assay and Matrigel-invasion assay. Cells in the lower surface of the Borden chamber were stained and photographed under a light microscope at ×400 magnification. Quantification of migrated cells was shown as a histogram chart. (B) Western blots analysis on ESM1, MMP-9 and TIMP-1 expression in shLuc or shESM1-PC3 and shESM1-DU145 cells. β-actin was used as internal control for protein equal loading. (C) The immunofluorescence staining of ESM1, MMP-9, and TIMP-1 expression. DAPI staining of nucleus in each cell line. Data are presented as the mean ± SE of at least three independent experiments. **p < 0.01, compared with shLuc cells. Scale bars = 100 mm.
Figure 4
Figure 4. Knockdown of ESM1 on the epithelial-mesenchymal transition of PC3 and DU145 cell lines
(A) The morphological appearance of shLuc or shESM1-PC3 and shESM1-DU145 cells and (B) then the cell lysates were subjected to western blots analysis on ESM1, vimentin and E-cadherin expression. (C) The immunofluorescence staining of ESM1, vimentin and E-cadherin expression, and cell nuclei were counterstained with DAPI reagent. Data are presented as the mean ± SE of at least three independent experiments. **p < 0.01, compared with shLuc cells. Scale bars = 100 mm.
Figure 5
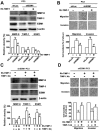
Figure 5. Rh-TIMP-1 attenuates knockdown ESM1 induces migration and invasion in PC3 cells
The shLuc and shESM1-PC3 cells were treated with 100 ng/mL RhTIMP-1 or cotreated with 100 ng/ml and 1mg TIMP-1 antibody for 24 h. (A, C) Protein expression of ESM1, MMP-9 and TIMP-1, as measured with western blotting. (B, D) The abilities of migration and invasion of cells were determined by using migration and invasion assay. Quantification of migrated cells was shown as a histogram chart. **p < 0.01, compared with shLuc cells. #p < 0.01, compared with Rh-TIMP-1 treated cells.
Figure 6
Figure 6. Knockdown of ESM1 enhances tumor growth and metastasis in prostate cancer cells in vivo
(A and C) Nude mice being inoculated with shLuc- or shESM1-PC3 and shESM1-DU145 cells were observed until study termination. (B and D). The growth of tumors was monitored in terms of tumor volume every week. At the termination of the experiment, the tumors were excised after the mice were sacrificed, and the tissue samples of excised xenograft tumors were examined with immunohistochemical stain with anti-Ki-67 antibody (×100). (E and G) and the weights of the tumors (F and H) were determined. Scale bars = 100 mm. (I) Mouse lungs showed the metastatic ability of shLuc group and shESM1 group. (J) Then the metastatic nodules were calculated and (K) the lungs were fixed in 4% paraformaldehyde and sectioned for H&E staining and immunohistochemical stain with anti-Ki-67 antibody. **p < 0.01, compared with shLuc group. Scale bars = 50 mm.

References

    1. Torre LA, Bray F, Siegel RL, Ferlay J, Lortet-Tieulent J, Jemal A. Global cancer statistics, 2012. CA Cancer J Clin. 2015;65:87–108. - PubMed
    1. Nelson WG, De Marzo AM, Isaacs WB. Prostate cancer. N Engl J Med. 2003;349:366–381. - PubMed
    1. Steinberg GD, Carter BS, Beaty TH, Childs B, Walsh PC. Family history and the risk of prostate cancer. Prostate. 1990;17:337–347. - PubMed
    1. Humphrey PA. Gleason grading and prognostic factors in carcinoma of the prostate. Mod Pathol. 2004;17:292–306. - PubMed
    1. Taylor LG, Canfield SE, Du XL. Review of major adverse effects of androgen-deprivation therapy in men with prostate cancer. Cancer. 2009;115:2388–2399. - PubMed

MeSH terms