Review
. 2017 May:58:115-151.
doi: 10.1016/j.preteyeres.2017.01.003. Epub 2017 Jan 18.

Retinal oxygen: from animals to humans

Affiliations
Review

Retinal oxygen: from animals to humans

Robert A Linsenmeier et al. Prog Retin Eye Res. 2017 May.

Abstract

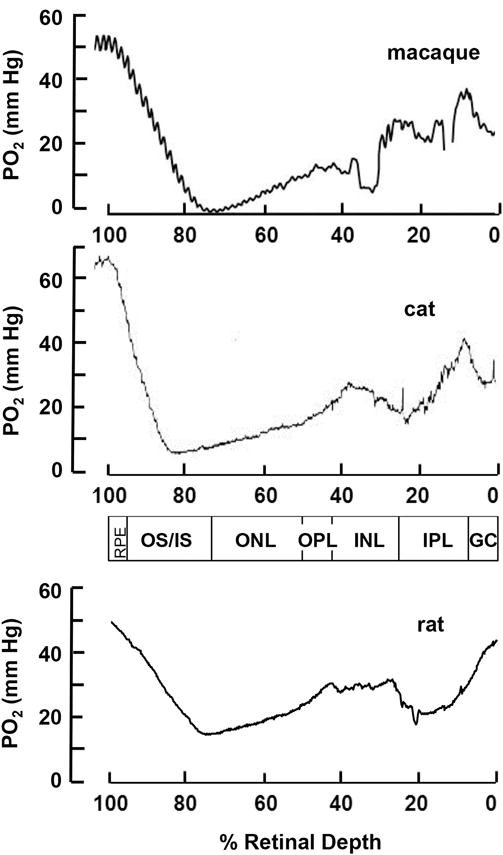
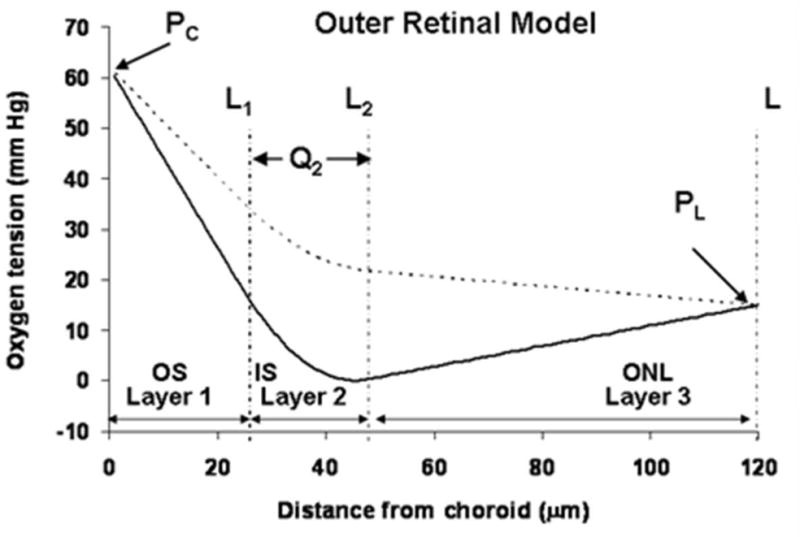
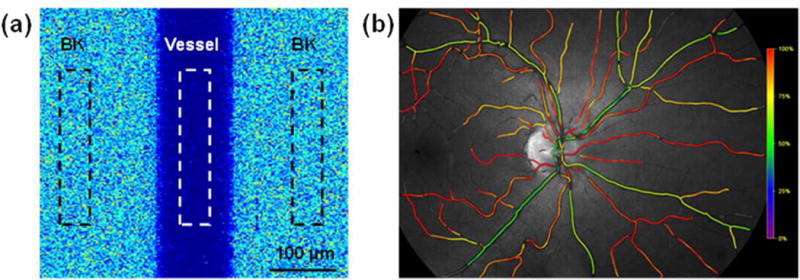
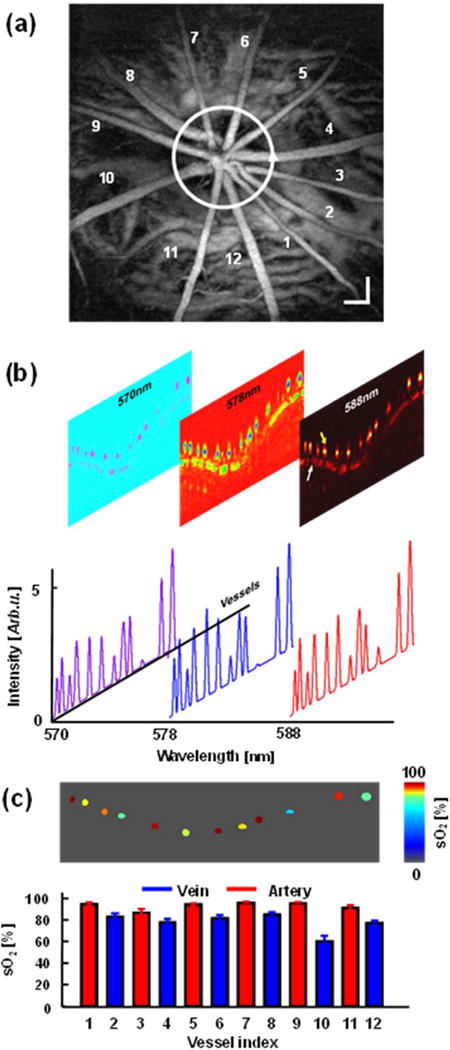
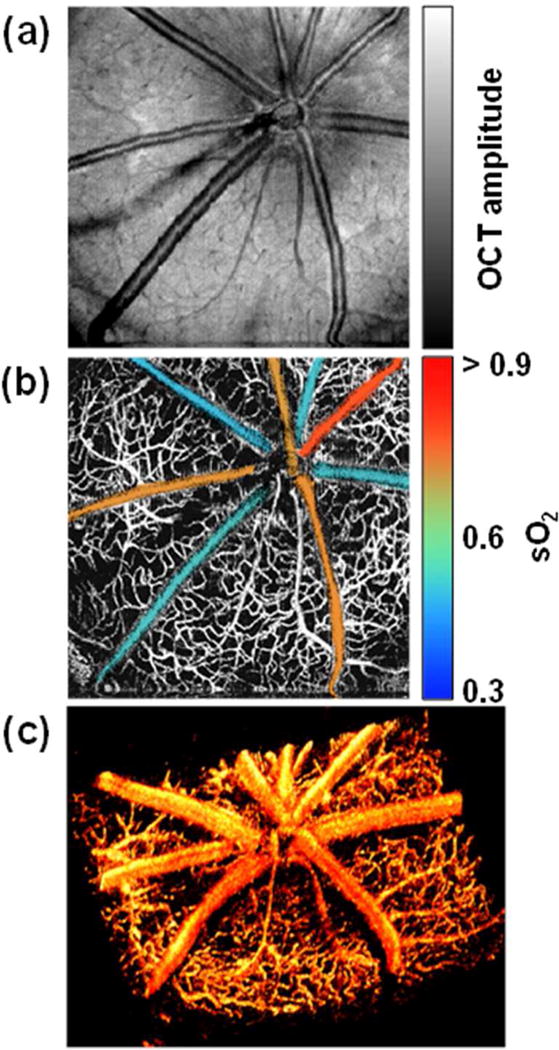
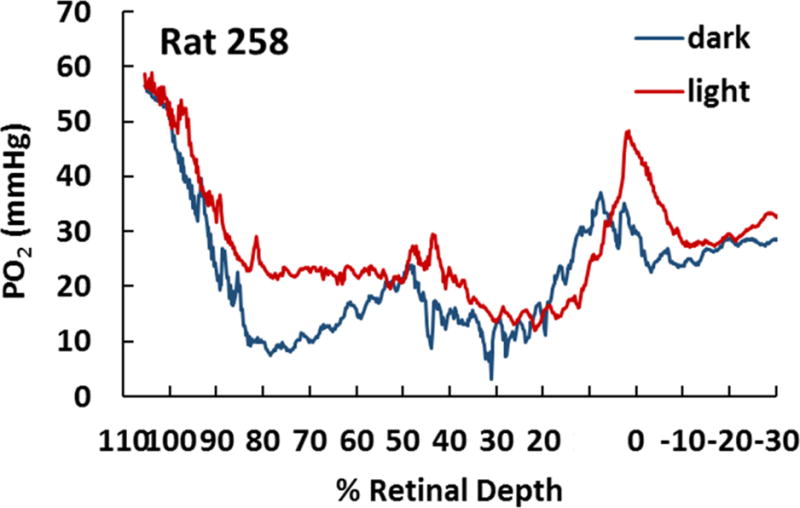
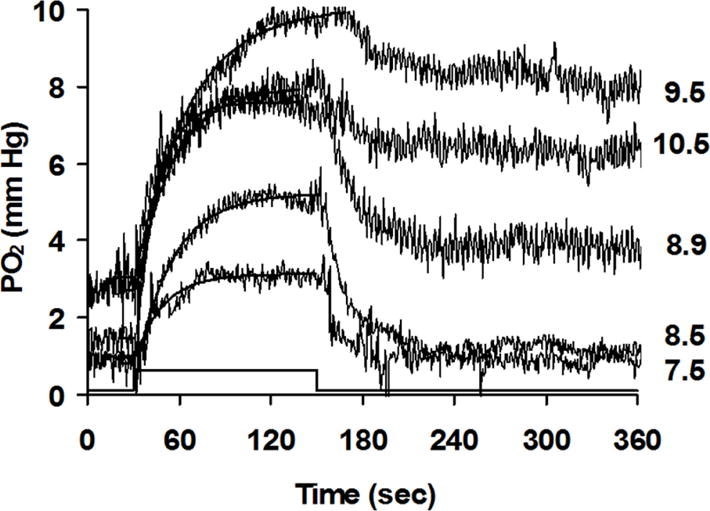
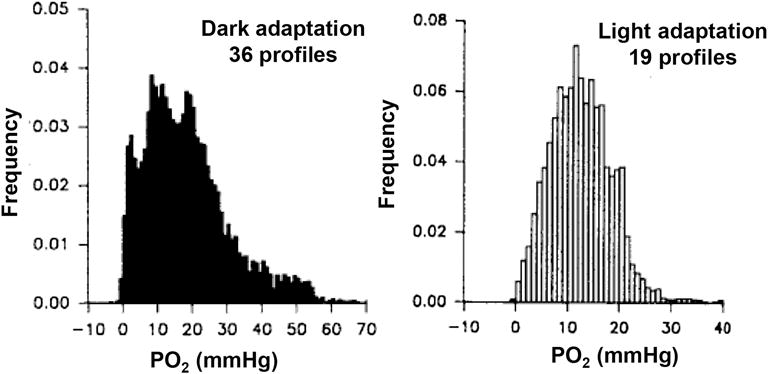
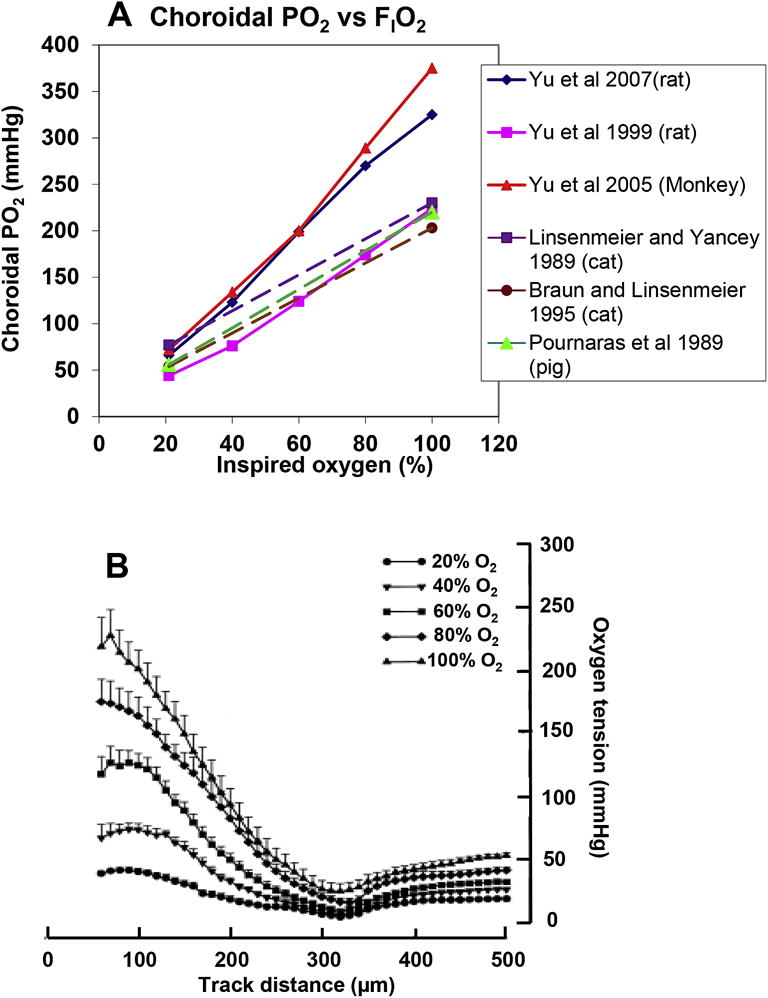
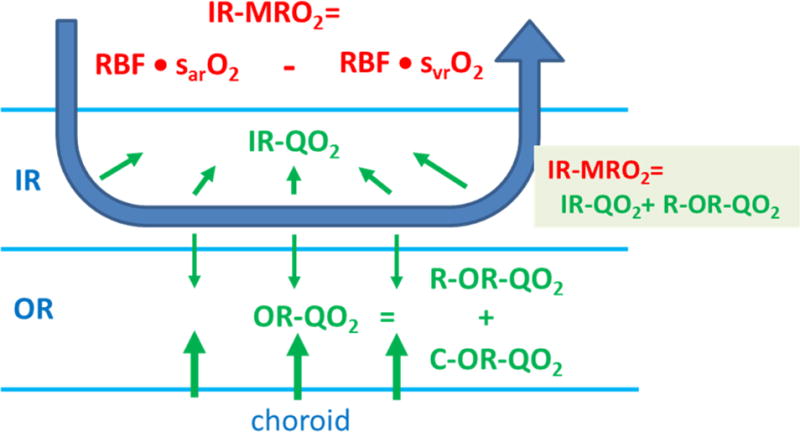
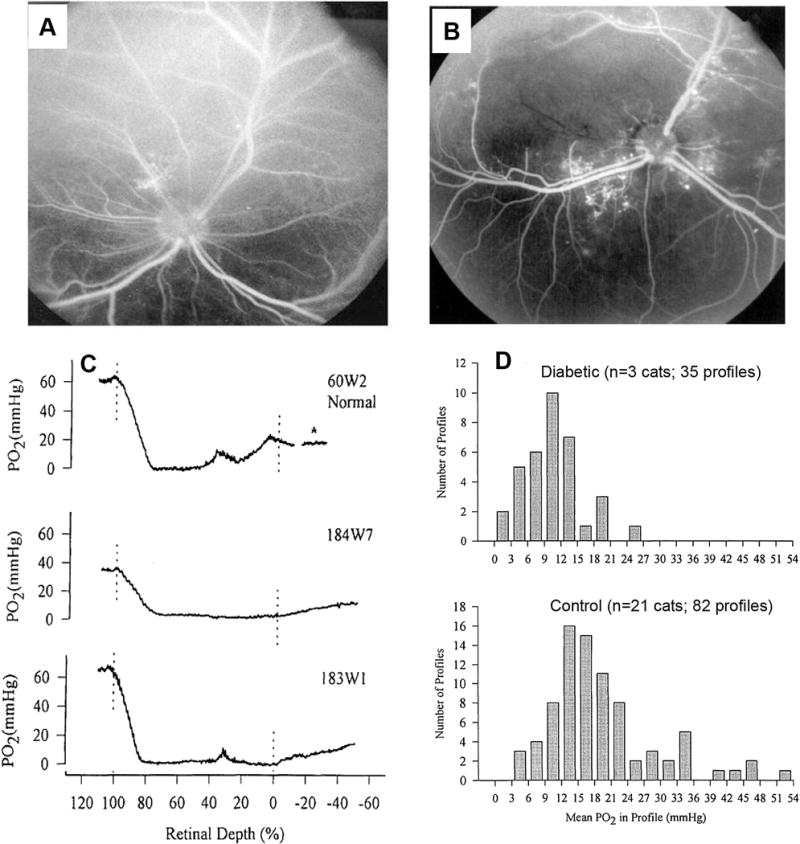
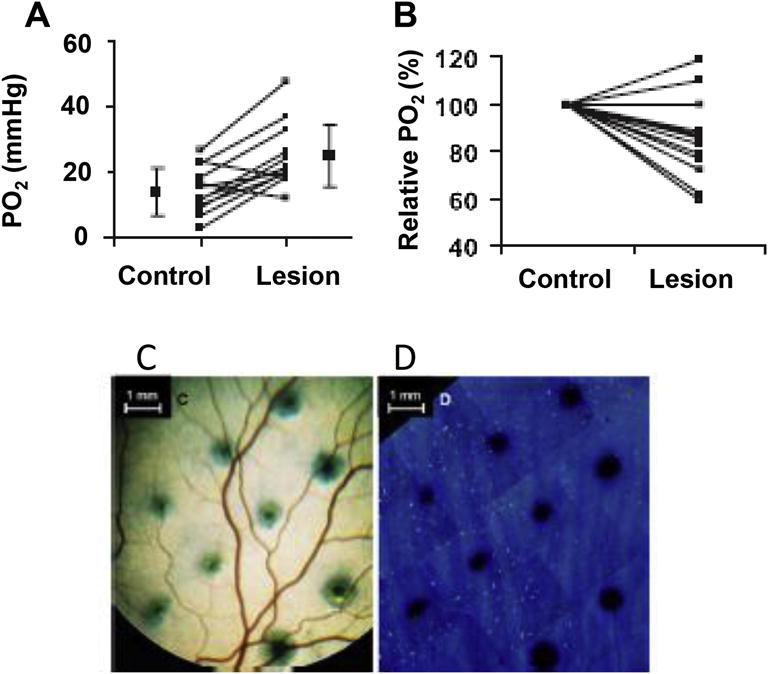
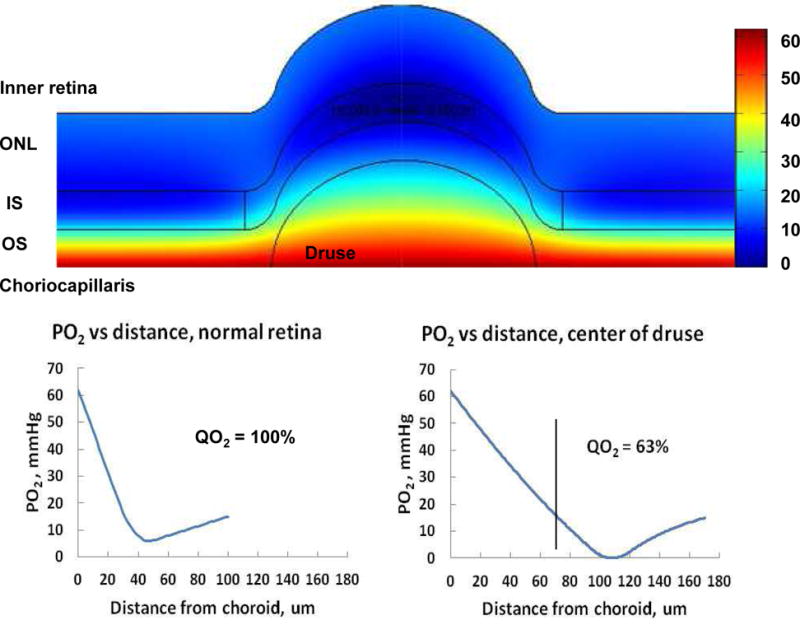
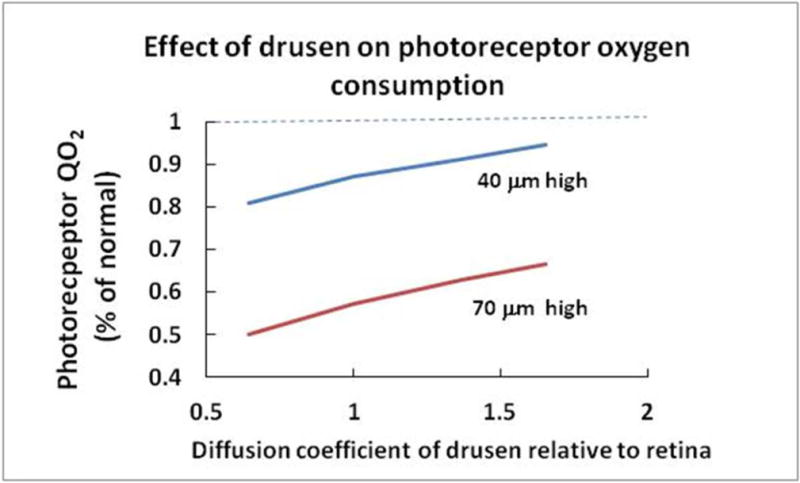
This article discusses retinal oxygenation and retinal metabolism by focusing on measurements made with two of the principal methods used to study O2 in the retina: measurements of PO2 with oxygen-sensitive microelectrodes in vivo in animals with a retinal circulation similar to that of humans, and oximetry, which can be used non-invasively in both animals and humans to measure O2 concentration in retinal vessels. Microelectrodes uniquely have high spatial resolution, allowing the mapping of PO2 in detail, and when combined with mathematical models of diffusion and consumption, they provide information about retinal metabolism. Mathematical models, grounded in experiments, can also be used to simulate situations that are not amenable to experimental study. New methods of oximetry, particularly photoacoustic ophthalmoscopy and visible light optical coherence tomography, provide depth-resolved methods that can separate signals from blood vessels and surrounding tissues, and can be combined with blood flow measures to determine metabolic rate. We discuss the effects on retinal oxygenation of illumination, hypoxia and hyperoxia, and describe retinal oxygenation in diabetes, retinal detachment, arterial occlusion, and macular degeneration. We explain how the metabolic measurements obtained from microelectrodes and imaging are different, and how they need to be brought together in the future. Finally, we argue for revisiting the clinical use of hyperoxia in ophthalmology, particularly in retinal arterial occlusions and retinal detachment, based on animal research and diffusion theory.

Keywords: Animal; Diabetes; Human; Hyperoxia; Hypoxia; Macular degeneration; Oximetry; Oxygen; Oxygen microelectrode; Retina; Retinal detachment; Retinal metabolism.


Figures

Figure 1
Figure 1
Representative O2 profiles through the dark-adapted retina of rhesus monkey (top), cat (middle) and Long-Evans rat (bottom). A retinal depth of zero is the vitreoretinal border, and 100% is the RPE-choroid border. An approximate scale of retinal layers is shown for cat. Modified from (Linsenmeier, 2012).
Figure 2
Figure 2
Three-layer one-dimensional mathematical model of outer retinal oxygen diffusion and consumption. Parameters of the model are indicated: Pc: choriocapillaris PO2, PL: PO2 at the border between the avascular outer retina and the vascularized inner retina; L1 and L2: borders of the consuming region, layer 2; L: border between outer and inner retina; Q2: Oxygen utilization of layer 2. Oxygen utilization in layers 1 and 3 is zero. The solid curve is an illustration for dark adaptation in which Q2 is 21.6 ml O2-100g−1-min−1 (so OR-QO2 is 4.5 ml O2-100g−1-min−1) and the dashed line is a simulation for light adaptation, in which Q2 is half the value for the dark-adapted case. From (Linsenmeier and Pournaras, 2008).
Figure 3
Figure 3
Principle of fundus photography-based retinal oximetry. (a) Illustration on how to extract pixelated intensity values to estimate optical attenuation by blood vessels. Modified from Figure 4(c) in (Liu et al., 2013). BK: background; (b) A typical result of human retinal oximetry. Figure 3 in (Geirsdottir et al., 2012).
Figure 4
Figure 4
Retinal sO2 imaging using multi-wavelength PAOM. (a) Fundus image generated by max-amplitude-projection of the volumetric photoacoustic data from an adult Sprague Dawley rat. Bar: 200 μm; (b) PAOM cross-sectional images at three optical wavelengths (570 nm, 578 nm, and 588 nm) from the scanning trajectory highlighted by the white circle in panel a; (c) Upper: pseudo-colored vessels as imaged in the circular B-scan based on their measured sO2 values; lower: comparison of sO2 values in all the major vessels (numbered from 1 to 12) along the circular scanning trajectory. Figures are modified from Figure 1 and Figure 2 in (Song et al., 2014).
Figure 5
Figure 5
Retinal sO2 imaging using Vis-OCT. (a) En face mean-amplitude-projection image of the Vis-OCT volumetric data acquired from a Long Evans rat in vivo; (b) En face mean-amplitude-projection of the motion enhanced microangiography. Each major retinal arterioles and venules are color-encoded based on the measured sO2 values; (c) A three dimensional rendering of retinal microvasculature imaged by Vis-OCT. Figures modified from Figure 3 in (Chen et al., 2015b).
Figure 6
Figure 6
Dark-adapted (blue) and light-adapted (red) PO2 profiles from a Long-Evans rat.
Figure 7
Figure 7
PO2 changes during 2 min steps of illumination in distal retina of a monkey. The retina was in darkness except between 30 and 150 sec, when it was illuminated with the levels shown at the right (in log quanta-deg−2-sec−1). The transition from darkness to light is fitted with single exponentials. At and above 8.9 log quanta-deg−2-sec−1, there was a rod after-effect, and the PO2 took many minutes to return to baseline after illumination. From (Wang et al., 2010b).
Figure 8
Figure 8
Histograms of inner retinal PO2 in cat retina obtained from dark-adapted profiles (left) and light-adapted profiles (right) when arterial PO2 was above 85 mmHg. Modified from (Linsenmeier and Braun, 1992).
Figure 9
Figure 9
Spontaneous fluctuations in PO2 in the cat retina. Left: Sixty second samples of PO2 obtained at the depths shown in one cat retina. In the inner retina (top two traces), the PO2 varies in a sporadic way. In the outer retina, fluctuations disappear and only electrode noise is apparent. Near the choroid (bottom trace) the dominant fluctuations are at the respiratory frequency. Right top: Total power in spontaneous fluctuations in the inner retina in 43 records from 13 cats. Right bottom: Frequency distribution of the fluctuations from the same records, with power normalized to its own total power before averaging. Modified from (Linsenmeier and Braun, 1992).
Figure 10
Figure 10
Computational model of O2 diffusion in the vitreous. A. the modeled region and PO2 scale, which applies to A and B. The average PO2 at the retinal surface was set to 20 mmHg, and random fluctuations of ±15 mmHg were added to simulate the locations of arterioles or venules in the retina. B. Enlargement of the boxed region in A. Arrows show the direction and magnitude of local O2 flux, illustrating the non-uniformity of PO2 within about 250 μm from the retinal surface, and the diffusion of O2 from regions of higher to lower PO2 through the vitreous. The region in B is about 1200 μm by 1200 μm. C. PO2 as a function of distance from the retina along the red and blue dashed lines in B. By approximately 250 μm into the vitreous the gradient becomes essentially independent of the PO2 at the retinal surface, but this distance depends on the distribution of sources and sinks as suggested by panel A. (From (Filas et al., 2013)).
Figure 11
Figure 11
Lactate production and O2 and glucose consumption in the outer retina (top) and inner retina (bottom) in darkness (orange bars) and light (blue bars) derived from arteriovenous differences and blood flow measurements in the pig retina. From (Linsenmeier, 2010), modified from (Wang et al., 1997c).
Figure 12
Figure 12
Effect of hypoxia on retinal PO2 in cat. A. Profiles obtained during dark adaptation at three values of arterial PO2, given at the right of traces. Profiles are superimposed in the lower part of the panel. B. Profiles obtained during light adaptation at three values of arterial PO2. C. Choriocapillaris PO2 as a function of arterial PO2 in normoxia and hypoxia. Individual cats are represented by different symbols, with filled symbols representing measurements during dark adaptation, and open symbols representing measurements in light adaptation. From (Linsenmeier and Braun, 1992).
Figure 13
Figure 13
Effects of hyperoxia on PO2. A. Relationship of choriocapillaris PO2, measured with microelectrodes, to inspired PO2. Data from (Braun and Linsenmeier, 1995; Linsenmeier and Yancey, 1989; Pournaras et al., 1989; Yu et al., 1999; Yu et al., 2005b; Yu et al., 2007). B. Profiles of PO2 in rat retina at graded levels of hypoxia. Modified from (Yu et al., 1999).
Figure 14
Figure 14
Schematic representation of O2 supply from the retinal and choroidal circulations to the inner and outer retina, showing the relationship between O2 extraction from the retinal circulation (IR-MRO2) and the O2 consumption of the inner and outer retina (IR-QO2 and OR-QO2).
Figure 15
Figure 15
Effect of long-term diabetes on oxygenation of cat retina. A. Fluorescein angiogram at the stage when O2 measurements were made (7 to 9 years diabetic). B. Fluorescein angiogram from a cat at a later stage of retinopathy. C. PO2 profiles in a normal cat (top), and two diabetic cats (middle and lower). D. Histograms of average inner retinal PO2 in each profile from 3 diabetic cats (top) and 21 diabetic cats (bottom). A, C, D modified from (Linsenmeier et al., 1998); B from (Budzynski et al., 2005).
Figure 16
Figure 16
Effects of photocoagulation on the cat retina. A. Average inner retinal PO2 in cats in normal areas of retina and adjacent areas with argon laser photocoagulation of the outer retina. Recordings were at least 4 weeks after the photocoagulation. Each line represents data from one animal. Grand averages are shown to the left and right of data points. B. Choroidal PO2 in control and photocoagulated areas in the same animals, normalized to PO2 in the control area of each animal. C. Small outer retinal lesions made to investigate effect of photocoagulation on choroidal blood flow. D. Flat mounted choroid from animal shown in C, revealing the distribution of fluorescent microspheres (colored dots) embedded in the choriocapillaris after arterial injection. There were rarely any microspheres in the choriocapillaris under a lesion, indicating lack of choriocapillaris blood flow. A and B: From (Budzynski et al., 2008). C and D: (Lee et al., 2011).
Figure 17
Figure 17
Simulations of PO2 distribution in and around photocoagulation lesions. A. Photograph of lesions in a cat retina. B: Left: Cylindrical geometry for simulations of lesions. The lesioned area has scar tissue in place of the outer retina. The inner retina (light gray) is in its normal location. Outside the lesion the retina has the usual layers. For the simulations, layer 2 was assumed to have normal QO2 outside the lesion, and no QO2 in the scar tissue. The inner retina was assumed to have normal metabolism, but no circulation, so at all radial positions, the simulation represents an area with severe capillary loss. Right: PO2 distribution resulting from the finite element simulation from the center of the lesion (r=0 μm) to normal retina at r=500 μm. The color scale for PO2 is shown at the far right. C: Similar to B, but showing the other frequently observed lesion geometry, in which the outer retina disappears, and the inner retina (light gray) becomes adjacent to the choroid. In these simulations a transition region is included, in which the thickness of the outer retinal layers gradually increases from the lesioned area to normal retina. In both geometries, the PO2 in the inner retina over the lesion is elevated (lighter blue) relative to adjacent areas, consistent with the data of Figure 16, but the effect of photocoagulation only extends a very small way lateral to the lesion. Modified and reanalyzed from (Budzynski, 2005).
Figure 18
Figure 18
Effect of hyperoxia during arterial occlusion in the cat retina. A. PO2 profiles in dark-adapted cat retina before occlusion, during occlusion of a branch retinal artery with a glass probe and air breathing, and during occlusion and oxygen breathing. B. Simulated profiles with a four-layer PO2 model (Braun et al., 1995) during occlusion and air breathing, occlusion and 100% O2 breathing (assuming a choroidal PO2 that would be expected from Figure 13A, and occlusion with a choroidal PO2 just high enough to sustain inner retinal metabolism (Q4 or IR-QO2) at the normal level. The asterisk shows the choroidal PO2 expected for inspiration of O2 through a typical nasal cannula. C. Similar to B, but including a simulation for O2 delivery at 2 ATA.
Figure 19
Figure 19
Effect of retinal detachment on retinal PO2 and outer retinal O2 consumption. A. Simulation of outer retinal metabolism in a cat breathing air, when the outer retina (horizontal bar) is attached, or detached by 100 and 500 μm. The dashed line is the model for the attached retina in light adaptation. The boundary PO2s are 62 mmHg at the choroid, and 15 mmHg at the inner border of the avascular layer. Detachment is expected to severely reduce photoreceptor metabolism. B. Simulation of a 500 μm detachment during air and O2 breathing, with the boundary values as noted on the figure. Inspiration of O2 is expected to elevate outer retinal QO2. C. Effect of detachment on OR-QO2 for different detachment heights under three assumptions: air breathing (bottom curve), O2 breathing when Pc but not PL is elevated (middle curve), and O2 breathing when both PC and PL are elevated (top curve). The retinal circulation makes only a small contribution to photoreceptor metabolism ordinarily, but in the setting of detachment, the modest hyperoxic increase in inner retinal PO2 represented by PL here, is of great benefit to the photoreceptors, as shown by comparing the middle and top curves. From (Linsenmeier and Padnick-Silver, 2000).
Figure 20
Figure 20
Experimental results of using hyperoxia during retinal detachment in cat. A. A PO2 profile through a dark-adapted cat retina during air breathing. Pc is at the left of the fluid layer (FL) under the retina, and Po represents the PO2 at the border between the fluid and the retina. B. A PO2 profile during hyperoxia and detachment. C. OR-QO2 in detachment during hyperoxia, and detachment during air breathing, normalized to the value in the attached retina during air breathing in 9 cats. D. Po in detachment during hyperoxia, and detachment during air breathing, normalized to the value in the attached retina during air breathing. E. PL in detachment during hyperoxia, and detachment during air breathing, normalized to the value in the attached retina during air breathing. In C-E, asterisks show significant differences at p<0.05. From (Wang and Linsenmeier, 2007).
Figure 21
Figure 21
The effect of a druse on PO2 in the outer retina. Top: Cylindrical geometry to simulate a druse (here 70 μm high and 200 μm in diameter) under the retina, which pushes the outer retina forward. The O2 consumption of layer 2 (Q2) was decreased in the area over the druse just enough to keep PO2 from going below zero. For this simulation the druse had the same O2 diffusion coefficient as the retina. Vertical lines represent the position of the PO2 slices in the lower part of the figure. PO2 color scale at right. Bottom left: PO2 vs. distance from the simulation through normal retina. Bottom right: PO2 vs. distance in the center of the druse. Modified and reanalyzed from (Peddada and Linsenmeier, 2005).
Figure 22
Figure 22
Effect of a druse on outer retinal O2 consumption as a function of the O2 diffusion coefficient in drusen and drusen height. This graph was constructed from data obtained from simulations like those in Figure 21, in which the relative diffusion coefficient of drusen was varied from half of the value in the retina to twice the value in retina. As expected, if the diffusion coefficient is higher, more O2 can get through the druse, so the impact on photoreceptor metabolism is lower, and the lines have small positive slopes. However, no matter what the diffusion coefficient, drusen of 40 μm or more in height are expected to compromise O2 delivery and oxidative metabolism in the photoreceptors, and this is progressively worse for larger drusen.

Similar articles

Cited by

References

    1. Aalkjaer C, Boedtkjer D, Matchkov V. Vasomotion – what is currently thought? Acta Physiol (Oxf) 2011;202:253–269. - PubMed
    1. Abcouwer SF, Gardner TW, Nyas Diabetic retinopathy: loss of neuroretinal adaptation to the diabetic metabolic environment, Year in Diabetes and Obesity. 2014:174–190. - PMC - PubMed
    1. Adamis AP, Miller JW, Bernal MT, D’Amico DJ, Folkman J, Yeo TK, Yeo KT. Increased vascular endothelial growth factor levels in the vitreous of eyes with proliferative diabetic retinopathy. Am J Ophthalmol. 1994;118:445–450. - PubMed
    1. Adamis AP, Shima DT. The role of vascular endothelial growth factor in ocular health and disease. Retina. 2005;25:111–118. - PubMed
    1. Aiello LP, Avery RL, Arrigg PG, Keyt BA, Jampel HD, Shah ST, Pasquale LR, Thieme H, Iwamoto MA, Park JE, et al. Vascular endothelial growth factor in ocular fluid of patients with diabetic retinopathy and other retinal disorders. N Engl J Med. 1994;331:1480–1487. - PubMed

Publication types