

Increasing Rates of No Treatment in Advanced-Stage Non-Small Cell Lung Cancer Patients: A Propensity-Matched Analysis
- PMID: 28109804
- PMCID: PMC5510589
- DOI: 10.1016/j.jtho.2016.11.2221
Increasing Rates of No Treatment in Advanced-Stage Non-Small Cell Lung Cancer Patients: A Propensity-Matched Analysis
Abstract
Introduction: Variation in treatment and survival outcomes for NSCLC is high among patients with stage III or IV disease, but patients with untreated NSCLC have not been critically analyzed to evaluate for improvable outcomes. We evaluated treatment trends and their association with oncologic outcomes for NSCLC, hypothesizing that there are a substantial number of untreated patients who are similar to patients who undergo treatment.
Methods: Linear regression was used to calculate trends in utilization of treatment. Kaplan-Meier and Cox regression modeling were used to determine predictors of receiving treatment. Propensity matching was used to compare survival among subsets of treated versus untreated patients.
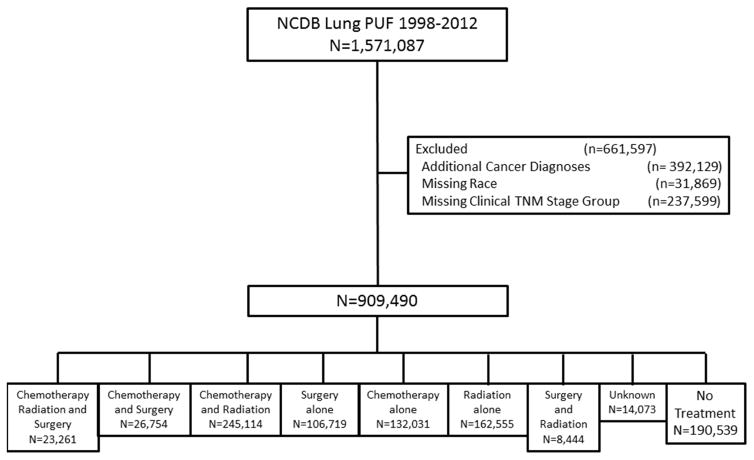
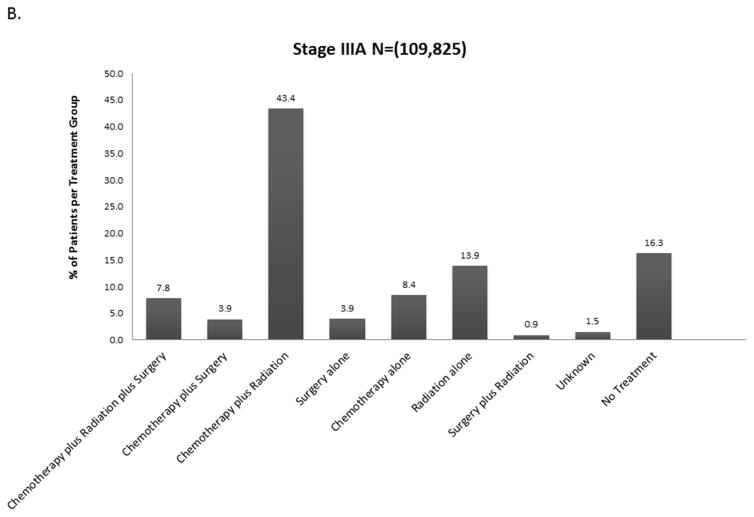
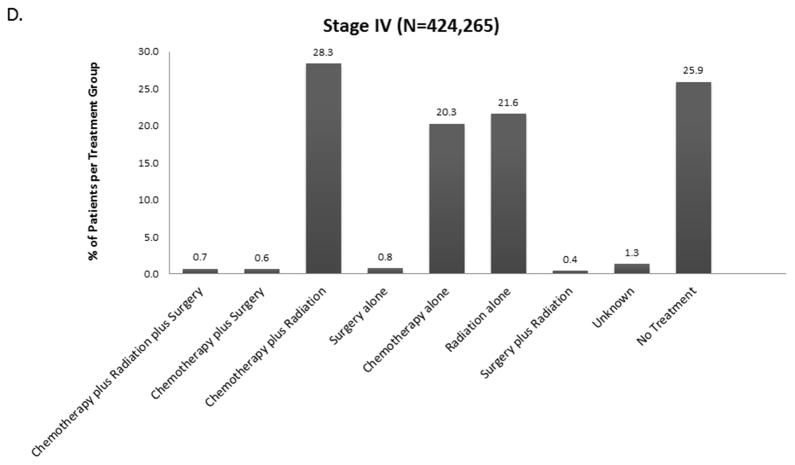
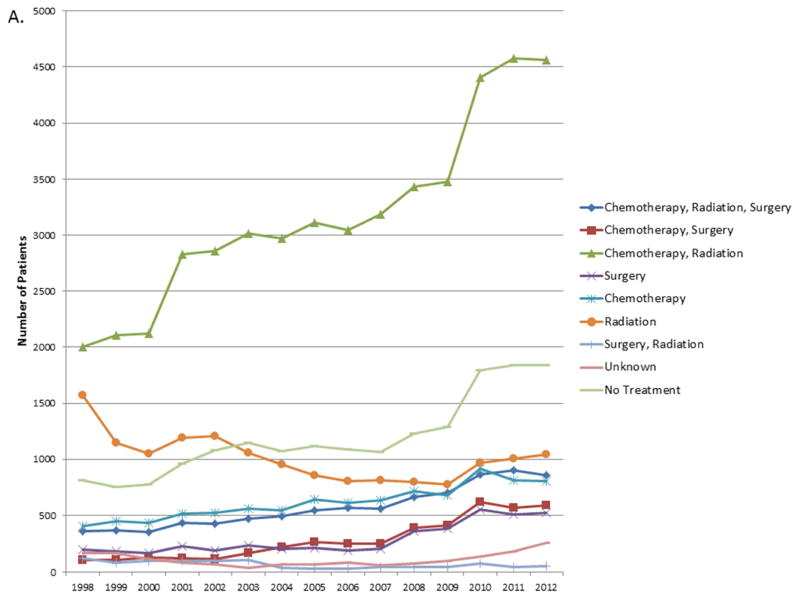
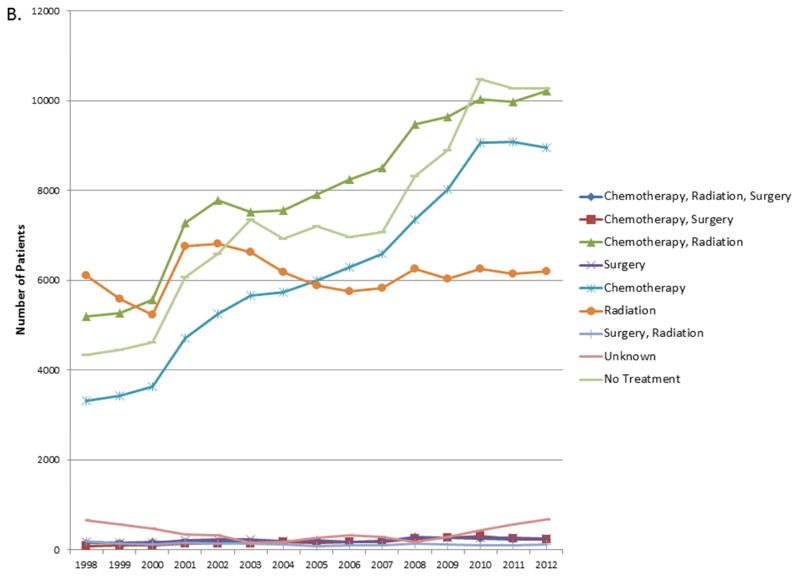
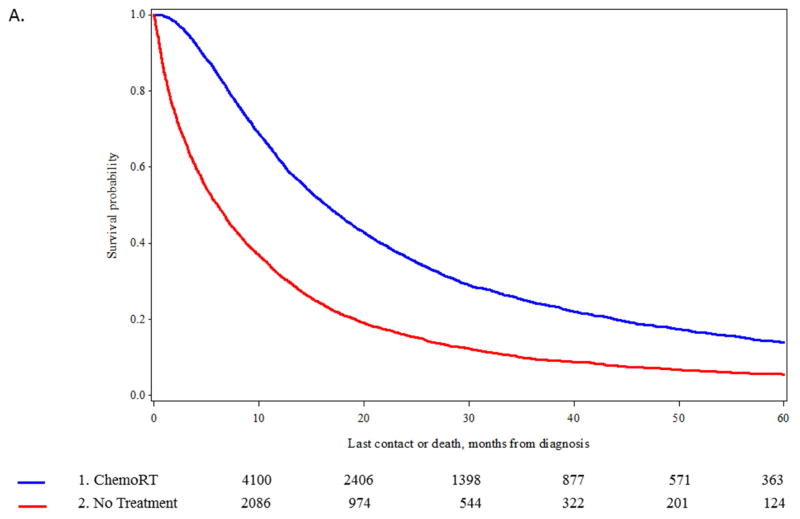
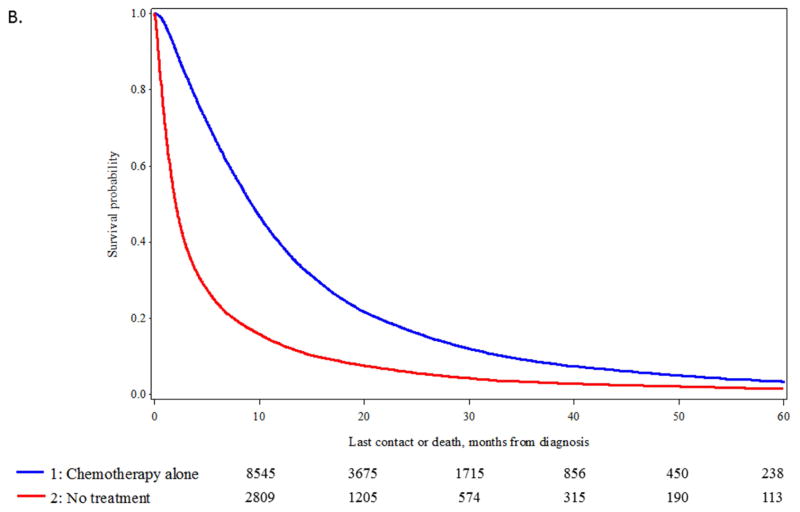
Results: Patients with primary NSCLC were identified from the National Cancer Data base from 1998 to 2012, and 21% of patients (190,539) received no treatment. For stage IIIA and IV, the proportion of untreated patients increased over the study period by 0.21% and 0.4%, respectively (p = 0.003 and p < 0.0001). Regardless of stage, untreated patients had significantly shorter overall survival (OS) (p < 0.0001). Propensity-matched analyses of 6144 stage IIIA patient pairs treated with chemoradiation versus no treatment confirmed shorter OS for untreated patients (median 16.5 versus 6.1 months, p < 0.0001). For 19,046 stage IV patient pairs treated with chemotherapy versus no treatment, similar results were obtained (median OS 9.3 versus 2.0 months, p < 0.0001).
Conclusions: The proportion of untreated patients with stage IIIA and IV disease is increasing. Survival outcomes among patients with advanced-stage disease are superior with treatment, independent of selection bias. The benefits and risks of treatment should be carefully assessed before choosing to forego treatment.
Keywords: Chemotherapy; NSCLC; Natural history; Radiation; Surgery; Untreated.
Published by Elsevier Inc.
Figures
Comment in
-
Reframing the Concept of "No Treatment" in Advanced NSCLC.J Thorac Oncol. 2017 Aug;12(8):e125-e126. doi: 10.1016/j.jtho.2017.04.015. J Thorac Oncol. 2017. PMID: 28748822 No abstract available.
-
Response to "Reframing the Concept of 'No Treatment' in Advanced NSCLC".J Thorac Oncol. 2017 Aug;12(8):e126-e127. doi: 10.1016/j.jtho.2017.05.007. J Thorac Oncol. 2017. PMID: 28748823 No abstract available.
References
-
- American Cancer Society. Cancer Fact and Figures. 2014 http://www.cancer.org/acs/groups/content/@research/documents/webcontent/....
-
- [Accessed January 7, 2016];SEER Stat Fact Sheets: Lung and Bronchus Cancer. http://seer.cancer.gov/statfacts/html/lungb.html. Published 2015.
-
- Wakelee Ha, Bernardo P, Johnson DH, Schiller JH. Changes in the natural history of nonsmall cell lung cancer (NSCLC)--comparison of outcomes and characteristics in patients with advanced NSCLC entered in Eastern Cooperative Oncology Group trials before and after 1990. Cancer. 2006;106(10):2208–2217. doi: 10.1002/cncr.21869. - DOI - PubMed
-
- [Accessed January 1, 2016];NCCN Guidelines for NSCLC. http://www.nccn.org/professionals/physician_gls/pdf/nscl.pdf.
-
- Smith TJ, Penberthy L, Desch CE, et al. Differences in initial treatment patterns and outcomes of lung cancer in the elderly. Lung Cancer. 1995;13(3):235–252. - PubMed
Publication types
MeSH terms
Grants and funding
LinkOut - more resources
Full Text Sources
Other Literature Sources
Medical
