. 2017 Mar 1;25(3):621-633.
doi: 10.1016/j.ymthe.2016.12.014. Epub 2017 Jan 18.

Optical Barcoding for Single-Clone Tracking to Study Tumor Heterogeneity

Affiliations

Optical Barcoding for Single-Clone Tracking to Study Tumor Heterogeneity

Malte Mohme et al. Mol Ther. .

Abstract

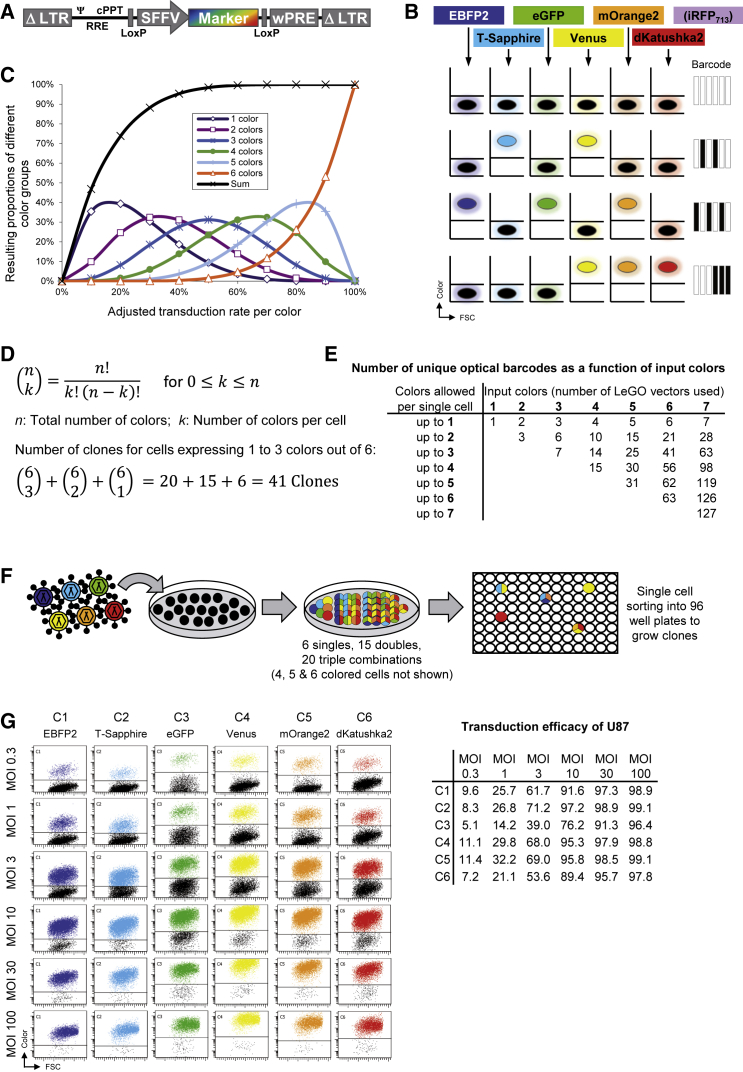
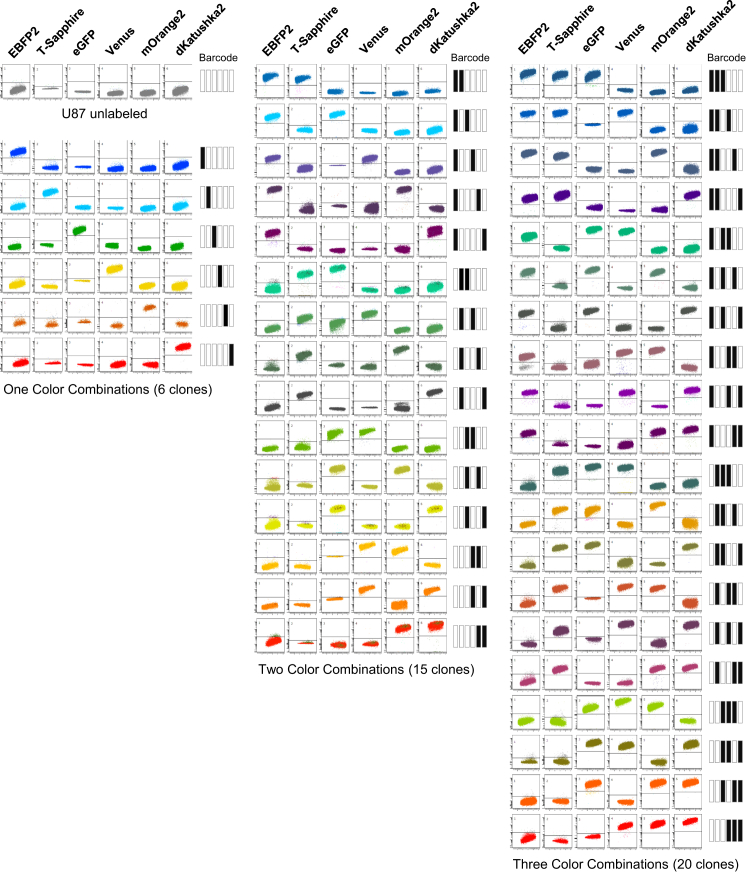
Intratumoral heterogeneity has been identified as one of the strongest drivers of treatment resistance and tumor recurrence. Therefore, investigating the complex clonal architecture of tumors over time has become a major challenge in cancer research. We developed a new fluorescent "optical barcoding" technique that allows fast tracking, identification, and quantification of live cell clones in vitro and in vivo using flow cytometry (FC). We optically barcoded two cell lines derived from malignant glioma, an exemplary heterogeneous brain tumor. In agreement with mathematical combinatorics, we demonstrate that up to 41 clones can unambiguously be marked using six fluorescent proteins and a maximum of three colors per clone. We show that optical barcoding facilitates sensitive, precise, rapid, and inexpensive analysis of clonal composition kinetics of heterogeneous cell populations by FC. We further assessed the quantitative contribution of multiple clones to glioblastoma growth in vivo and we highlight the potential to recover individual viable cell clones by fluorescence-activated cell sorting. In summary, we demonstrate that optical barcoding is a powerful technique for clonal cell tracking in vitro and in vivo, rendering this approach a potent tool for studying the heterogeneity of complex tissues, in particular, cancer.

Keywords: LeGO vectors; barcoding; clonal tracking; flow cytometry; fluorescent labeling; glioma; invasion; in vivo; mouse model; tumor heterogeneity.


Figures

None
Graphical abstract
Figure 1
Figure 1
The Principle of Optical Barcoding (A) Schematic representation of lentiviral third-generation self-inactivating LeGO vectors used in this study. cPPT, central polypurine tract; loxP, recognition sites of Cre recombinase; ΔLTR, self-inactivating long-terminal repeat; Marker, fluorescent protein cDNA; ψ, packaging signal; RRE, rev-responsive element; SFFV, spleen focus-forming virus U3 promoter; wPRE, Woodchuck hepatitis virus posttranscriptional regulatory element. (B) Listed fluorescent proteins served as markers to define optical barcodes analyzable by flow cytometry. The schematic FC plots show the digital/binary readout for each of the six color channels, which can be translated into a barcode. (C) Graph depicts the distribution of color combinations after labeling the cells. Population sizes of all color combinations are calculated based on the mathematical set theory, depending on the initial gene transfer rates for each of the six vectors used. The mathematical model is based on two assumptions: the probability to become transduced is the same for all cells within the targeted population, and all six viral vectors are applied in equimolar concentrations. The model shows the importance of the initial gene transfer rates when aiming for certain color combinations. (D) The calculation of the number of distinguishable color barcodes using the binomial coefficient solely depends on the initial number of single colors and the number of colors allowed per cell. We used six initial colors and allowed cells to express one to three colors simultaneously, leading to a total number of 41 distinct color codes (20 three-color combinations, 15 two-color combinations, and 6 single colors). (E) Using the formula presented in (D), the table shows an overview of the expected number of distinguishable color codes depending on the number of input colors and the number of colors allowed per cell. (F) Schematic representation of the labeling procedure. U87 cells were transduced with six LeGO vectors at equimolar rates at the same time, each expressing a different fluorescent protein. The stochastic mixture leads to the occurrence of all possible color combinations (depending on the transduction rate), which then can be sorted into 96-well plates to grow single-cell-derived clones. (G) Exemplary FC data of U87 cells transduced with the six vectors at the same time at different MOIs. The table indicates the resulting transduction rates per color.
Figure 2
Figure 2
FC Plots of the 41 U87 OBC Clones Resulting from a Combination of One, Two, or Three Colors The 41 OBC clones as well as their corresponding binary barcodes are shown.
Figure 3
Figure 3
FC Quantification of the U87 OBC Mix Clones Is Not Dependent on the Proportion or Number of Clones (A) FC plot example of four U87 OBC clones labeled with the color C2, C1+C2, C2+C3, and C3+C4 as well as the FC quantification of a mix of 31 U87 OBC clones. (B) Exemplary gating strategy with FACSDiva software to identify individual clones by positivity or negativity for each color (C1–C6). (C) Bar graph representing FC quantification data of a U87 OBC 13 clones mix with one clone (U_1+3) proportion being doubled within each mixture. (D) Bar graph representing FC quantification data of a U87 OBC 13 clones mix with one clone being removed from the mix each time.
Figure 4
Figure 4
Simplified Approach to Label 21 Clones of a Malignant Glioma Syngeneic Mouse Model with GL261 Cells (A) Schematic representation of the experimental flow to obtain 21 OBC GL261 clones, where each color combination is separately transduced in different wells and then sorted into 96-well plates to grow single-cell-derived clones. (B) Lentiviral vector titration assay on GL261 cells. With a MOI of 100 applied to the cells, a 29%–54% transduction rate per color was achieved. Each titration plot is the result of a transduction in an individual well.
Figure 5
Figure 5
In Vitro Validation of Growth, Tumor Initiation Capacity, and Quantification of Clonal Dynamics in a Mix of GL261 OBC Clones (A) Growth curves of 21 GL261 OBC clones analyzed independently by the ATP-based proliferation assay over 7 days. (B) Quantification of the proliferation assay by calculation of the doubling time for each individual 21 GL261 OBC clones. (C) Soft-agar assay pictures for 21 OBC GL261 clones over 14 days quantified by number of colonies and global area. (D) Bar graph representing FC quantification of the clonal evolution of a mix of 21 GL261 OBC clones propagated in vitro for 60 days and analyzed at each passage.
Figure 6
Figure 6
Intracranial Injection of a Mix of 21 GL261 OBC Clones in Equal Proportion Results in Drastic Clonal Restriction in the Tumor Formation (A) Experimental flow for in vivo intracranial injection of the mix of 21 GL261 OBC clones and further FC quantification. (B) FC quantification of the mix of 21 GL261 OBC clones in equal proportion before the intracranial injection. (C) FC quantification of the mix of 21 GL261 OBC clones after tumor growth to analyze clonal evolution. (D) Bar graph representation of the FC quantification from the GL261 OBC clone mix evolution in the brain tumors extracted from six mice.

References

    1. Greaves M., Maley C.C. Clonal evolution in cancer. Nature. 2012;481:306–313. - PMC - PubMed
    1. Burrell R.A., McGranahan N., Bartek J., Swanton C. The causes and consequences of genetic heterogeneity in cancer evolution. Nature. 2013;501:338–345. - PubMed
    1. Schepers K., Swart E., van Heijst J.W.J., Gerlach C., Castrucci M., Sie D., Heimerikx M., Velds A., Kerkhoven R.M., Arens R., Schumacher T.N. Dissecting T cell lineage relationships by cellular barcoding. J. Exp. Med. 2008;205:2309–2318. - PMC - PubMed
    1. Mann K.M., Newberg J.Y., Black M.A., Jones D.J., Amaya-Manzanares F., Guzman-Rojas L., Kodama T., Ward J.M., Rust A.G., van der Weyden L. Analyzing tumor heterogeneity and driver genes in single myeloid leukemia cells with SBCapSeq. Nat. Biotechnol. 2016;34:962–972. - PMC - PubMed
    1. Cornils K., Thielecke L., Hüser S., Forgber M., Thomaschewski M., Kleist N., Hussein K., Riecken K., Volz T., Gerdes S. Multiplexing clonality: combining RGB marking and genetic barcoding. Nucleic Acids Res. 2014;42:e56. - PMC - PubMed

Publication types

Substances

LinkOut - more resources