. 2017 Feb 1;34(2):447-466.
doi: 10.1093/molbev/msw246.

Mitonuclear Interactions Mediate Transcriptional Responses to Hypoxia in Drosophila

Affiliations

Mitonuclear Interactions Mediate Transcriptional Responses to Hypoxia in Drosophila

Jim A Mossman et al. Mol Biol Evol. .

Abstract

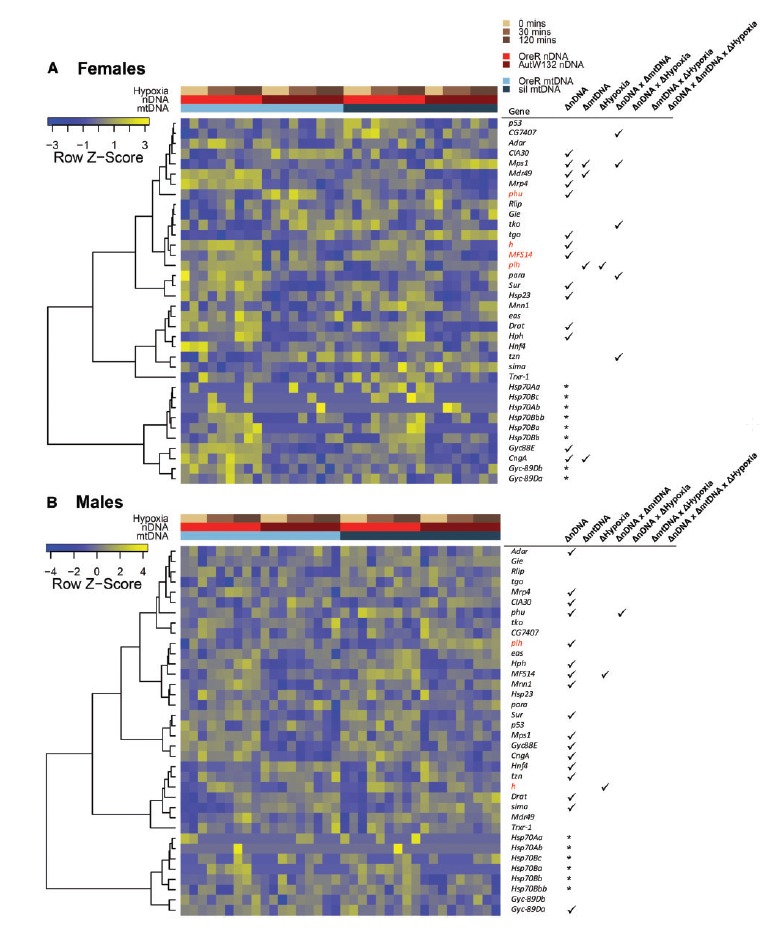
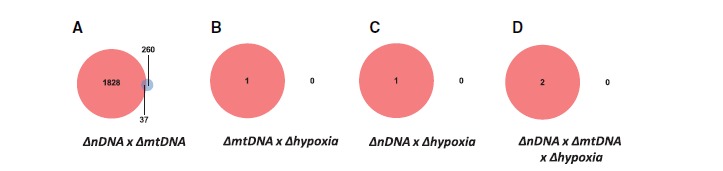
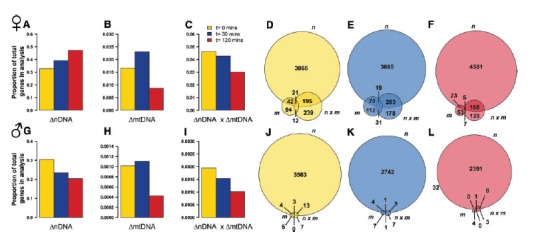
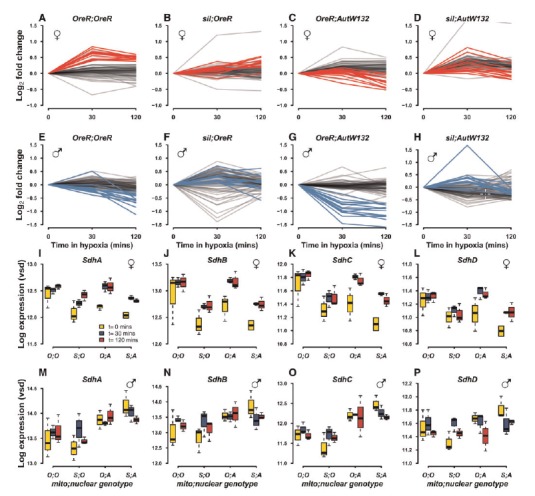
Among the major challenges in quantitative genetics and personalized medicine is to understand how gene × gene interactions (G × G: epistasis) and gene × environment interactions (G × E) underlie phenotypic variation. Here, we use the intimate relationship between mitochondria and oxygen availability to dissect the roles of nuclear DNA (nDNA) variation, mitochondrial DNA (mtDNA) variation, hypoxia, and their interactions on gene expression in Drosophila melanogaster. Mitochondria provide an important evolutionary and medical context for understanding G × G and G × E given their central role in integrating cellular signals. We hypothesized that hypoxia would alter mitonuclear communication and gene expression patterns. We show that first order nDNA, mtDNA, and hypoxia effects vary between the sexes, along with mitonuclear epistasis and G × G × E effects. Females were generally more sensitive to genetic and environmental perturbation. While dozens to hundreds of genes are altered by hypoxia in individual genotypes, we found very little overlap among mitonuclear genotypes for genes that were significantly differentially expressed as a consequence of hypoxia; excluding the gene hairy. Oxidative phosphorylation genes were among the most influenced by hypoxia and mtDNA, and exposure to hypoxia increased the signature of mtDNA effects, suggesting retrograde signaling between mtDNA and nDNA. We identified nDNA-encoded genes in the electron transport chain (succinate dehydrogenase) that exhibit female-specific mtDNA effects. Our findings have important implications for personalized medicine, the sex-specific nature of mitonuclear communication, and gene × gene coevolution under variable or changing environments.

Keywords: Drosophila; E; G ×; epistasis; hypoxia; mitonuclear; mtDNA; transcriptome.


Figures

<sc>Fig.</sc> 1.
Fig. 1.
First order genetic and hypoxia effects in females and males. Scaled Venn diagrams describe the number of differentially expressed genes by nDNA (red), mtDNA (blue) and hypoxia (green) in females (A) and males (B) at FDR < 0.1. There was some overlap between the DE gene sets and some genes were sensitive to all three genetic and hypoxia perturbations. Females were generally more sensitive to nDNA and mtDNA variation. Biplots with a heat component (females: C and males: D) show the log2-fold change in expression for nDNA (AutW132/OreR) (abscissa), mtDNA (siI/OreR) (ordinal) and hypoxia [combined 30 min and 120 min of hypoxia/0 min (control)] (heat). The heat component is the hypoxia effect and the scale is from −1 to 1. Data in grey are outside of the −1 to 1 log2-fold range but still contribute to the mtDNA–nDNA correlation reported in the main text.
<sc>Fig.</sc> 2.
Fig. 2.
Gene and library clusters of the top 70% of genes by read count. Heat maps show the clustering of libraries in females (A) and males (B) using k =70 clusters; calculated using MBCluster.Seq. The three forms of experimental variation are shown as colored bars at the top of each heat map. Browns show hypoxia treatment, reds are alternative nuclear backgrounds and blues are alternative mtDNA haplotypes. Column (library) dendrograms describe the clustering of libraries using the hierarchical clustering approach in the heatmap3 function (Zhao et al. 2014). Each row in the heatmap is a gene and these are ordered based on their cluster membership (1–70). The rows do not correspond with the same gene across sexes. The relative expression (row z-score) of each gene is scaled on a per gene basis. Relatively high expression is shown in yellow; relatively low expression is shown as blue. In females, mitonuclear genotypes are clearly differentiated by expression, whereas males show less defined genetic signal in the expression data.
<sc>Fig.</sc> 3.
Fig. 3.
First order DE and genotype signatures of hypoxia. Volcano plots show female (AH) and male (IP) differential expression responses to nDNA (A, I), mtDNA (B, J), initial hypoxia (C, K), and longer hypoxic exposure (0–120 min) (D, L). Individual (mtDNA;nDNA) genotype responses to combined hypoxic treatments are shown for OreR;OreR (E, M), siI;OreR (F, N), OreR;AutW132 (G, O) and siI;AutW132 (H, P). Log2-fold changes are on the abscissa and −log10P-values are shown in the ordinal. Horizontal dashed grey lines highlight P-value =0.05. Vertical dashed grey lines highlight ± 1 on a log2 fold scale (2 fold up- or down-regulated). Dark purple and dark blue data highlight genes with ± 1 log2 fold change and P < 0.05, in females and males, respectively.
<sc>Fig.</sc> 4.
Fig. 4.
Genotypes show both conserved (intersected) and private gene expression responses to combined hypoxia treatments. (AH) show the norms of reaction for each genotype for all upregulated genes across all genotypes, measured as the log2 fold change relative to t = 0 min in hypoxia. Females (A–D) and male (E–H) norms of reaction are shown. Red lines in A–D show the eight consistently upregulated genes across all four genotypes in females (FDR < 0.1). Black lines show the remaining genes that are differentially upregulated in at least one genotype. Genes that are upregulated in at least one genotype are often downregulated in another. Venn intersections in (I–L) show the numbers of genes that are intersected and private to individual genotypes. Female up- (I) and down-regulated (K) genes are those genes DE by combined hypoxic treatments relative to the control (0 min in hypoxia). Equivalent male plots are shown in (J) and (L). A large majority of genes were private to individual genotypes in both up- and down-regulated genes (larger numbers on margins of Venn diagrams).
<sc>Fig.</sc> 5.
Fig. 5.
Known hypoxia genes show first order genetic and environment effects, along with significant interaction effects on expression. Heatmaps show relative gene expression patterns of known hypoxia-response genes in females (A) and males (B). Heatmaps are clustered by gene expression patterns using the hierarchical clustering as implemented in the heatmap3 function (Zhao et al. 2014). Dendrograms of genes describe the gene clusters. Libraries (columns) are sorted by mitonuclear genotype and time in hypoxia. Colored bars above the heatmaps describe the experimental treatment of individual RNA-seq libraries. Tables to the right of heatmaps show the gene ID and ticks highlight if that gene was significantly DE (FDR < 0.1) by a genetic or environmental effect, and any significant interaction effect. Genes in red were significantly differentially expressed (up- or down-regulated) by hypoxia in at least one genotype. The hypoxia term in the table describes whether there was an overall significant hypoxia effect with all genotypes combined in the analysis. An asterisk means that gene was not included in the combined genotype model due to insufficient read counts.
<sc>Fig.</sc> 6.
Fig. 6.
Higher order genetic and hypoxia interactions across sexes. Venn diagrams describe the numbers of genes that were differentially expressed by a higher order interaction (FDR < 0.1). Red circles are female DE genes; blue are male. The numbers of genes that intersected between the sexes are also shown. nDNA × mtDNA significant interactions are shown in (A). mtDNA × hypoxia effects are shown in (B). There were no overlapping genes between the sexes for any of the remaining higher order interactions (B, C, D) with a strict FDR < 0.1 cut-off. nDNA × hypoxia effects (C) and nDNA × mtDNA × hypoxia (D) are shown.
<sc>Fig.</sc> 7.
Fig. 7.
Genetic effects and interactions are modified by hypoxia. Barplots in (A, B, C) show the proportion of genes in females that were differentially expressed by nDNA, mtDNA, and nDNA x mtDNA, respectively, at different hypoxia treatments: 0 min (yellow), 30 min (blue), and 120 min (red) (FDR < 0.1). Equivalent barplots for males are shown in (G, H, and I). Under 30 min of hypoxia, the signature of mtDNA variation increased in proportion in both sexes. The proportion of nDNA × mtDNA decreased with increasing time in hypoxia in both sexes. In females, the number of DE nDNA genes increased with time in hypoxia, whereas the proportion in males decreased. Venn diagrams in (D, E, and F) show the intersections between first order nDNA, mtDNA, and higher order nDNA × mtDNA interactions for females at hypoxia treatments: 0 min (yellow), 30 min (blue), and 120 min (red). The equivalent Venn diagrams for males are shown in (J, K, and L).
<sc>Fig.</sc> 8.
Fig. 8.
Oxidative phosphorylation genes encoded by mtDNA and nDNA are among the most differentially expressed by hypoxia. Norms of reaction for log2 fold change relative to hypoxia timepoint = 0 are shown for individual genotypes in females (AD) and males (EH). Red lines in (A–D) and blue lines in (E–H) show the mtDNA-encoded genes in females and males, respectively. Black lines show the remaining nDNA-encoded genes that comprise the Complexes I–IV and ATP synthetase. Boxplots in (IL: females) and (MP: males) show the expression of succinate dehydrogenase genes (SdhA, SdhB, SdhC, and SdhD) of complex II of the electron transport chain.

References

    1. Amuthan G, Biswas G, Zhang SY, Klein-Szanto A, Vijayasarathy C, Avadhani NG. 2001. Mitochondria-to-nucleus stress signaling induces phenotypic changes, tumor progression and cell invasion. EMBO J. 20:1910–1920. - PMC - PubMed
    1. Anders S, Huber W. 2010. Differential expression analysis for sequence count data. Genome Biol. 11(1): 12. - PMC - PubMed
    1. Anders S, Pyl PT, Huber W. 2015. HTSeq—a Python framework to work with high-throughput sequencing data. Bioinformatics 31:166–169. - PMC - PubMed
    1. Askie LM, Henderson-Smart DJ, Irwig L, Simpson JM. 2003. Oxygen-saturation targets and outcomes in extremely preterm infants. N Engl J Med. 349:959–967. - PubMed
    1. Ballard JWO. 2000. Comparative genomics of mitochondrial DNA in Drosophila simulans. J Mol Evol. 51:64–75. - PubMed

Publication types

Substances

LinkOut - more resources