. 2017 Jan;68(2):191-206.
doi: 10.1093/jxb/erw391. Epub 2016 Oct 19.

Photosynthesis in C3-C4 intermediate Moricandia species

Affiliations

Photosynthesis in C3-C4 intermediate Moricandia species

Urte Schlüter et al. J Exp Bot. 2017 Jan.

Abstract

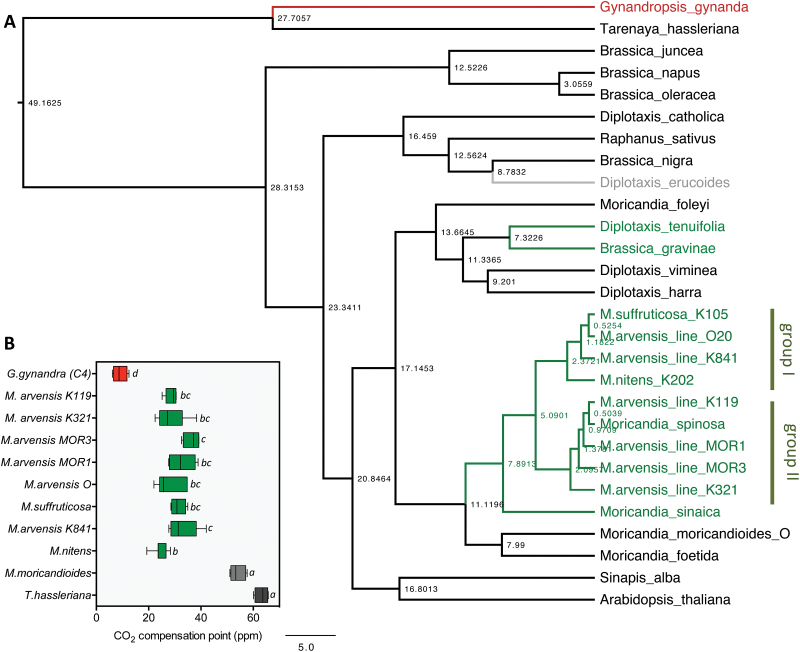
Evolution of C4 photosynthesis is not distributed evenly in the plant kingdom. Particularly interesting is the situation in the Brassicaceae, because the family contains no C4 species, but several C3-C4 intermediates, mainly in the genus Moricandia Investigation of leaf anatomy, gas exchange parameters, the metabolome, and the transcriptome of two C3-C4 intermediate Moricandia species, M. arvensis and M. suffruticosa, and their close C3 relative M. moricandioides enabled us to unravel the specific C3-C4 characteristics in these Moricandia lines. Reduced CO2 compensation points in these lines were accompanied by anatomical adjustments, such as centripetal concentration of organelles in the bundle sheath, and metabolic adjustments, such as the balancing of C and N metabolism between mesophyll and bundle sheath cells by multiple pathways. Evolution from C3 to C3-C4 intermediacy was probably facilitated first by loss of one copy of the glycine decarboxylase P-protein, followed by dominant activity of a bundle sheath-specific element in its promoter. In contrast to recent models, installation of the C3-C4 pathway was not accompanied by enhanced activity of the C4 cycle. Our results indicate that metabolic limitations connected to N metabolism or anatomical limitations connected to vein density could have constrained evolution of C4 in Moricandia.

Keywords: Moricandia.; Bundle sheath; C3–C4 intermediacy; C4 photosynthesis; evolution; glycine decarboxylase.


Figures

Fig. 1.
Fig. 1.
C3-C4 intermediate species in the Brassicaceae. (A) Time-calibrated phylogeny of the Brassicaceae species selected for this study. The Moricandia species build one branch of the tree with an early separation of the C3 species M. moricandioides and M. foetida, and the C3–C4 intermediate species M. suffruticosa, M spinosa, M. sinaica, M. nitens, and different M. arvensis lines. Additional independently established C3–C4 intermediate species are Diplotaxis tenuifolia and Brassica gravinae. The closest C4 relative G. gynandra belongs to the Cleomaceae. C3 species are in black; C3–C4 intermediate species in green, with gray for the potential intermediate D. erucoides; C4 species in red. The scale bar is 5 Ma. (B) CO2 compensation points determined from A-Ci curves in C3 and C3–C4Moricandia lines compared with C3 and C4 species from the Cleomaceae. Significant differences were determined by ANOVA followed by Tukey’s HSD multiple comparison test with alpha ≤0.01.
Fig. 2.
Fig. 2.
Physiological features in the C3 species M. moricandioides, and the C3–C4 intermediate species M. suffruticosa and M. arvensis line MOR1. (A) Representative examples of A-Ci curves from M. moricandioides, M. suffruticosa, and M. arvensis line MOR1 in comparison with the curve from the C4 species G. gynandra. (B) CO2 compensation points; (C) initial A-Ci slope; (D) assimilation rate under ambient conditions with ca of 400 ppm; (E) δ13C signature of leaf material; (F) protein content per plant dry weight; (G) PEPC activity; (H) vein density in the top part of mature leaves. All box-whisker plots show data summarised from 8–10 biological replicates. The asterisks indicate significant differences of the C3–C4 intermediate species in comparison with the C3 species M. moricandioides, as determined by a t-test (P≤0.01). Mmori, M. moricandioides; Marv, M. arvensis line MOR1; Msuff, M. suffruticosa. (This figure is available in colour at JXB online.)
Fig. 3.
Fig. 3.
Anatomy of the C3 species M. moricandioides (A, D, G, J), and the C3–C4 intermediate species M.suffruticosa (B, E, H, K) and M.arvensis line MOR1 (C, F, I, L). (A–C) Top view of cleared leaves showing the general vein pattern; (D–F) overview of cross-sections; (G–I) close-up of the arrangement of chloroplasts in the bundle sheath cells; (J–L) transmission electron microscopy of bundle sheath cells with organelles arranged next to the vein cell. Arrow heads indicate vascular bundles. BS, bundle sheath cell; Xy, xylem cell; CC, companion cell.
Fig. 4.
Fig. 4.
Selected metabolites in the C3 species M. moricandioides, and the C3–C4 intermediate species M. suffruticosa and M. arvensis line MOR1. The box-whisker plots represent summaries of 10–12 biological replicates. The asterisks indicate significant differences between the C3–C4 and the C3 species as determined by a t-test (P≤0.01). Mmori, M. moricandioides; Marv, M. arvensis line MOR1; Msuff, M. suffruticosa. (This figure is available in colour at JXB online.)
Fig. 5.
Fig. 5.
Transcriptional changes in selected pathways. The heat maps indicate the log2-fold changes in transcript level between C3–C4 species M. arvensis line MOR1 (left column) and M. suffruticosa (right column) and the C3 species M. moricandioides. Blue indicates reduced transcript abundance in C3–C4, red indicates enhanced transcript abundance in C3–C4.
Fig. 6.
Fig. 6.
Comparison of the changes in transcript levels of the Moricandia species and Flaveria species with different degrees of C4 features. The graphs show the relative amount (z-score normalised data of mean rpm values) from transcripts belonging to the selected pathways. The general trend in the transcription pattern of a pathway is indicated in red as the median of the individual transcripts values. Species abbreviations are: Mmori, M. moricandioides; Marv, M. arvensis; Msuff, M. suffruticosa; Fpri, F. pringlei; Frob, F. robusta; Fchl, F. chloraefolia; Fpub, F. pubescence; Fano, F. anomala; Fram, F. ramosissima; Fbro, F. brownii; Fbid, F. bidentis; Ftri, F. trinervia.
Fig. 7.
Fig. 7.
Phylogenetic tree of the glycine decarboxylase P-protein (GLDP) coding sequences in selected Brassicaceae. The GLDP copies from Arabidopsis thaliana are highlighted in blue, Moricandia species are in red, and Diplotaxis species are in green. Species abbreviations are: At, Arabidopsis thaliana; Alyt, Arabidopsis lyrata; Aalp, Arabis alpina; Bna, Brassica napus; Bo, B. oleraceae; Bra, B. rapa; Eutsa, Eutrema salsugineum; Thal, Thellungiella halophile; Csat, Camelina sativa; Carub, Capsella rubella; Thass, Tarenaya hassleriana; Mmori, Moricandia moricandioides; Mnit, Moricandia nitens; Marv, Moricandia arvansis line MOR1; Msuff, Moricandia suffruticosa; Dvim, Diplotaxis viminea; Dten, Diplotaxis tenuifolia; Dmur, Diplotaxis muralis). Branch support is determined by an approximate likelihood ratio test.
Fig. 8.
Fig. 8.
Model of metabolite shuttle network active between the mesophyll cells (left) and bundle sheath cells (right) of C3–C4 intermediate Moricandia species. The inactivity of the photorespiratory glycine decarboxylating complex in the mesophyll cells leads to glycine accumulation and transport to the bundle sheath. In the mitochondria of bundle sheath cells two molecules of glycine are converted by the GLD/SHMT complex to serine, CO2, NH3, and NADH. In the adjacent chloroplasts the bundle sheath Rubisco is exposed to enhanced CO2 conditions. The imbalance created by parallel release of NH3 requires further adjustment of C and N metabolism that is probably realised by a whole network of reactions, including additional shuttling of amino acids from the bundle sheath to the mesophyll (dark blue arrows), and re-shuttling of organic acids (light blue arrows). Enzymes highlighted in bold could be associated with an increased abundance of at least one transcript copy.

References

    1. Adwy W, Laxa M, Peterhansel C. 2015. A simple mechanism for the establishment of C2-specific gene expression in Brassicaceae. The Plant Journal 84, 1231–1238. - PubMed
    1. Apel P, Horstmann C, Pfeffer M. 1997. The Moricandia syndrome in species of the Brassicaceae – evolutionary aspects. Photosynthetica 33, 205–215.
    1. Arias T, Beilstein MA, Tang M, McKain MR, Pires JC. 2014. Diversification times, among Brassica (Brassicaceae) crops suggest hybrid formation after 20 million years of divergence. American Journal of Botany 101, 86–91. - PubMed
    1. Ashton AR, Burnell JN, Furbank RT, Jenkins CLD, Hatch MD. 1990. The enzymes in C4 photosynthesis. In: Lea PJ, Harborne JB, eds. Enzymes of primary metabolism. London, UK: Academic Press, 39–72.
    1. Aubry S, Brown NJ, Hibberd JM. 2011. The role of proteins in C3 plants prior to their recruitment into the C4 pathway. Journal of Experimantal Botany 62, 3049–3059. - PubMed

Publication types

Substances