. 2017 Jan 26;168(3):442-459.e20.
doi: 10.1016/j.cell.2016.12.016. Epub 2017 Jan 19.

Cooperative Binding of Transcription Factors Orchestrates Reprogramming

Affiliations

Cooperative Binding of Transcription Factors Orchestrates Reprogramming

Constantinos Chronis et al. Cell. .

Abstract

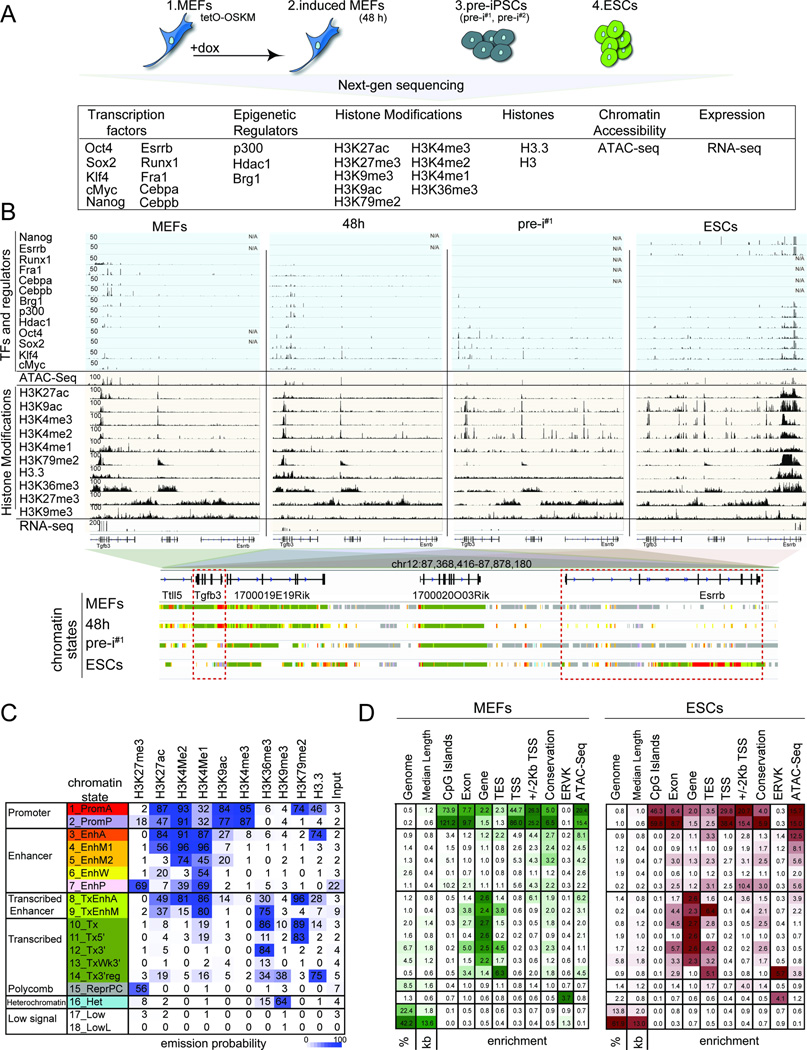
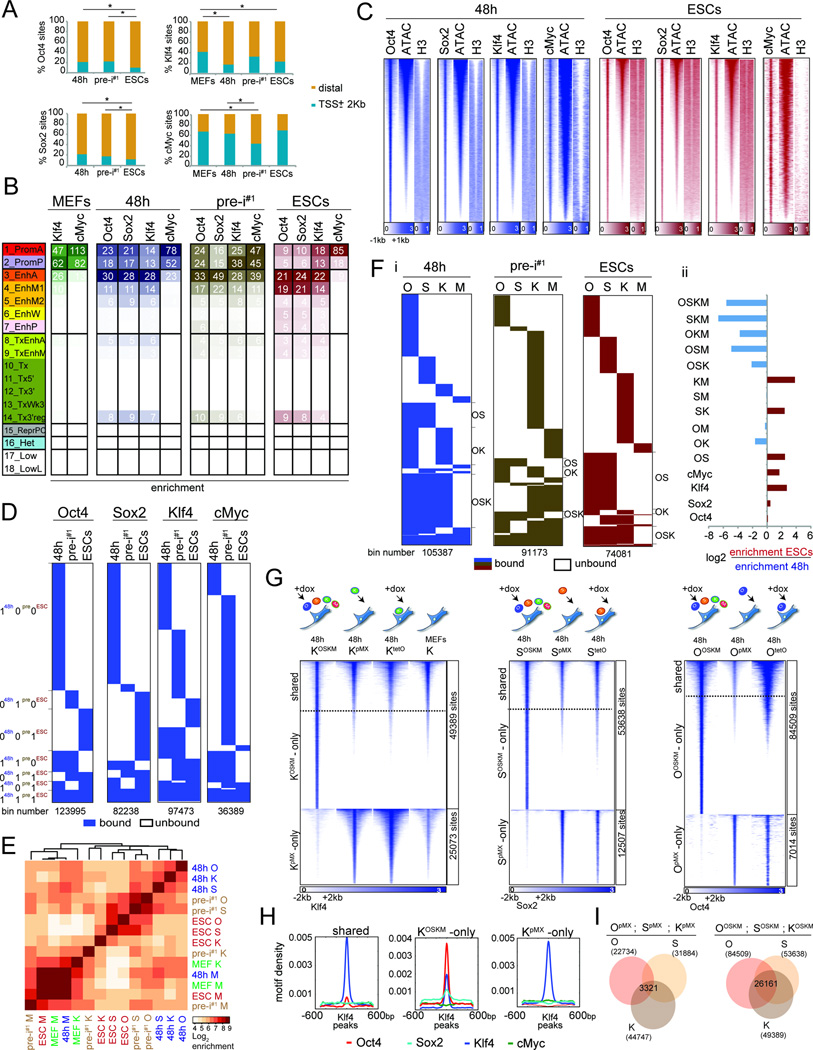
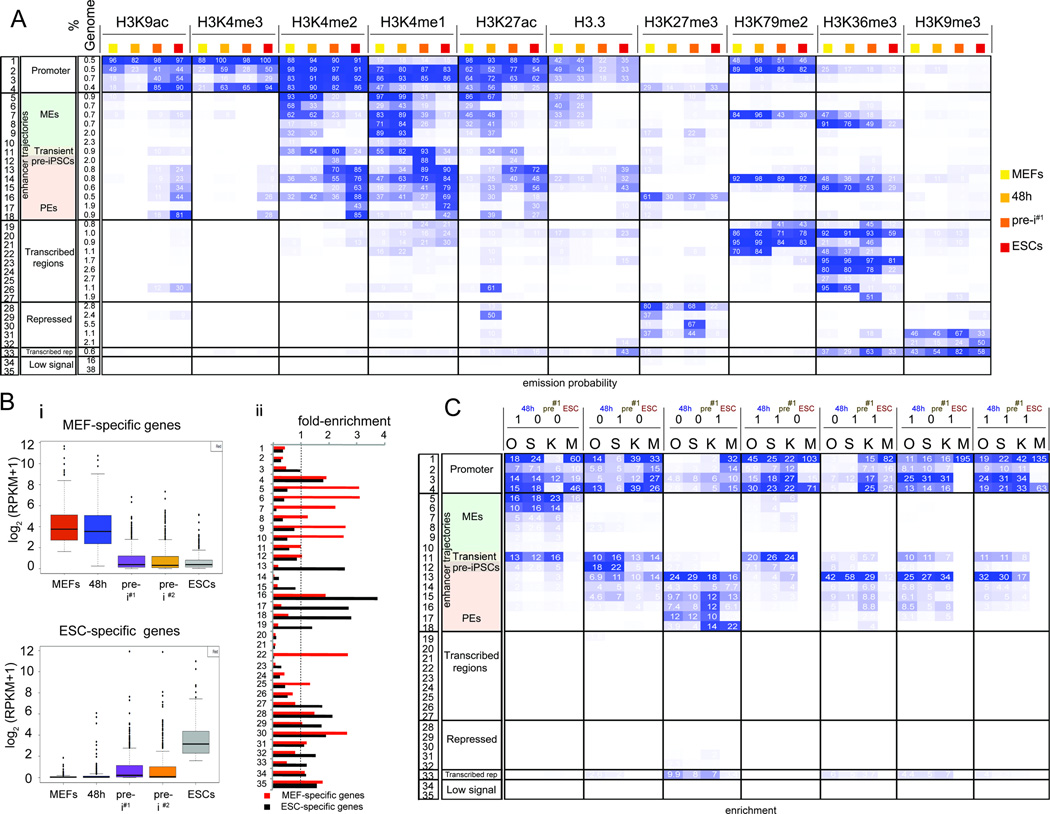
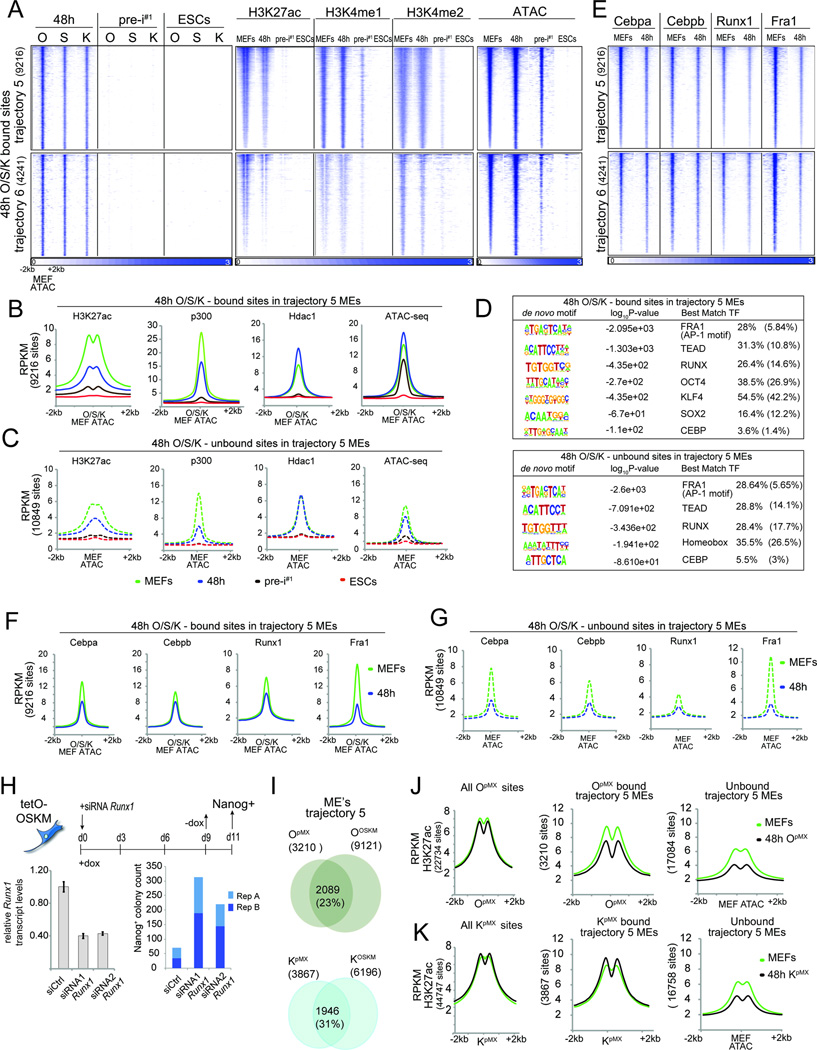
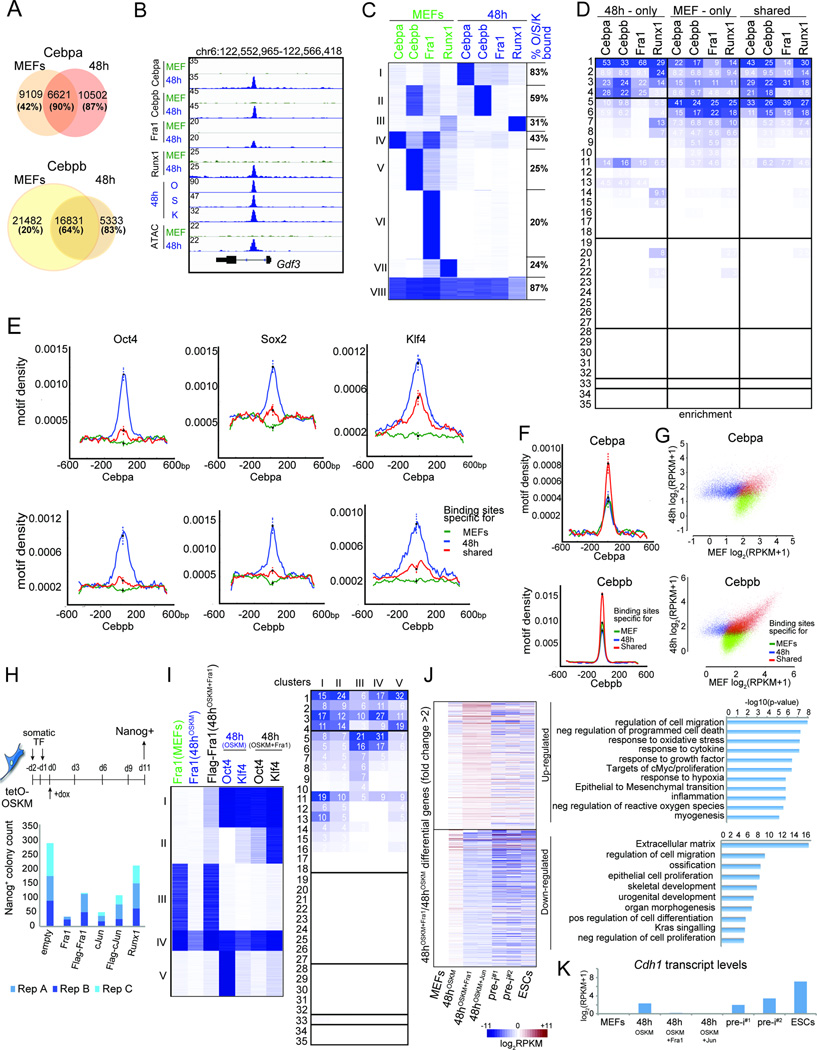
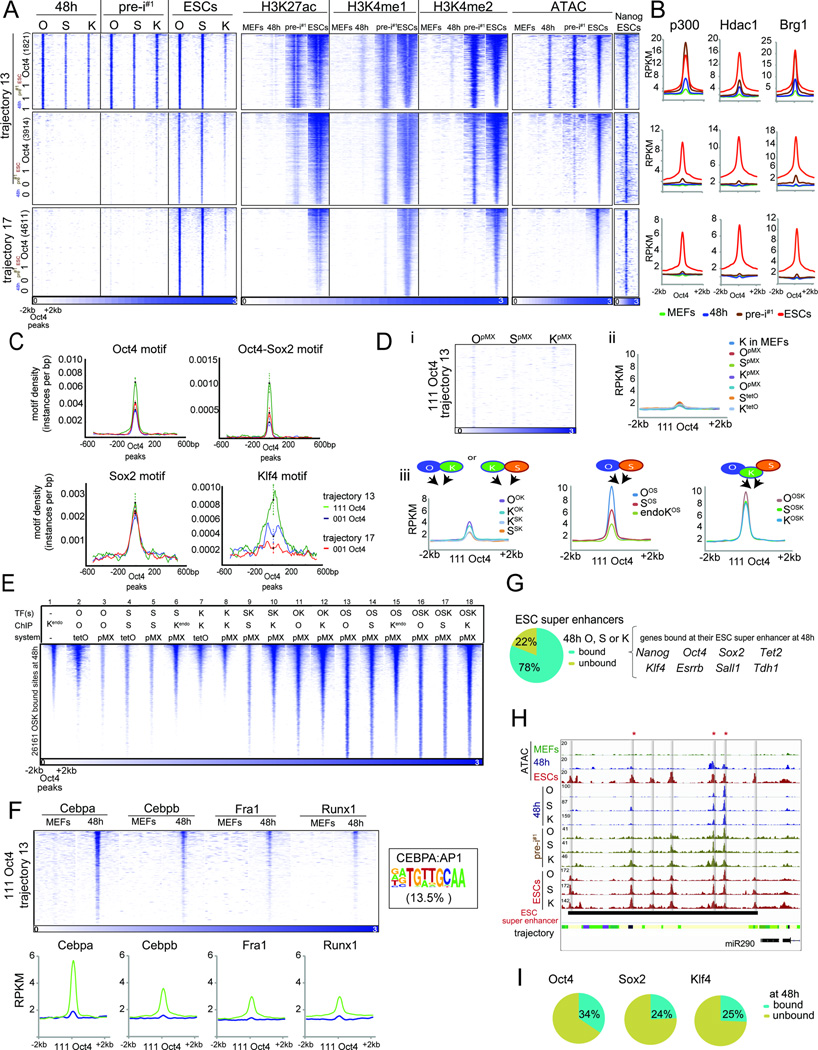
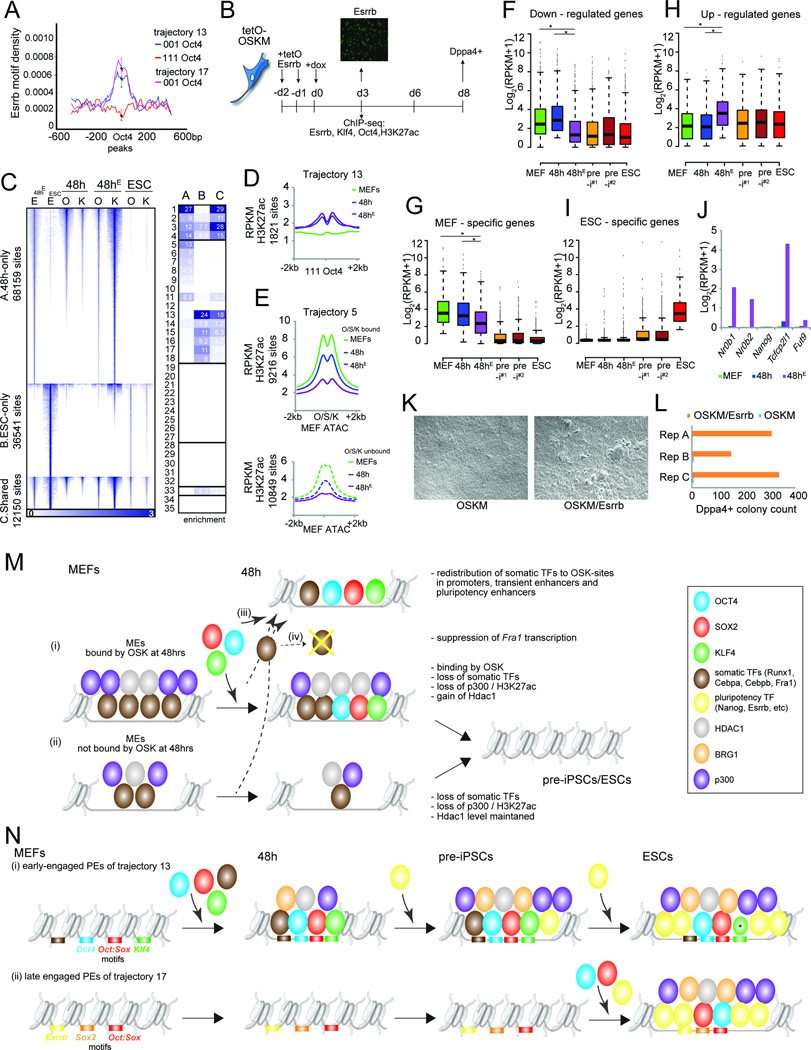
Oct4, Sox2, Klf4, and cMyc (OSKM) reprogram somatic cells to pluripotency. To gain a mechanistic understanding of their function, we mapped OSKM-binding, stage-specific transcription factors (TFs), and chromatin states in discrete reprogramming stages and performed loss- and gain-of-function experiments. We found that OSK predominantly bind active somatic enhancers early in reprogramming and immediately initiate their inactivation genome-wide by inducing the redistribution of somatic TFs away from somatic enhancers to sites elsewhere engaged by OSK, recruiting Hdac1, and repressing the somatic TF Fra1. Pluripotency enhancer selection is a stepwise process that also begins early in reprogramming through collaborative binding of OSK at sites with high OSK-motif density. Most pluripotency enhancers are selected later in the process and require OS and other pluripotency TFs. Somatic and pluripotency TFs modulate reprogramming efficiency when overexpressed by altering OSK targeting, somatic-enhancer inactivation, and pluripotency enhancer selection. Together, our data indicate that collaborative interactions among OSK and with stage-specific TFs direct both somatic-enhancer inactivation and pluripotency-enhancer selection to drive reprogramming.

Keywords: Klf4; Oct4; Sox2; collaborative binding; enhancers; induced pluripotent stem cells; pluripotency; reprogramming; transcription factors.


Figures

Figure 1
Figure 1. Reprogramming factor and epigenome maps in four reprogramming stages
A) Summary of reprogramming stages and data sets produced. B) Snapshot of indicated genomics data at a candidate genomic locus. N/A = no data. The color code represents the stage-specific chromatin states defined in (C). Red boxes mark the somatic gene Tgfb3 and the pluripotency gene Esrrb. C) Rows represent chromatin states and their representative mnemonics, color-coded and grouped based on their putative annotation. Cells show the frequency of each histone marks, H3.3, and input for each state (ChromHMM emission probabilities). D) Columns give % genome occupancy, median length in kilo bases (kb), and fold-enrichment of indicated features (transcription end sites, TES; transcription start sites, TSS; conservation phastCons elements; endogenous retrovirus K elements, ERVK) for each chromatin state described in (C) for MEFs and ESCs. Color-code per column from highest to lowest value. See also Fig S1.
Figure 2
Figure 2. Characterization of OSKM targets
A) Fraction of TF binding sites within promoter (TSS+/−2kb) and distal (>2Kb from TSS) promoter regions. *p-val < 0.0001, chi-square test. B) Fold-enrichment of TF binding sites per chromatin state (Fig 1C) in the corresponding reprogramming stage, colored per column from highest to lowest. C) Heatmap of O, S, K, and M ChIP-seq signal for 48h and ESCs peaks and corresponding signals for ATAC-seq and histone H3, ranked by ATAC-seq signal strength. D) Comparison of binding events of each reprogramming factor between 48h, pre-i#1, and ESCs (0/white=unbound, 1/blue=bound), at 500bp resolution (bin). E) Hierarchical clustering of pairwise enrichments of O, S, K, and M binding events. F) (i) Clustering of O, S, K, and M binding events at 500bp resolution (bin). OS, OK, and OSK co-binding events are marked. (ii) Differential enrichments of co-binding groups between ESCs and 48h. G) Heatmaps of ChIP-seq signal for K, S, or O peaks at 48h of OSKM or individual reprogramming factor expression (retrovirally (pMX) or inducibly (tetO)). Peaks were grouped based on presence/absence of peak calls comparing the OSKM and single TF expressing (pMX) samples. For K, binding events in MEFs were also plotted. H) Density plots of O, S, M, and K motifs in sets of K peaks defined in (G). I) Overlap of O, S, and K sites (number given) obtained from MEFs individually expressing O, S, and K for 48h (pMX, left) and MEFs co-expressing OSKM for 48h (right). See also Fig S2/3.
Figure 3
Figure 3. OSK redistribution mirrors enhancer reorganization
A) Definition of the 35 chromatin trajectories that capture the major chromatin changes during reprogramming. The first three columns give the number, functional annotation, and genome fraction of each trajectory. Following columns are organized by histone mark and sub-ordered by reprogramming stage displaying the frequency of each mark per reprogramming stage and trajectory, colored from 0 (white) to 100 (blue). B) (i) Boxplots of expression levels of MEF- and ESC-specific genes per reprogramming stage. (ii) Relative enrichment of each trajectory defined in (A) within +/− 20kb of the TSS of MEF- and ESC-specific genes compared to +/− 20kb of the TSS of all active genes. Values above the dashed line indicate higher enrichment in MEF- and ESC-specific genes, respectively. C) Fold-enrichment of stage-specific and constitutive O, S, K, and M binding events defined in Fig 2D for each trajectory in (A), colored per column from highest to lowest. See also Fig S4.
Figure 4
Figure 4. ME silencing is initiated genome-wide early in reprogramming
A) Heatmaps of O, S, K, H3K27ac, and H3K4me1/2 ChIP-seq signal and the ATAC-seq signal at O, S, and K binding events in tr. 5 and 6 MEs at 48h, ordered by the ATAC-seq signal strength. The total number of peaks is given in brackets. B) Metaplots of signal intensities for H3K27ac, p300, Hdac1, and ATAC-seq data in MEFs, 48h, pre-i#1, and ESCs at tr. 5 MEs occupied by O, S, or K at 48h, centered on ATAC-seq summits in MEFs. C) As in (B), except for tr. 5 MEs not bound by O, S, or K at 48h. D) De novo motifs identified under 48h O, S, or K- bound or unbound tr. 5 MEs. Last column: observed and expected motif frequencies (in parentheses). E) Heatmaps of somatic TF ChIP-seq signal at sites defined in (A). F) As in (B), except for somatic TFs in MEFs and at 48h. G) As in (C), except for somatic TFs in MEFs and at 48h. H) Schematic of the reprogramming experiment with Runx1 knockdown. Runx1 transcript levels were determined at 48h (error bars represent standard deviation) and Nanog-positive colonies were counted from two technical replicates (A, B). I) Comparison of O or K binding events at tr. 5 MEs in MEFs individually expressing the respective reprogramming factor (OpMX or KpMX) and MEFs co-expressing OSKM for 48h (OOSKM or KOSKM). Number of sites is given in brackets. J) Metaplots of signal densities for H3K27ac in starting MEFs and MEFs expressing only O for 48h (OpMX) at all OpMX bound sites and tr. 5 MEs bound or unbound by OpMX at 48h. K) As in (J), but for KpMX. See also Fig S5.
Figure 5
Figure 5. Somatic TF redistribution early in reprogramming
A) Intersection of Cebpa or Cebpb binding sites between MEFs and 48h. The fraction of sites also bound by O, S, or K is given in brackets for each group. B) Genome browser view at the Gdf3 locus of OSK, somatic TF binding and ATAC-seq data in MEFs and at 48h. C) K-means clustering of somatic TF binding events in MEFs and at 48h. The fraction of sites in each cluster also bound by O, S, or K is provided on the right. D) Fold-enrichment of MEF-only, 48h-only, and shared binding sites of somatic TFs from (A) in chromatin trajectories defined in Fig 3A, colored per column from highest to lowest. E) Density of O, S, or K motifs at MEF-only, 48h-only, and shared Cebpa (top) and Cebpb (bottom) sites from (A). Error bars = 95% confidence interval at summits. F) As in (E), but for Cebpa (top) and Cebpb (bottom) motifs. G) MEF and 48h input-normalized ChIP-seq signal for MEF-only, 48h-only, and shared binding events of Cebpa and Cebpb from (A). H) Schematic of the reprogramming experiment with retroviral overexpression of somatic TFs. Nanog-positive colony counts from three biological replicates are shown. I) K-means clustering of Fra1 peaks in MEFs and Fra1, O and K peaks at 48h of OSKM or OSKM+Fra1 co-expression. Right: Fold-enrichments of each cluster on the left in chromatin trajectories defined in Fig 3A, colored per column from highest to lowest. J) Heatmap of differential gene expression between reprogramming stages indicated at the bottom and MEFs, for genes with 2-fold differentially expressed between 48hOSKM+Fra1 and 48hOSKM. Right: GO ontologies of these genes. K) E-cadherin (Cdh1) transcript levels for indicated samples based on RNA-seq data. See also Fig S6.
Figure 6
Figure 6. Step-wise selection of PEs and OSK requirement
A) Heatmaps of O, S, K, H3K27ac, H3K4me1/2, and Nanog ChIP-seq signal and ATAC-seq data in indicated reprogramming stages at ‘111’ or ‘001’ Oct4 binding sites within tr. 13 and 17 PEs, sorted by ESC ATAC-seq signal intensity. Number of peaks in each set is given in brackets. B) Metaplots of signal intensities of p300, Hdac1 and Brg1 for sites in (A). C) Motif density for sites in (A), with 95% confidence interval at the summits. D) (i) Heatmaps of O, S, and K ChIP-Seq signal at ‘111’ Oct4 sites in tr. 13 PEs, in MEFs individually expressing O, S, or K for 48h. (ii) Metaplots of signal intensities of the indicated reprogramming factor individually expressed (pMX or tetO) in MEFs for 48h and of Klf4 in MEFs in tr. 13 ‘111’ Oct4 sites. (iii) As in (ii), except for MEFs expressing OK, SK, OS, or OSK for 48h. Binding of endogenous K in OS-expressing MEFs is also given. E) Heatmap of ChIP-seq signal for the factor indicated by ‘ChIP’, in MEFs ectopically expressing one or combinations of reprogramming factor(s) for 48h (‘TF’) using retroviral (pMX) or inducible (tetO) expression (‘system’), for sites co-bound by OSK at 48h of OSKM-induced reprogramming, sorted by Klf4 signal in MEFs. Kendo refers to targets of endogenously expressed K. F) As in (D), except for binding of somatic TFs in MEFs and at 48h. The given CEBPA:AP1 composite motif was identified in 13.5% of tr. 13 ‘111’ Oct4 sites. G) Fraction of ESC super enhancers occupied by O, S or K at 48h and associated genes. H) Genome browser view of OSK ChIP-seq, ATAC-seq data and chromatin trajectories (color-coded as in Fig S4A) at the mir290 ESC super enhancer. Grey bars indicate seven sub-elements engaged by OSK in ESCs and the asterisks mark those bound at 48h. I) Fraction of ESC-bound O, S or K locations within ESC super enhancers engaged by the respective TF at 48h. See also Fig S7.
Figure 7
Figure 7. Control of ME decommissioning and PE selection by Esrrb
A) Esrrb motif density in ‘111’ and ‘001’ Oct4 peaks in tr. 13 and 17 PEs. Error bars = 95% confidence interval at summits. B) Schematic of the reprogramming experiment with lentiviral overexpression of Esrrb (tetOEsrrb). Image: Esrrb expression was confirmed by immunostaining at day 3. C) Heatmap of Esrrb (E) ChIP-seq signal for Esrrb peaks identified in ESCs and at 48h of coexpression of OSKM and Esrrb (48hE). Peaks were divided into three groups (A-C) based on their reprogramming stage specificity. The O and K signal at 48h of OSKM (48h) or OSKM/Esrrb expression (48hE) and in ESCs for the same sites are also shown. Right: Fold-enrichments of sites in sets A-C in chromatin trajectories defined in Fig 3A, colored per column from highest to lowest. D) Metaplot of signal intensity of H3K27ac at ‘111’ Oct4 sites in tr. 13 PEs for MEFs, 48h and 48hE (OSKM/Esrrb). E) As in (D), except for OSK-bound and unbound tr. 5 MEs, centered on ATAC-seq summits in MEFs. F) Boxplots of expression levels of genes down-regulated at 48h of reprogramming with OSKM/Esrrb (48hE) relative to OSKM alone (48h). Asterisks mark any significant differences between MEFs, 48h, and 48hE samples (Wilcoxon test, adj. p-val<0.05). G) As in (F), for MEF-specific genes. H) As in (F), for up-regulated genes. I) As in (F), for ESC-specific genes. J) Expression of pluripotency genes known to be regulated by Esrrb. K) Bright-field image at day 6 of reprogramming with OSKM or OSKM/Esrrb. L) Count of DPPA4-positive colonies at day 8 of OSKM or OSKM/Esrrb expression, from three biological replicates. M) Model for the functions of OSK at MEs. N) Model for the functions of OSK at PEs. Asterisk indicates reduced K binding in ESCs. See also Fig S7.

References

    1. Anders S, Huber W. Differential expression analysis for sequence count data. Genome Biol. 2010;11:R106. - PMC - PubMed
    1. Anders S, Pyl PT, Huber W. HTSeq--a Python framework to work with high-throughput sequencing data. Bioinformatics. 2015;31:166–169. - PMC - PubMed
    1. Bar-Joseph Z, Gifford DK, Jaakkola TS. Fast optimal leaf ordering for hierarchical clustering. Bioinformatics. 2001;17(Suppl 1):S22–S29. - PubMed
    1. Beard C, Hochedlinger K, Plath K, Wutz A, Jaenisch R. Efficient method to generate single-copy transgenic mice by site-specific integration in embryonic stem cells. Genesis. 2006;44:23–28. - PubMed
    1. Buenrostro JD, Giresi PG, Zaba LC, Chang HY, Greenleaf WJ. Transposition of native chromatin for fast and sensitive epigenomic profiling of open chromatin, DNA-binding proteins and nucleosome position. Nat Methods. 2013;10:1213–1218. - PMC - PubMed

MeSH terms