. 2017 Jan 26;168(3):527-541.e29.
doi: 10.1016/j.cell.2016.12.029. Epub 2017 Jan 19.

Ligand and Target Discovery by Fragment-Based Screening in Human Cells

Affiliations

Ligand and Target Discovery by Fragment-Based Screening in Human Cells

Christopher G Parker et al. Cell. .

Abstract

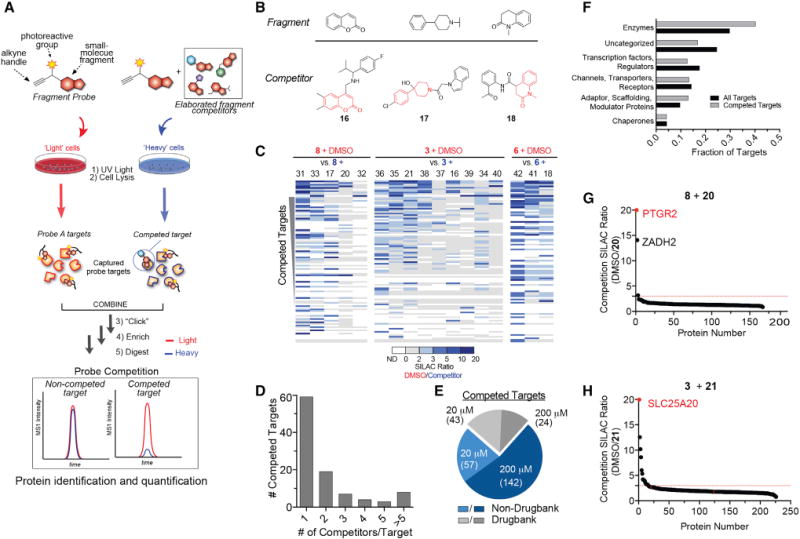
Advances in the synthesis and screening of small-molecule libraries have accelerated the discovery of chemical probes for studying biological processes. Still, only a small fraction of the human proteome has chemical ligands. Here, we describe a platform that marries fragment-based ligand discovery with quantitative chemical proteomics to map thousands of reversible small molecule-protein interactions directly in human cells, many of which can be site-specifically determined. We show that fragment hits can be advanced to furnish selective ligands that affect the activity of proteins heretofore lacking chemical probes. We further combine fragment-based chemical proteomics with phenotypic screening to identify small molecules that promote adipocyte differentiation by engaging the poorly characterized membrane protein PGRMC2. Fragment-based screening in human cells thus provides an extensive proteome-wide map of protein ligandability and facilitates the coordinated discovery of bioactive small molecules and their molecular targets.

Keywords: FBLD; PGRMC2; adipogenesis; chemical probes; chemical proteomics; fragment-based ligand discovery; ligands; mass spectrometry; phenotypic screening; photoreactivity.


Figures

Figure 1
Figure 1. A Chemical Proteomic Strategy for Mapping Fragment-Protein Interactions in Cells
(A) Schematic depiction of fully functionalized fragment (FFF) probes and experimental workflow to identify FFF-protein interactions in cells by quantitative MS-based proteomics (see STAR Methods for more details). (B) Structures of FFF probes. Shown in red and blue are the “constant” (containing the diazirine photoreactive group and clickable alkyne handle) and “variable” (consisting of small-molecule fragments; enclosed in box) regions of probes, respectively. (C) FFF probe-protein interactions in cells. HEK293T cells were treated with probes (20 μM) for 30 min, followed by photocrosslinking and analysis as described in Figure S1A. Red asterisks mark representative distinct probe-protein interactions. See Figure S1B for additional profiles of FFF probe-protein interactions.
Figure 2
Figure 2. Quantitative MS-Based Proteomic Analysis of Fragment-Protein Interactions in Cells
(A) Heatmap showing relative protein enrichment values of FFF probes (200 μM) versus control 1 in HEK293T cells. (B) Representative SILAC ratio plot of proteins differentially enriched in probe-versus-probe (13 versus 3) experiments in HEK293T cells. Proteins preferentially enriched (>3-fold by either probe, depicted with dashed lines) in 13 versus 3 experiments that were also preferentially enriched (>2-fold) by 13 or 3 in probe-versus-control 1 experiments are depicted in red and blue, respectively. Proteins not enriched by either probe are shown in black. (C) Most proteins demonstrating preferential enrichment (>3-fold) in probe-versus-probe experiments show corresponding preferential enrichment by the same probe in probe-versus-1 experiments. Gray portions of results in (B) and (C) mark proteins that were strongly enriched by both probes in probe-versus-control 1 experiments. (D–F) Heatmaps (D and E) and extracted MS1 chromatograms of representative tryptic peptides (F) for example proteins preferentially enriched by one FFF probe over control 1 (D) and the corresponding results for these proteins in probe-versus-probe experiments (E). (G) The majority of proteins that are strongly enriched (SILAC ratio >10) by most FFF probes (eight or more of 11) in probe-versus-control 1 experiments show preferential enrichment by one FFF probe in probe-versus-probe experiments. (H–J) Heatmaps (H and I) and extracted MS1 chromatograms of representative tryptic peptides (J) for example proteins enriched by many FFF probes over control 1 (H) and preferentially enriched by FFF probe 3 in probe-versus-probe experiments (I). See also Figure S2 and Table S1.
Figure 3
Figure 3. Types of Proteins and Protein Sites Targeted by FFF Probes
(A and B) Categorization of FFF probe targets based on presence or absence in DrugBank (A) and protein class distribution (B). (C) Number of FFF probe-modified peptides per protein target. (D) Distribution of probe-modified peptides that overlap with residues in predicted binding pockets of proteins as determined by fpocket analysis. (E–G) Examples of probe labeling sites mapped onto protein structures. Tryptic peptides containing probe-labeled sites are shown in green, and residues that overlap with predicted binding pockets are shown in beige. (E) FFF 13-modified peptide (aa 197–215) in human YWHAE (gray, PDB 3UBW) overlaps with the binding cleft that interacts with MLF1 (MLF1-derived peptide shown in yellow). This pocket is also the target of fragment (3S)-pyrrolindin-3-ol (Molzan et al., 2012) shown in purple. (F) FFF 13-modified peptide (aa 66–79) in human BAX (gray, PDB 4ZIE) complexed with BH3 peptide of BIM (cyan). (G) Ribbon structure of human CTSB (gray, PDB 1GMY) highlighting FFF 9-modified peptide (aa 315–332) that is competed by the CTSB inhibitor Z-FA-FMK. Yellow marks the catalytic cysteine C108 (red) bound to Z-FA-FMK. See also Figure S3 and Table S2.
Figure 4
Figure 4. Competitive Profiling with Elaborated Fragment-Based Compounds
(A) Schematic for competitive profiling experiments (see STAR Methods for more details). (B) Structure of fragment cores (upper) with representative elaborated competitors (lower, where core fragments are depicted in red). (C and D) Heatmap of (C) and number of competitor compounds per (D) competed protein targets in experiments using 20 μM FFF and 160 μM competitor. (E) Categorization of competed targets based on presence or absence in DrugBank for experiments using either 20 or 200 μM FFF probes (+FFF probes (with 8× an 1× competitors, respectively). Targets competed in both 20 and 200 μM datasets were excluded from the 200 μM groups for the pie chart analysis. (F) Protein functional class distribution for competed targets compared to all FFF probe targets. (G and H) Representative SILAC ratio plots for competitive profiling experiments with FFF probes 8 (G) and 3 (H) (20 μM) and 8× competitors 20 and 21, respectively. Red lines mark a 3-fold ratio change threshold for designating competed targets. See also Figure S3 and Table S4.
Figure 5
Figure 5. Fragment-Derived Ligands Disrupt Function of PTGR2 and SLC25A20 in Human Cells
(A) Structure of PTGR2 (PDB 2ZB4, gray) highlighting FFF 8-modified tryptic peptides (aa 55–66, green; and aa 261–278, pink) competed by 20 (MS1 plot insets). 15-keto-PGE2 in yellow; NADP+ in blue. (B) PTGR2 ligands 22 (blue) and 20 (red) but not inactive control 23 (black), inhibited 15-keto-PGE2 reductase activity of recombinant PTGR2. Data represent average values ± SD; n = 3 per group. (C) Structures (top) of initial PTGR2 ligand 20, optimized ligand 22, and inactive analog 23 and gels (bottom) showing concentration-dependent competitor blockade of FFF 8 labeling of recombinant PTGR2 in HEK29T cells. (D) Compound 22, but not inactive control 23, increased 15-keto-PGE2-dependent PPARγ transcriptional activity in PTGR2-transfected HEK293T cells. Data represent average values ± SD; ####p < 0.0001 for 15k-PGE2-treated PTGR2-transfected cells (blue bars) versus empty vector group (gray bar), ****p < 0.0001 for compound- versus DMSO-treated groups; n = 3 per group. (E) Structures (top) and activities (bottom gels) of SLC25A20 ligand 21 and inactive analog 24. Gel (bottom) showing concentration-dependent competitor blockade of FFF 3 labeling (20 μM) of recombinant SLC25A20 in HEK29T cells. (F and G) Compound 21, but not 24, increases long-chain (>C14) acylcarnitine content (F) and reduces maximal exogenous fatty acid oxidation (G) of HSC-5 cells. Data represent average values ± SD; **p < 0.01 and ****p < 0.0001 for compound- versus DMSO-treated groups; n = 3–5 per group. See also Figure S5 and Table S4.
Figure 6
Figure 6. Phenotypic Screening Identifies FFF Probes with Pro-Adipogenic Activity
(A) FFF probe 25 and competitor 27, but not inactive controls 26 and 28–30, promote 3T3-L1 preadipocyte differentiation. Cells were induced to differentiate into adipocytes 2 days post-confluence in the presence of vehicle (DMSO), compounds (10 μM), or the positive control rosiglitazone (2 μM), and lipid accumulation and adipocyte differentiation were evaluated on day 8 using the fluorescent dye Nile red (red). Hoechst (blue) was used to stain nuclei. Scale bar, 100 μm. (B) Structures of active (25) and inactive (26) probes and corresponding competitors (27 and 28–30, respectively). (C and D) Compounds 25 (C and D) and 27 (D), but not 26 or 28–30 (D), induce adipocyte differentiation-related gene expression in 3T3-L1 cells and additional preadipocyte cells (evaluated for 25) and hMSCs (human mesenchymal stem cells). (E) The pro-adipogenic activity of 25 (10 μM) was observed in 3T3-L1 preadipocytes if added on days 0–8 or 2–8, but not on days 4–8 of differentiation. For (C)–(E), data represent average values ± SD; *p < 0.05, **p < 0.01, ***p < 0.001 for compound- versus DMSO-treated groups; n = 3 per group. See also Figure S6 and Tables S4 and S7.
Figure 7
Figure 7. PGRMC2 as a Target of Pro-Adipogenic Compound 25
(A) Plot comparing SILAC ratios for protein targets of 25 in 3T3-L1 cells. y axis shows SILAC ratios for proteins enriched from cells treated with active (25) or inactive (26) FFF probes (10 μM). × axis shows SILAC ratios for proteins competed in cells treated with active FFF probe 25 (10 μM) and DMSO or the active competitor 27 (100 μM). Dotted lines indicate threshold for proteins to be designated as preferentially enriched by 25 (horizontal line) or competed by 27 (vertical line). Proteins highlighted in blue and red represent targets that were competed or not competed, respectively, by inactive control compounds 28–30 (see Figure S7A). Ratios are presented as median values derived from three independent biological experiments. (B) MS1 chromatograms for representative tryptic peptides from PGRMC2 in the designated experiments. (C) UV-dependent labeling of recombinant human PGRMC2 expressed in HEK293T cells by FFF probe 25 was blocked by 27, but not 28. PGRMC2 was not substantially labeled by inactive FFF probe 26. (D) The 25-modified tryptic peptide (aa 167–184) in human PGRMC2 is part of the cytochrome-b5-like/steroid binding domain. (E) PGRMC2 is required for the pro-adipogenic effect of 25. Mouse 3T3-L1 preadipocytes infected with lentiviruses expressing shRNA against mouse PGRMC2 were induced to differentiate in presence of vehicle, 25 (10 μM), or rosiglitazone (2 μM). Expression of an shRNA-resistant human PGRMC2 in mPGRMC2-depleted cells restored the pro-adipogenic effect of 25 in 3T3-L1 cells. (F) Expression of adipocyte markers in GFP- and hPGRMC2-overexpressing 3T3-L1 preadipocytes induced to differentiate for 8 days. (G and H) Heatmap showing top pathways altered in differentiating PGRMC2- versus GFP-expressing 3T3-L1 preadipocytes induced to differentiate for 1 day (G) and NR1D1 expression in these cells (H) (also see Table S6). (I and J) The NR1D1 antagonist SR8278 (10 μM), but not the NR1D1 agonist GSK4112 (10 μM) blocks the pro-adipogenic effect of 25 (10 μM) as measured by Nile Red staining (J) or adipogenic gene expression (I). For (F), (H), and (I), data represent average values ± SD, n = 3 per group.; for (F), *p < 0.05 for PGRMC2 versus GFP; for (H) and (I), ***p < 0.001 for compound-versus DMSO-treated groups, ###p < 0.001 for compound-versus-control groups. See also Figure S7 and Tables S4, S5, S6, and S7.

Comment in

  • Ligandable proteome mapping.
    Singh A. Singh A. Nat Methods. 2019 Dec;16(12):1204. doi: 10.1038/s41592-019-0673-7. Nat Methods. 2019. PMID: 31780831 No abstract available.

References

    1. Backus KM, Correia BE, Lum KM, Forli S, Horning BD, González-Páez GE, Chatterjee S, Lanning BR, Teijaro JR, Olson AJ, et al. Proteome-wide covalent ligand discovery in native biological systems. Nature. 2016;534:570–574. - PMC - PubMed
    1. Bembenek SD, Tounge BA, Reynolds CH. Ligand efficiency and fragment-based drug discovery. Drug Discov. Today. 2009;14:278–283. - PubMed
    1. Brückl T, Baxter RD, Ishihara Y, Baran PS. Innate and guided C-H functionalization logic. Acc Chem Res. 2012;45:826–839. - PMC - PubMed
    1. Cahill MA. Progesterone receptor membrane component 1: An integrative review. J Steroid Biochem Mol Biol. 2007;105:16–36. - PubMed
    1. Chen JJ, London IM. Hemin enhances the differentiation of mouse 3T3 cells to adipocytes. Cell. 1981;26:117–122. - PubMed

Publication types