. 2017 Feb 8;93(3):560-573.e6.
doi: 10.1016/j.neuron.2016.12.017. Epub 2017 Jan 19.

Role of Mitochondrial Metabolism in the Control of Early Lineage Progression and Aging Phenotypes in Adult Hippocampal Neurogenesis

Affiliations

Role of Mitochondrial Metabolism in the Control of Early Lineage Progression and Aging Phenotypes in Adult Hippocampal Neurogenesis

Ruth Beckervordersandforth et al. Neuron. .

Erratum in

Abstract

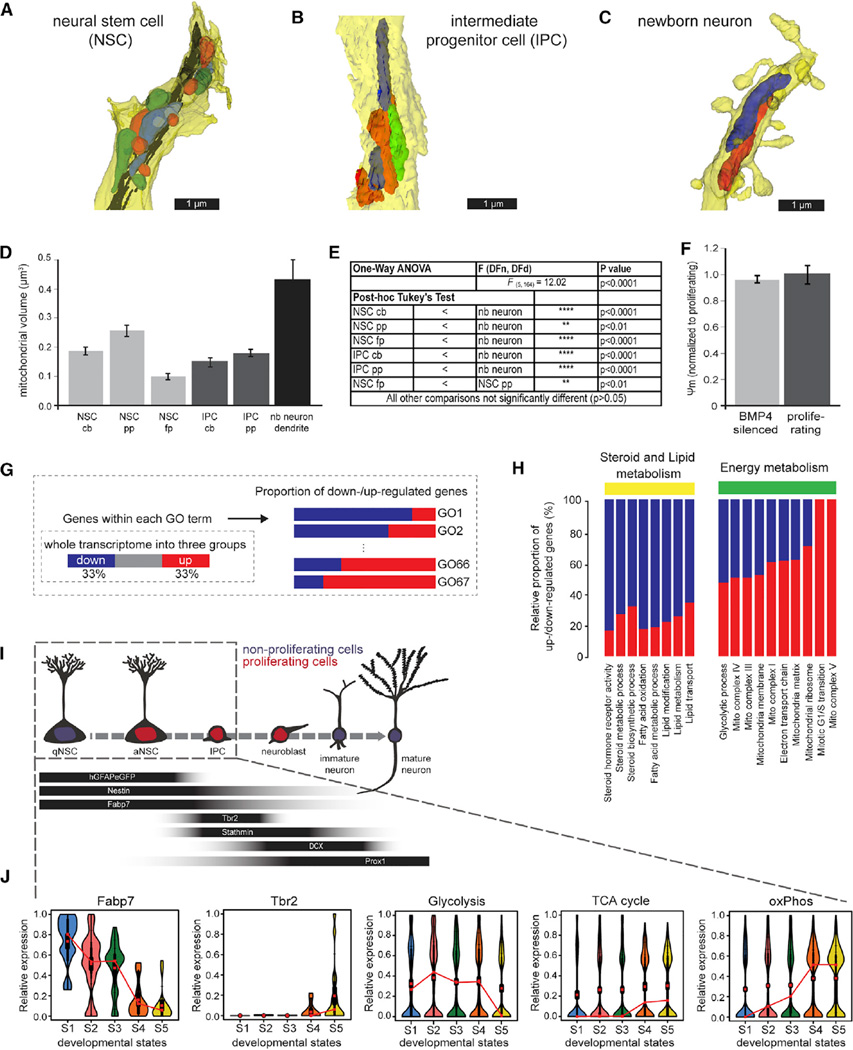
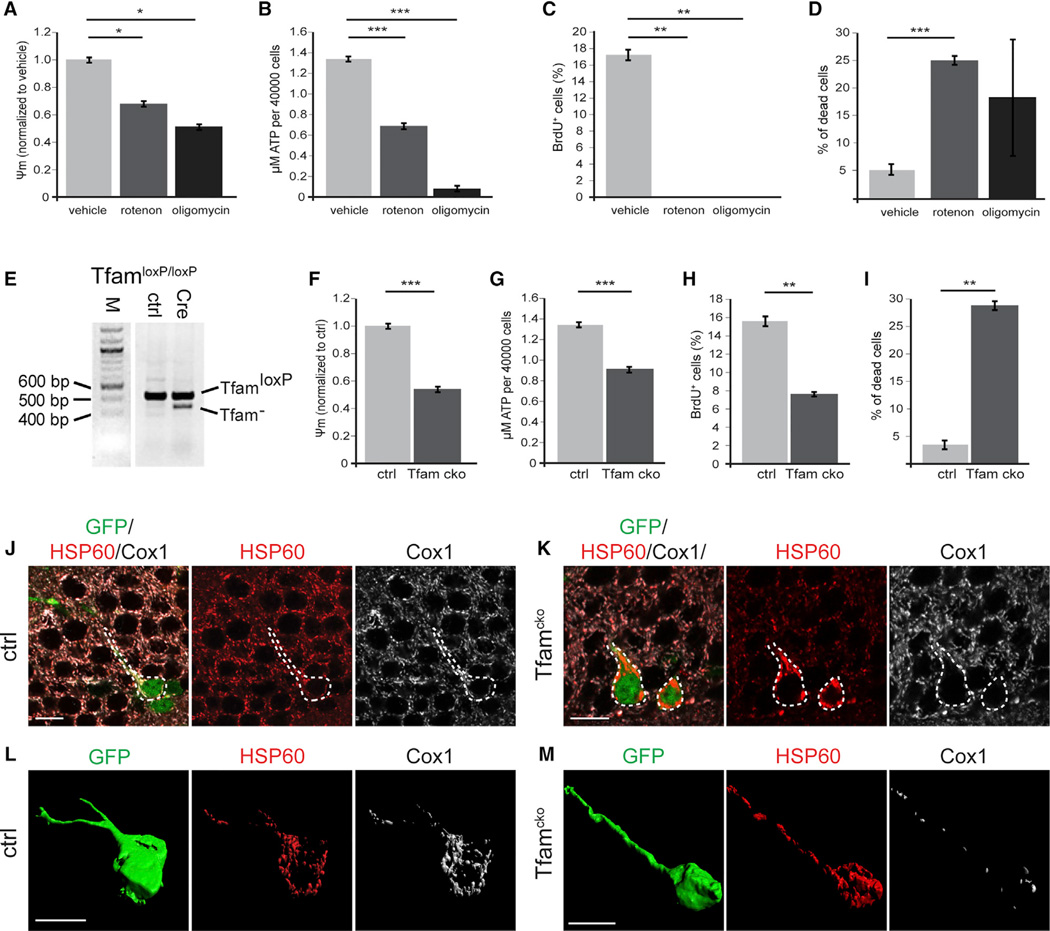
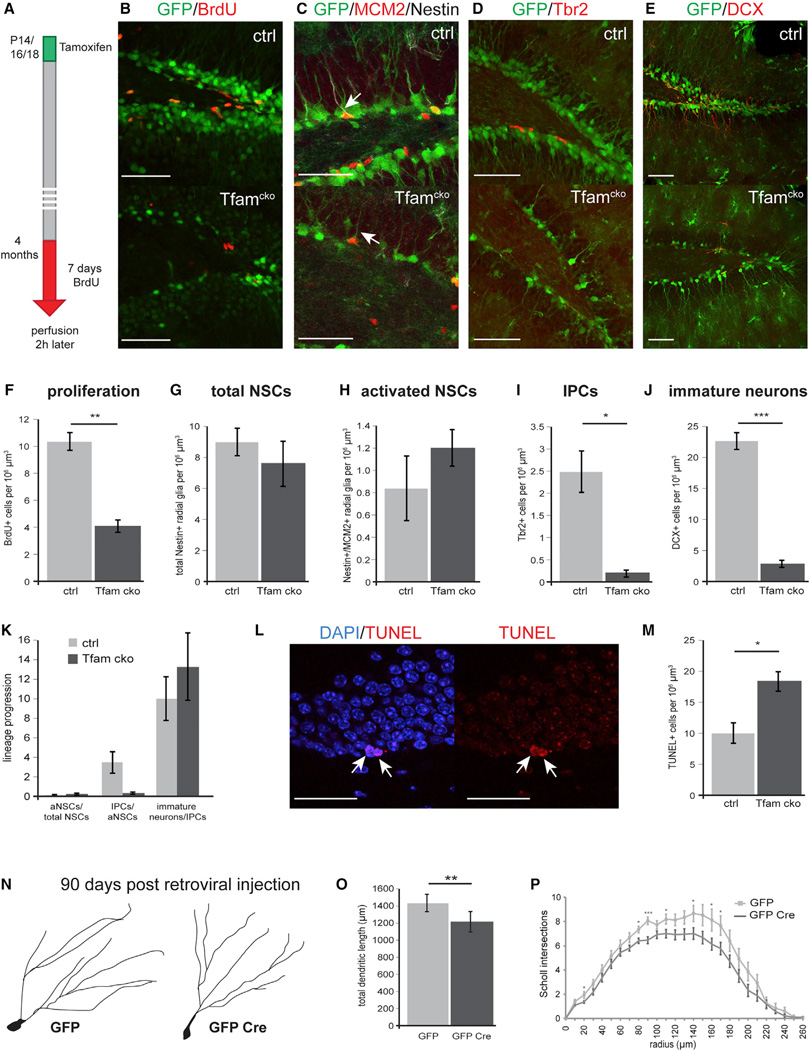
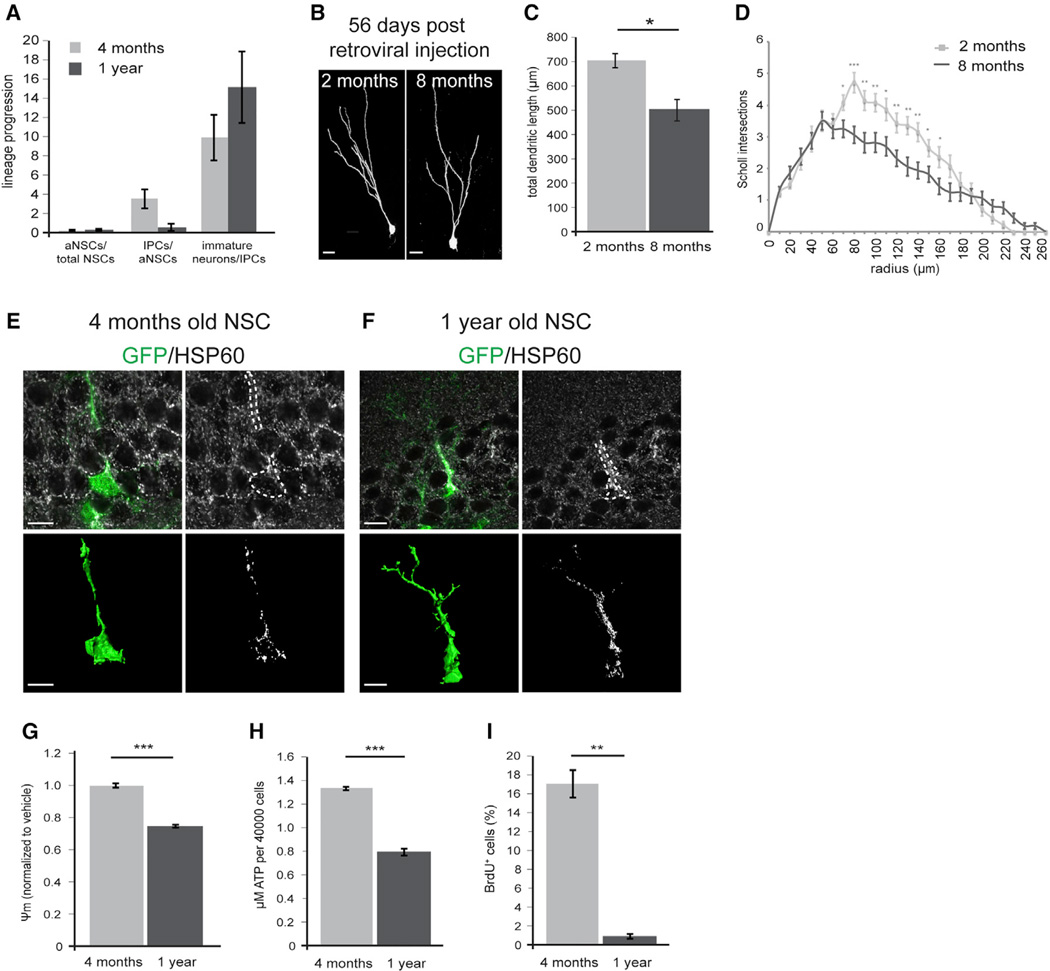
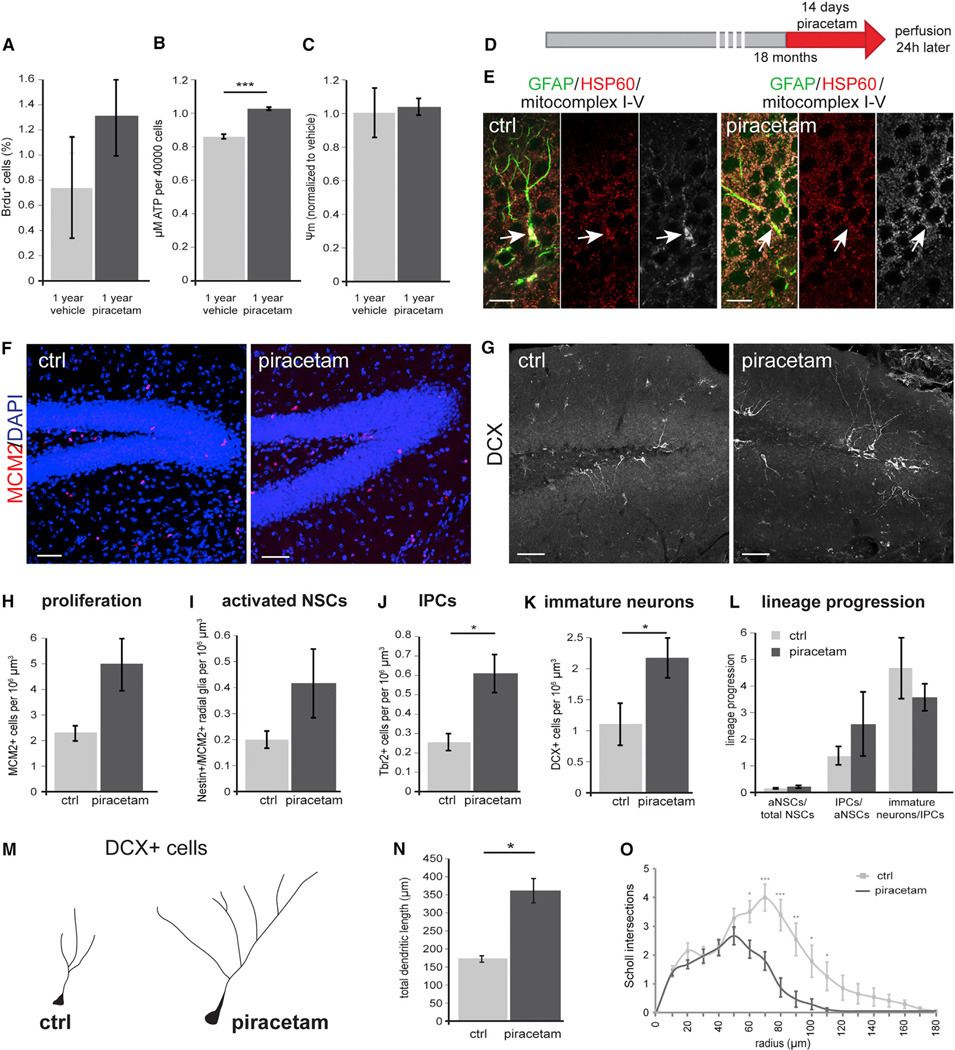
Precise regulation of cellular metabolism is hypothesized to constitute a vital component of the developmental sequence underlying the life-long generation of hippocampal neurons from quiescent neural stem cells (NSCs). The identity of stage-specific metabolic programs and their impact on adult neurogenesis are largely unknown. We show that the adult hippocampal neurogenic lineage is critically dependent on the mitochondrial electron transport chain and oxidative phosphorylation machinery at the stage of the fast proliferating intermediate progenitor cell. Perturbation of mitochondrial complex function by ablation of the mitochondrial transcription factor A (Tfam) reproduces multiple hallmarks of aging in hippocampal neurogenesis, whereas pharmacological enhancement of mitochondrial function ameliorates age-associated neurogenesis defects. Together with the finding of age-associated alterations in mitochondrial function and morphology in NSCs, these data link mitochondrial complex function to efficient lineage progression of adult NSCs and identify mitochondrial function as a potential target to ameliorate neurogenesis-defects in the aging hippocampus.

Keywords: adult neurogenesis; aging; metabolism; mitochondria; stem cells.


Figures

Figure 1
Figure 1. Morphological EM Analysis of Mitochondria and Stage-Specific Molecular Program Suggests Adaptation of Metabolic Circuits
(A–C) Reconstruction of serial electron microscope (EM) sections of immunoperoxidase- or immunogold-labeled cells: (A) radial glial NSC primary process; (B) process of an intermediate progenitor cell (IPC); (C) segment of a month-old newborn (nb) neuron dendrite. Individual mitochondria were labeled in different colors to better illustrate their shape (D) Quantification of the average mitochondrial volume revealed that mitochondria in newborn neurons are larger than in NSCs and IPCs. Though mitochondria of newborn neurons appear small in cross-sections, their volumes are much larger due to their wider and highly elongated morphology (see also Movies S1, S2, and S3). The average mitochondrial volume in NSCs and IPCs is comparable with the exception of mitochondria in the primary process of NSCs (primary process, pp; fine process, fp; cell body, cb). (E) Statistics of the comparative analysis of mitochondrial volume measurements. (F) In vitro quiescent NSPCs (BMP4-silenced as described in STAR Methods) exhibit a membrane potential comparable to the membrane potential of proliferating NSPCs. (G) Scheme of the GO enrichment analysis of the transcriptomic database described in (Shin et al., 2015). The total genes in the genome were first divided into three groups based on their trend along pseudotime progression. The proportion of up and down genes in each GO entity of interest was surveyed to evaluate the functional directionality of the GO entity during progression of early adult neurogenesis. (H) Proportion of upregulated and downregulated genes within key functional GO entities (see also Figure S1A). Note the upregulation of ETC and mitochondrial complex associated genes. (I) Schematic drawing of the hippocampal NSC lineage with stage-specific expression of molecular markers. Box indicates developmental stages covered by transcriptomic resource. (J) Violin diagrams depict lineage progression of quiescent NSCs (qNSCs; aNSC, activated neural stem cell) to IPCs as evidenced by downregulation of Fapb7 and concomitant upregulation of Tbr2. Note the downregulation of genes associated with glycolysis and upregulation of genes associated with the TCA cycle and oxPhos. S1–S5 represent developmental stages ordered along pseudotime progression. Data in (D) and (F) represented as mean ± SEM; t test was performed to test significance in membrane potential (F).
Figure 2
Figure 2. Pharmacological and Genetic Inhibition of ETC and oxPhos and Its Impact on NSPC Function In Vitro and Mitochondria In Vivo
(A–D) Blocking mitochondrial complex I and V by rotenone and oligomycin, respectively, leads to a significant decrease in membrane potential (A) and ATP content (B); rotenone and oligomycin treatment almost completely abolish cell proliferation (C) and increase cell death (D) (E) Genotyping PCR of the Tfam locus of Tfamfl/fl NSPCs transduced with either a GFP-encoding control MMLV (ctrl) or an MMLV encoding for GFP and Crerecombinase (Cre) reveals recombination of the conditional Tfam locus in the context of the GFP/Cre encoding MMLV. Note the presence of the TfamloxP PCR product in GFP/Cre transduced NSPCs, which indicates that recombination of the conditional Tfam locus was present only in a subpopulation of NSPCs. (F–I) Tfamcko NSPC cultures displayed a significant decrease in membrane potential (F) and ATP production (G) compared to control cells (ctrl); proliferation was significantly decreased (H) and cell death increased (I). (J–M) Immunostaining for the mitochondrial proteins HSP60 (red) and Cox1 (white); GFP (green) served to identify recombined cells (outlined by white dotted line). (L and M) Reconstruction of recombinant ctrl and Tfamcko cells. All cells contained HSP60+ mitochondria, but only in ctrl cells, mitochondria invariably co-expressed Cox1 (J and L); in Tfamcko mice, recombinant cells showed strongly diminished Cox1 expression and displayed aberrant mitochondrial morphology (K and M). Data represented as mean ± SEM; t test was performed to determine significance; all scale bars = 10 µm.
Figure 3
Figure 3. Tfam Deficiency Does Not Affect NSCs but Impairs Neurogenesis at the Level of IPCs in 4-Month-Old Mice
(A) Experimental scheme of BrdU-paradigm used in (B) (B and F) Confocal images and quantification of control and Tfamcko mice showed a significant reduction in the number BrdU-expressing cells (red). GFP-reporter-positive cells are shown in green. (C–J) (C and G) Confocal images and quantification of Nestin immunoreactive cells (white) indicated no differences in number of total NCSs between control and Tfamcko mice; (C and H) activation of NSCs was not affected as revealed by quantification of cells co-expressing Nestin and the cell-cycle marker MCM2 (red, arrow). Tbr2+ IPCs (red; D) as well as DCX+ immature neurons (red; E) were significantly reduced in Tfamcko mice (I and J). (K) Comparison of the lineage progression index between ctrl and Tfamcko mice reveals impaired generation of IPCs. The lineage progression index is calculated by dividing the number of cells of a defined developmental stage by the number of cells of the preceding developmental stage (aNSCs normalized to total NSCs, IPCs normalized to aNSCs, immature neurons normalized to IPCs). Index aNSCs/total NSCs: ctrl = 0.1, Tfamcko = 0.14; index IPCs/aNSCs: Tfamcko = 0.23. (L and M) Confocal images of TUNEL+ cells in Tfamcko mice (red; arrow); quantification of TUNEL+ cells revealed a significant increase in apoptosis upon deletion of Tfam (M). (N–P) (N and P) Morphological analysis of newborn neurons in Tfamfl/fl mice 90 days post injection with MMLV vectors encoding for GFP alone (GFP) or for GFP and Cre (GFP Cre) revealed impaired dendritic morphology upon Tfam deletion. (F, G,I, and J) nctrl = 3, ncko = 4; (H) nctrl = 3, ncko = 3; (M) nctrl = 4, ncko = 5; (O) nGFP = 16 cells, nGFP Cre = 20 cells (Table S1). Data represented as mean ± SEM; t test was performed to determine significance; all scale bars = 20 µm.
Figure 4
Figure 4. Tfam Deletion Reproduces Multiple Aspects of Aging in Hippocampal Neurogenesis
(A) Comparison of the lineage progression index between young (4-month-old) and middle-aged (1-year-old) mice. Index aNSCs/total NSCs: 4 months = 0.1,1 year = 0.15; index IPCs/aNSCs: 1 year = 0.52. (B) Representative confocal images of MMLV-birthdated mature (56 dpi) DG neurons generated in 2- and 8-month-old wild-type mice. (C and D) Neurons generated in 8-month-old wild-type mice display impaired dendritic morphology as evidenced by shorter total dendritic length (C) and less intersections in Scholl-analysis (D); n = 14—6 neurons analyzed for each group. (E and F) Comparison of mitochondria in NSCs of young and middle-aged mice, visualized by immunostaining against HSP60 (white); NSCs are identified by GFP expression (green) and radial morphology in the hGFAPeGFP mouse line; bottom panels are reconstructions for GFP (green; bottom left) and HSP60 (white; bottom right). Upon aging, mitochondria increase in number and had a clumped appearance. (G–I) Membrane potential (G), ATP content (H), and proliferation (I) are significantly decreased in NSPCs isolated from 1-year-old mice compared to NSPCs derived from 4-month-old mice. (C) n2 months = 14 cells, n8 months = 16 cells (Table S1). Data presented as mean ± SEM; t test was performed to determine significance; scale bars = 10 µm.
Figure 5
Figure 5. Administration of Piracetam Ameliorates Aging-Associated Defects in Hippocampal Neurogenesis
(A–C) Treatment of NSPCs derived from 1-year-old mice with piracetam resulted in a trend toward increased proliferation (A). Piracetam significantly increased ATP production in NSPCs (B) but did not change membrane potential (C). (D) Experimental scheme of Piracetam administration to 18-month-old wild-type mice. (E) Radial-glia like GFAP-positive cells (green) in untreated animals occasionally revealed mitochondria of clumpy appearance (arrow) combined with increased immunoreactivity of HSP60 (red) and mitochondrial complexes I-V (white). Upon piracetam treatment this mitochondrial phenotype was less frequent (arrow). (F and G) Representative confocal images of MCM2+ (F; red) and DCX+ cells (G; white) in control (ctrl) and Piracetam-treated mice. (H–K) Piracetam-treated mice show increased numbers of MCM2+ proliferating cells, activated NSCs, IPCs, and DCX+ neurons. (L) Lineage progression analysis of control and Piracetam-treated aged mice. Index aNSCs/total NSCs: control = 0.02, piracetam = 0.04. (M–O) DCX+ neurons display a more complex morphology upon Piracetam treatment with longer (N) and more elaborate processes (O). (H–J) nctrl = 5, npiracetam = 5; (K) nctrl = 5, npiracetam = 4; (N) nctrl = 18 cells, npiracetam = 26 cells (Table S1). Data represented as mean ± SEM; t test was performed to determine significance; scale bars = 10 µm (E) and 20 µm (F and G).

Comment in

References

    1. Abrous DN, Wojtowicz JM. Interaction between Neurogenesis and Hippocampal Memory System: New Vistas. Cold Spring Harb. Perspect. Biol. 2015;7:7. - PMC - PubMed
    1. Agathocleous M, Love NK, Randlett O, Harris JJ, Liu J, Murray AJ, Harris WA. Metabolic differentiation in the embryonic retina. Nat. Cell Biol. 2012;14:859–864. - PMC - PubMed
    1. Ahlqvist KJ, Hämälaänen RH, Yatsuga S, Uutela M, Terzioglu M, Götz A, Forsström S, Salven P, Angers-Loustau A, Kopra OH, et al. Somatic progenitor cell vulnerability to mitochondrial DNA mutagenesis underlies progeroid phenotypes in Polg mutator mice. Cell Metab. 2012;15:100–109. - PubMed
    1. Aimone JB, Li Y, Lee SW, Clemenson GD, Deng W, Gage FH. Regulation and function of adult neurogenesis: from genes to cognition. Physiol. Rev. 2014;94:991–1026. - PMC - PubMed
    1. Alirol E, Martinou JC. Mitochondria and cancer: is there a morphological connection? Oncogene. 2006;25:4706–4716. - PubMed

Publication types

MeSH terms

Substances