. 2017 Feb 8;93(3):574-586.e8.
doi: 10.1016/j.neuron.2016.12.021. Epub 2017 Jan 19.

Phosphatidylserine Exposure Controls Viral Innate Immune Responses by Microglia

Affiliations

Phosphatidylserine Exposure Controls Viral Innate Immune Responses by Microglia

Yusuf Tufail et al. Neuron. .

Abstract

Microglia are the intrinsic immune sentinels of the central nervous system. Their activation restricts tissue injury and pathogen spread, but in some settings, including viral infection, this response can contribute to cell death and disease. Identifying mechanisms that control microglial responses is therefore an important objective. Using replication-incompetent adenovirus 5 (Ad5)-based vectors as a model, we investigated the mechanisms through which microglia recognize and respond to viral uptake. Transgenic, immunohistochemical, molecular-genetic, and fluorescence imaging approaches revealed that phosphatidylserine (PtdSer) exposure on the outer leaflet of transduced cells triggers their engulfment by microglia through TAM receptor-dependent mechanisms. We show that inhibition of phospholipid scramblase 1 (PLSCR1) activity reduces intracellular calcium dysregulation, prevents PtdSer externalization, and enables months-long protection of vector-transduced, transgene-expressing cells from microglial phagocytosis. Our study identifies PLSCR1 as a potent target through which the innate immune response to viral vectors, and potentially other stimuli, may be controlled.

Keywords: TAM receptor; adenovirus; astrocytes; calcium; infection; microglia; phagocytosis; phosphatidylserine; phospholipid scramblase 1; two-photon imaging.


Figures

Figure 1
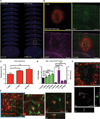
Figure 1. Microglia Engulf Adenoviral Vector-Transduced Cells
(A) Serial coronal brain sections (z) from an adult mouse 17 days after intracortical injection of 5.35 × 10⁵ PFU of an adenovirus 5 (Ad5)-based vector that expresses tdTomato (red) under control of the CMV promoter. Sections were co-stained with DAPI (blue). Scale bar, 1 mm. (B) tdTomato transgene expression pattern (top left), Iba-1 and glial fibrillary acidic protein (GFAP) immunoreactivity (top right and lower left), and fluorescence image overlay (lower right) from a central brain section area, similar to the one indicated in (A) (yellow box), 17 days after intracortical vector injection. Scale bars, 200 µm. (C) Population analysis showing that tdTomato-positive cell bodies are progressively cleared from the center toward the edges of the transduced area (see Method Details). (D) Population data showing time-dependent Iba-1 (green) and GFAP immunoreactivity (purple) from the transduced and control hemisphere (black). (E) Maximum-intensity projection image showing GFP-positive microglia (green) and tdTomato-positive cells in an area close to the center of the transduced area (left), similar to the area indicated in (B) (blue box). Three-dimensional image reconstruction confirms engulfment of Ad5-transduced cells by microglia (right). Scale bars, 30 µm (left) and 15 µm (center and right). (F) Brain section showing tdTomato-positive cells (red), Iba-1-positive microglia (green), and CD68-positive lysosomes 3 days after vector injection (top). Three-dimensional image reconstruction of the indicated area (gray box) confirms the presence of CD68-positive lysosomes inside microglia. Scale bars, 50 µm (top) and 10 µm (bottom). See also Figure S1 and Movie S1. (C) shows one-way ANOVA with Tukey’s multiple comparisons test (α = 0.05; n ≥ 5 animals per group); (D) shows one-way ANOVA with Dunnett’s multiple comparisons test (α = 0.05; n ≥ 5 animals per group).
Figure 2
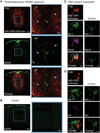
Figure 2. Adenoviral Vector Transduction Increases Phosphatidylserine Externalization and TAM Receptor Expression
(A) Fluorescence image showing transduced cells (red; top left) 3 days after intracortical Ad5 vector delivery. Phosphatidylserine on outer cell membranes was visualized using the annexin-based fluorescent indicator polarity sensitive indicator of viability and apoptosis (pSIVA) (green; center left). An image overlay is shown at the bottom. Yellow cells represent pSIVA-positive transduced cells. pSIVA staining was increased in the transduced region. Higher-magnification images of the boxed regions (blue) are shown on the right. Near central regions, pSIVA staining appears punctate, indicating cell fragmentation (open arrowhead). In more peripheral regions, circumferential somatic membrane staining predominates indicating stressed, but live, transduced and untransduced cells (filled yellow and white arrowheads, respectively). Scale bars, 100 µm (left) and 30 µm (right). (B) Fluorescence image showing pSIVA staining 3 days after vehicle (TMN) injection. A higher-magnification image of the boxed region (blue) is shown on the right. Scale bars, 100 µm (left) and 50 µm (right). (C) Example immunofluorescence images showing that 3 days after vector injection Mertk (magenta) is upregulated on Iba-1-positive microglia (green) near central regions of the transduced area (left) compared to cells in the contralateral control hemisphere (right). Image overlays are shown at the bottom. Population data are shown in Figure 4H. Scale bars, 5 µm. (D) Example immunofluorescence images showing that Axl (magenta) is also upregulated on Iba-1-positive microglia (green) near central regions (left) compared to the control hemisphere (right). Population data are shown in Figure 4H. Scale bars, 5 µm. See also Figures S2 and S3 and Movies S2 and S3.
Figure 3
Figure 3. Microglia-Mediated Cell Clearance Depends on TAM Receptors
(A) Fluorescence images showing Ad5 CMV-promoter-driven tdTomato expression (top), Iba-1 immunoreactivity (center), and GFAP immunoreactivity (bottom) in an Axl−/− Mertk−/− double knockout mouse 17 days after vector injection. Scale bar, 200 µm. (B) Population analysis showing cell clearance (top), Iba-1 immunoreactivity (center), and GFAP immunoreactivity (bottom) in Mertk−/− single and Axl−/− Mertk−/− double knockout mice 17 days after Ad5 injection. Contralateral hemispheres served as control regions. (B) shows one-way ANOVA with Tukey’s multiple comparisons test (α = 0.05; n ≥ 3 animals per group).
Figure 4
Figure 4. Phospholipid Scramblase 1 Inhibition Reduces Microglia-Mediated Cell Clearance and Cytokine Levels
(A) Serial coronal brain sections (z) from an adult mouse 17 days after intracortical injection of 5.35 × 10⁵ PFU of an Ad5 vector that expresses tdTomato (red) and a miR30-based shRNA against mouse phospholipid scramblase 1 (PLSCR1) under control of the CMV promoter. Sections were co-stained with DAPI (blue). Scale bar, 1 mm. (B) Transgene expression pattern (top left), Iba-1 and GFAP immunoreactivity (top right and lower left), and fluorescence image overlay (lower right) from a central brain section area 17 days after intracortical vector injection. Scale bars, 200 µm. (C) Population analysis showing that CMV promoter-driven PLSCR1-shRNA expression can significantly reduce clearance of Ad5-transduced cells compared to a non-silencing control (NSC) shRNA at 17 days after transduction. (D) Population data showing Iba-1 (green) and GFAP immunoreactivity (purple) for PLSCR1- and NSC-shRNA vectors. Contralateral hemispheres served as control regions (black). (E) Schematic showing analysis regions. r denotes radial distance from the injection center. (F) Population data showing the number of CD68-positive puncta on Iba-1-positive cells as a function of radial distance from the injection site for PLSCR1- and NSC-shRNA vectors. Data were normalized using contralateral hemispheres as control regions. (G) Population data showing the number of pSIVA-positive puncta on tdTomato-positive transduced cells as a function of radial distance from the injection site for PLSCR1- and NSC-shRNA vectors. (H) Population data showing the number of Mertk- and Iba-1-double-positive cells (left) or Axl- and Iba-1-double-positive cells (right) as a function of radial distance from the injection site for PLSCR1- and NSC-shRNA vectors. Data were normalized using contralateral hemispheres as control regions. (I) qPCR population data showing PLSCR1-shRNA-mediated reduction in tissue levels of interleukin-1β (IL-1β; left) and tumor necrosis factor-α (TNF-α; right) compared to the NSC vector at 3 and 17 days after intracortical Ad5 injection. Tissue punches (see Method Details) included the transduced area and some uninfected cells in the immediate vicinity of this area. See also Figures S4–S6. (C) shows unpaired t test (two-tailed) with Welch’s correction, p < 0.001, n ≥ 4 animals per group; (D) shows one-way ANOVA with Dunnett’s multiple comparisons test (α= 0.05; n ≥ 4 animals per group); (F) shows unpaired t test (p < 0.01 for 0–100 µm; n = 3 animals per group; N ≥ 2 slices per animal); (G) shows unpaired t test with Welch’s correction (p < 0.01 for 0–100 µm, 100–200 µm, and 200–350 µm; n = 3 animals per group; N ≥ 3 slices per animal); (H), left, shows unpaired t test (p < 0.01 and p < 0.05 for 0–100 µm and 100–200 µm, respectively; n = 3 animals per group; N ≥ 3 slices per animal); (H), right, shows unpaired t test (p < 0.01 and p < 0.05 for 100–200 µm and 200–350 µm, respectively; n ≥ 2 animals per group; N ≥ 3 slices per animal); (I), left, shows unpaired t test (two-tailed), p < 0.05 (n = 2 animals per group); (I), right, shows unpaired t test (two-tailed), p < 0.05 (n = 2 animals per group).
Figure 5
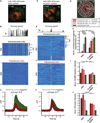
Figure 5. PLSCR1 Inhibition Reduces Intracellular Calcium Dysregulation
(A) Example two-photon fluorescence image showing Ad5-CMV-tdTomato-NSC-shRNA transduced (yellow/red) and untransduced (green) cells in the cortex of a live transgenic mouse expressing the green fluorescent, genetically encoded calcium indicator GCaMP5G under control of the GFAP promoter 17 days after intracortical vector delivery. Recordings were made at various axial depths and lateral distances from the injection site. This example recording was made at the injection site 140 µm below the pia (injection depth, 200 µm). Scale bar, 100 µm. (B) Example calcium activity of Ad5-transduced and untransduced GCaMP5G–expressing cells in an awake, head-restrained mouse on an exercise ball. Top: mouse running speed on the ball (black). Center and bottom: corresponding ΔF/F increases in 36 untransduced and 62 transduced cells, respectively. Regions of interest (ROIs) used for analysis of calcium signals in transduced (red) and untransduced (green) cells are indicated in (A). Scale bars, 20 mm/s and 50 s. (C) Population data showing the running onset-triggered (gray vertical line) average ΔF/F increase across Ad5-transduced (red) and untransduced (green) GCaMP5G–positive cells. The data are based on 25 (green) or 16 (red) recordings from n = 2 mice. Each recording included 2–4 running bouts. (D) Example two-photon fluorescence image showing Ad5-CMV-tdTomato-PLSCR1-shRNA transduced and untransduced cells in the cortex of a live transgenic mouse expressing GCaMP5G under control of the GFAP promoter 17 days after intracortical vector delivery (recording depth, 120 µm). Elongated dark regions are due to light absorption by surface blood vessels. Scale bar, 100 µm. (E) Example calcium activity of Ad5-transduced and untransduced GCaMP5G–positive cells in an awake, head-restrained mouse on an exercise ball. Top: mouse running speed on the ball (black). Center and bottom: corresponding ΔF/F increases in 69 untransduced and 60 transduced cells, respectively. ROIs used for analysis of transduced (red) and untransduced (green) cells’ calcium signals are indicated in (D). Scale bars, 20 mm/s and 50 s. Note the difference in transduced cells’ responsiveness to running onset compared to (B). (F) Population data showing the running onset-triggered (gray vertical line) average ΔF/F increase across Ad5-transduced (red) and untransduced (green) GCaMP5G–positive cells. The data are based on 20 (green) or 12 (red) recordings from n = 3 mice. Each recording included 2–4 running bouts. (G) Schematic showing analysis regions. r denotes radial distance from the injection center. (H–J) Population data showing running onset-triggered responsiveness (H), GCaMP5G baseline fluorescence (I), and tdTomato fluorescence (J), respectively, of Ad5-CMV-tdTomato-NSC-shRNA (left, red bars) or Ad5-CMV-tdTomato-PLSCR1-shRNA transduced cells (right, red bars) as a function of radial distance from the center of the injection site. Data were normalized to untransduced cells far away from the injection site (green; Figures S7H–S7J). See also Figure S7. Shaded areas in (C) and (F) represent the 75% and 25% percentile of the mean; (H) shows paired t test (Bonferroni corrected) for comparisons within the NSC (p < 0.0001) or PLSCR1-shRNA group and unpaired t test (Bonferroni corrected) for comparison between the two groups (p < 0.05); (I) and (J) show unpaired t test (Bonferroni corrected; p < 0.05 and p < 0.0001, respectively); the NSC or PLSCR1-shRNA group data in (H)–(J) are based on 25 recordings from n = 2 mice (1,208 untransduced cells and 48, 337, 183 transduced cells within 0–100 µm, 100–200 µm, and >200 µm, respectively) or 20 recordings from n = 3 mice, respectively (1,398 untransduced cells and 130, 363, 290 transduced cells within 0–100 µm, 100–200 µm, and >200 µm, respectively). Each recording included 2–4 running bouts.
Figure 6
Figure 6. PLSCR1 Inhibition Provides Long-Term Protection from Microglia-Mediated Cell Clearance
(A) Fluorescence images showing Ad5-transduced tdTomato- and PLSCR1-shRNA-expressing cells 1 month (top), 3 months (center), and 6 months (bottom) after intracortical vector injection in three different mice. Close ups show morphology of transduced cells near central regions of the transduced area. Scale bars, 200 µm (left) and 50 µm (right). (B) Population data showing cell clearance (top), Iba-1 immunoreactivity (center), and GFAP immunoreactivity (bottom) at 1 month, 3 months, or 6 months after intracortical injection of Ad5 with PLSCR1- or NSC-shRNA. (B) shows two-way ANOVA with Sidak’s multiple comparisons test (α = 0.05; n ≥ 3 animals per group).
Figure 7
Figure 7. Model of Signaling Pathways Involved in Microglia Phagocytosis of Adenoviral Vector-Transduced Cells
Ad5 enters cells with appropriate surface receptors, particularly astrocytes. During entry or intracellular trafficking, Ad5 is sensed, a process that likely involves Toll-like receptor (TLR) signaling (Figure S2). This results in an initial burst of pro-inflammatory cytokines and phospholipid scramblase 1 (PLSCR1) activity modulation. PLSCR1, in turn, induces changes in intracellular calcium (Ca2+) signaling, including blunted Ca2+ transients and increased calcium baseline (Figure 5). Dysregulation of intracellular Ca2+ homeostasis promotes phosphatidylserine (PtdSer) externalization either directly or indirectly. Additionally, it may lead to the release of damage-associated molecular patterns (DAMPs). Chemotactic gradients established by stressed cells attract microglia to central transduced regions (Movie S2). TAM receptor-mediated recognition of PtdSer-tagged cells triggers microglia phagocytosis. Engulfment of transduced cells facilitates detection of cellular DNA by microglial TLRs or STING, stimulating the production of secondary cytokines, thereby promoting cell death and bystander damage (Figure 2A; Figure S1E). shRNA-mediated knockdown of PLSCR1 (yellow) reduces dysregulation of intracellular Ca2+ homeostasis, PtdSer externalization, and, potentially, DAMP release. This, in turn, lowers TAM receptor-mediated detection of stressed cells, their phagocytosis, and secondary cytokine production. A similarly protective effect can be achieved by expression of calcium-insensitive, mutant PLSCR1D284A (Figure S6). PLSCR1 modulation can therefore act as a potent inhibitor of innate immune responses to Ad5-based vectors, enabling long-term expression of desired transgene(s). Blue and green arrows indicate likely events upstream of PLSCR1 activation and pathways affected by PLSCR1 modulation, respectively. Red indicates molecular players/mechanisms investigated in this study. Putative pathways/mechanisms are italicized. See text for more details. Abbreviations: CKR, cytokine receptor; cGAS, cyclic GMP-AMP synthase; Gas6, growth arrest-specific 6; IP3R, inositol 1,4,5-triphosphate receptor; IRF3/7, interferon regulatory factor 3/7; ProS, protein S; P2YR, P2Y purinoreceptor; STING, stimulator of interferon genes.

References

    1. Amengual O, Atsumi T, Oku K, Suzuki E, Horita T, Yasuda S, Koike T. Phospholipid scramblase 1 expression is enhanced in patients with antiphospholipid syndrome. Mod. Rheumatol. 2013;23:81–88. - PubMed
    1. Anand SK, Tikoo SK. Viruses as modulators of mitochondrial functions. Adv. Virol. 2013;2013:738794. - PMC - PubMed
    1. Arandjelovic S, Ravichandran KS. Phagocytosis of apoptotic cells in homeostasis. Nat. Immunol. 2015;16:907–917. - PMC - PubMed
    1. Ben-Efraim I, Zhou Q, Wiedmer T, Gerace L, Sims PJ. Phospholipid scramblase 1 is imported into the nucleus by a receptor-mediated pathway and interacts with DNA. Biochemistry. 2004;43:3518–3526. - PubMed
    1. Bernales I, Fullaondo A, Marín-Vidalled MJ, Ucar E, Martínez-Taboada V, López-Hoyos M, Zubiaga AM. Innate immune response gene expression profiles characterize primary antiphospholipid syndrome. Genes Immun. 2008;9:38–46. - PubMed

Substances