. 2017 Feb 6;27(3):334-344.
doi: 10.1016/j.cub.2016.12.003. Epub 2017 Jan 19.

Control of Movement Initiation Underlies the Development of Balance

Affiliations

Control of Movement Initiation Underlies the Development of Balance

David E Ehrlich et al. Curr Biol. .

Abstract

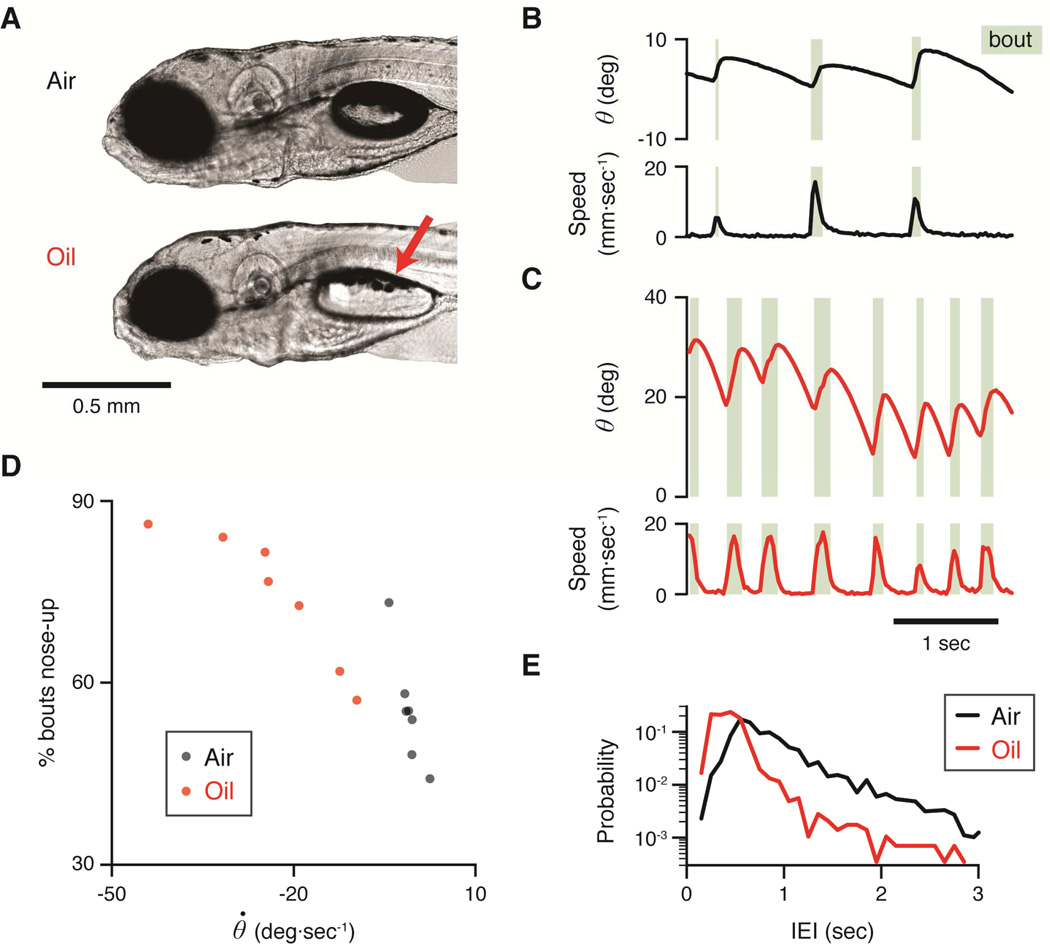
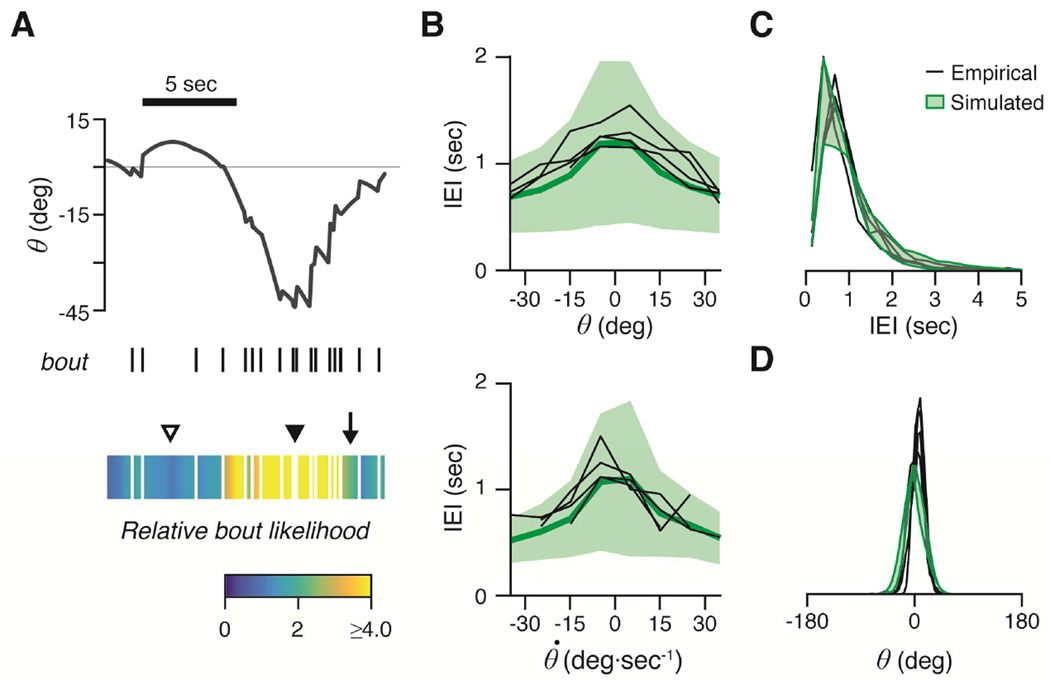
Balance arises from the interplay of external forces acting on the body and internally generated movements. Many animal bodies are inherently unstable, necessitating corrective locomotion to maintain stability. Understanding how developing animals come to balance remains a challenge. Here we study the interplay among environment, sensation, and action as balance develops in larval zebrafish. We first model the physical forces that challenge underwater balance and experimentally confirm that larvae are subject to constant destabilization. Larvae propel in swim bouts that, we find, tend to stabilize the body. We confirm the relationship between locomotion and balance by changing larval body composition, exacerbating instability and eliciting more frequent swimming. Intriguingly, developing zebrafish come to control the initiation of locomotion, swimming preferentially when unstable, thus restoring preferred postures. To test the sufficiency of locomotor-driven stabilization and the developing control of movement timing, we incorporate both into a generative model of swimming. Simulated larvae recapitulate observed postures and movement timing across early development, but only when locomotor-driven stabilization and control of movement initiation are both utilized. We conclude the ability to move when unstable is the key developmental improvement to balance in larval zebrafish. Our work informs how emerging sensorimotor ability comes to impact how and why animals move when they do.

Keywords: control; freely moving; growth; locomotion; morphology; pitch; sensorimotor; swimming; vestibular; zebrafish.


Figures

Figure 1
Figure 1. Swim bouts counteract passive instability
(A) Representative photomicrographs depicting zebrafish through- out the larval stage, with centers of buoyancy delineated and swimbladders outlined in white. (B) Schematic of the relevant forces and postural variables for pitch-axis stability. The force of buoyancy acts at the center of buoyancy, which is offset caudally from the center of mass, where the net gravitational force acts (Figure S1). The angle of the longitudinal axis of the fish (dotted line) relative to the horizon (dotted line) in the nose-up/nose-down axis is the pitch angle, Θ. The angular velocity, or rotation of the fish in the pitch axis, is represented by θ̇. Buoyant and gravitational forces acting on a larva pitched at −90° (right) would be aligned such that the larva is at hydrostatic equilibrium with no pitching moment. For all figures, the nose-up direction is represented by positive values. (C) A representative swimming epoch from a 7 dpf larva. Rhythmic spikes of translation speed delineate swim bouts (C1), which coincide with large changes to pitch angle (Θ, C2). Shaded bands indicate windows of bouts (green) and pauses (tan). (D) Pitch-axis asymmetry of bouts and pauses are plotted as a function of age and clutch. The proportion of bouts with fastest rotation in the nose- up direction is plotted in green. Corresponding mean angular velocity (θ̇) during pauses is plotted in tan. Individual clutches are plotted as thin lines and mean data as square markers on thick lines. (E) Each line represents the average % of bouts in the nose-up direction (green shading) for a single clutch, paired with the corresponding mean angular velocity (θ̇) during pauses (tan shading). See also Figure S1, Tables S1 and S3, and Movies 1 and 2.
Figure 2
Figure 2. Swim bouts stabilize angular velocity
(A) Bouts at 7 dpf (left, blue) and 21 dpf (right, purple) were aligned by peak speed (top). Simultaneous mean angular velocity (θ̇,bottom) of quintiles sorted by pre-bout θ̇(θ̇pre) is plotted as a function of time. (B) Mean θ̇pre and post-bout θ̇ (θ̇post) are plotted pairwise by quintile to highlight the improvement of angular velocity reduction with age. (C,D) Net angular acceleration (Δθ̇, the difference of θ̇post and θ̇pre) is plotted as a function of θ̇pre for individual bouts at 7 (C) and 21 dpf (D). Means of equally populated bins (thin lines) and best-fit lines (thick lines) are plotted for nose-down (left) and nose-up (right) values of θ̇pre. (E) The gain of angular velocity correction is plotted as a function of age and clutch (individual clutches as gray lines and pooled data as points on a thick line) for nose-down (left) and nose-up (right) θ̇pre. See also Table S2.
Figure 3
Figure 3. A denser swimbladder exacerbates nose-down destabilization, altering bout kinematics and timing
(A) Lateral photomicrographs of representative 5 dpf larvae with swimbladders filled with air (top) or paraffin oil (bottom, red arrow). Gamma was adjusted identically in both images for clarity. (B,C) Pitch angle (Θ) and translation speed during representative series of swim bouts for 5 dpf larvae, one with a swimbladder filled with air (B) and one with paraffin oil (C). (D) The percentage of bouts with fastest rotation in the nose-up direction is plotted as a function of angular velocity (θ̇) during pauses for individual clutches with air- and oil-filled swimbladders. (E) Log probability distributions of inter-event intervals (IEI) for swim bouts generated by 5 dpf larvae with air- and oil-filled swimbladders (n=7).
Figure 4
Figure 4. Bout initiation becomes posture-dependent as postural sensitivity improves with age
(A) Relative bout likelihood, a dimensionless ratio of two probability distributions, was calculated as a function of Θ and θ̇ from observed data (Equation S19) and plotted at each age (top row). Relative bout likelihood is plotted in 64 bins (8×8 of equal population for Θ and θ̇) with the mean for each bin plotted in color and values shown from 0–4. Empirical values were fit with a continuous function (Equation S21) for use in simulating stochastic bout initiation (bottom row). (B,C,D) Parameter estimates maximizing the fit of relative bout likelihood to observed data for the sensitivity to pitch, sensitivity to angular velocity, and the posture-independent baseline. Estimates were plotted with 99.2% CIs (Bonferroni corrected) for data pooled across clutches as a function of age. Inset grids delineate non-overlapping CIs for pairwise age comparison. (E) The product of relative bout likelihood and the time-dependent Bayesian prior (Equation S23) was a better predictor of empirical bout times than the prior alone (Equation S22). The ratio of the log-likelihoods of observing correct bout times under the two models is plotted as a function of age, for 250 cross-validations. Incorporating the relative bout likelihood significantly improves predictions when compared to a χ2 distribution with 4 degrees of freedom. See also Table S2.
Figure 5
Figure 5. A control-theoretic framework for postural stability across development
Locomotion-independent computations are represented as brown boxes and locomotion-dependent in blue. (A) Overview diagram for four computations incorporated in swimming simulations. Extrinsic destabilization (per Figure 1) is a function of Θ and tends to orient larvae nose-down (Movie 1, Supplemental Results) by causing an angular velocity that sums with a larva’s current velocity (θ̇). Bout timing (per Figure 4) is a function of both Θ and θ̇ and gates the corrective commands resulting from pitch (Table S2) and angular velocity correction (Figure 2). (B,C,D,E) Each computation is defined by one or more age-specific filters, schematized by a plot with two lines, blue (7 dpf) and purple (21 dpf). (B) Extrinsic destabilization comprises the age-specific, nose-down angular acceleration experienced by passive larvae. The precise value follows the cosine of Θ, such that the acceleration is maximal for a horizontal fish and decreases towards equilibrium when vertical. Age-specific weighting functions are plotted for 7 (blue) and 21 (purple) dpf. The angular acceleration is integrated to influence θ̇. (C) To generate posture-dependent bouts, Θ and θ̇ are scaled by the age-dependent pitch and angular velocity sensitivity functions respectively, and summed with an age-dependent baseline (relative bout likelihood). To implement the observed refractory period between bouts, the posture-dependent component is multiplied by a function of time elapsed since last bout (refractoriness, Equation S22). The overall bout probability governs bout initiation stochastically (die). (D,E) Pitch correction (D) and angular velocity correction (E, Equation S17) as age-dependent functions of Θ and θ̇, respectively. Empirically-derived noise (ε) was added to the pitch and angular velocity commands (Equation S17). Both pitch and angular velocity command signals are gated by the bout initiation signal. See also Table S2.
Figure 6
Figure 6. Simulated larvae reproduce empirical stability across development
(A) Representative epoch from a simulation of the full model at 21 dpf, incorporating pitch correction, angular velocity correction, and posture-dependent bout timing. Relative bout likelihood (color bar) reaches high values when pitch (Θ) is low (nose-down). When relative bout likelihood is large (closed triangle), so too tends bout rate. Conversely, bout rates tend to be low when relative bout likelihood is small (open triangle). Relative bout likelihood decreases as Θ approaches zero (arrow). (B) Simulated larvae regulate bout initiation by posture. Interevent intervals (IEI) between bout initiation are plotted as a function of mean pitch (top) and angular velocity (θ̇, bottom) for simulated 21 dpf (green line and band, mean ± S.D.) and empirical 21 dpf larvae (black line per clutch). (C) Probability distributions of IEI for empirical 21 dpf larvae (4 clutches) and larvae simulated at 95% confidence intervals (green band) for parameter solutions in the model (AUROC = 0.51±0.03, Table S2). (D) Probability distributions of Θ for 21 dpf larvae as in (C) (AUROC = 0.59±0.03). See also Table S2.
Figure 7
Figure 7. Contribution of posture control mechanisms to balance in silico
(A) Probability distributions of pitch of larvae simulated at 21 dpf using the full model (with relative bout likelihood, Equation S23), the null model excluding relative bout likelihood ("no RBL," Equation S22), and the model without relative bout likelihood or pitch correction. Bands reflect distributions at 95% confidence intervals of parameter solutions. (B) The inverse of the standard deviation of observed pitch (stability index), is plotted for each model as a function of age (mean ± S.D. for 50 simulations). (C) Age-dependent increase of relative stability, the ratio of stability indices for larvae simulated in the full model and the model without relative bout likelihood. (D) Log-probability distributions of IEIs simulated at 95% CIs under various models at 21 dpf.

Comment in

Similar articles

Cited by

References

    1. Dickinson MH. How animals move: An integrative view. Science. 2000;288:100–106. - PubMed
    1. Aleyev YG. Nekton. First. Springer; 1977.
    1. Webb PW, Weihs D. Stability versus maneuvering: Challenges for stability during swimming by fishes. Integrative and Comparative Biology. 2015;55:753–764. - PubMed
    1. Alexander RM. Functional Design in Fishes. First. Hutchinson University Library; 1967.
    1. Bernstein NA. The coordination and regulation of movements. First. Pergamon; 1967.

LinkOut - more resources