

Functional and oxygen-metabolic photoacoustic microscopy of the awake mouse brain
- PMID: 28111187
- PMCID: PMC5391672
- DOI: 10.1016/j.neuroimage.2017.01.049
Functional and oxygen-metabolic photoacoustic microscopy of the awake mouse brain
Abstract
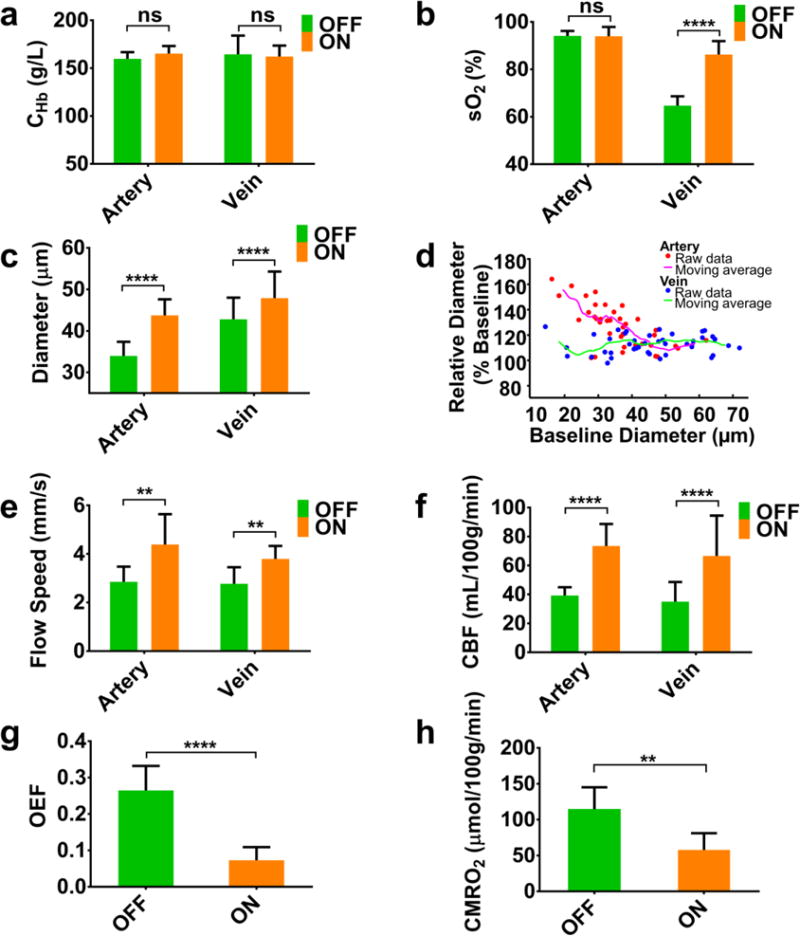
A long-standing challenge in optical neuroimaging has been the assessment of hemodynamics and oxygen metabolism in the awake rodent brain at the microscopic level. Here, we report first-of-a-kind head-restrained photoacoustic microscopy (PAM), which enables simultaneous imaging of the cerebrovascular anatomy, total concentration and oxygen saturation of hemoglobin, and blood flow in awake mice. Combining these hemodynamic measurements allows us to derive two key metabolic parameters-oxygen extraction fraction (OEF) and the cerebral metabolic rate of oxygen (CMRO2). This enabling technology offers the first opportunity to comprehensively and quantitatively characterize the hemodynamic and oxygen-metabolic responses of the mouse brain to isoflurane, a general anesthetic widely used in preclinical research and clinical practice. Side-by-side comparison of the awake and anesthetized brains reveals that isoflurane induces diameter-dependent arterial dilation, elevated blood flow, and reduced OEF in a dose-dependent manner. As a result of the combined effects, CMRO2 is significantly reduced in the anesthetized brain under both normoxia and hypoxia, which suggests a mechanism for anesthetic neuroprotection. The head-restrained functional and metabolic PAM opens a new avenue for basic and translational research on neurovascular coupling without the strong influence of anesthesia and on the neuroprotective effects of various interventions, including but not limited to volatile anesthetics, against cerebral hypoxia and ischemia.
Keywords: Anesthetic neuroprotection; Awake-brain imaging; Head-restrained photoacoustic microscopy; Hemodynamics; Oxygen metabolism.
Copyright © 2017 Elsevier Inc. All rights reserved.
Figures


Similar articles
-
Photoacoustic microscopy reveals the hemodynamic basis of sphingosine 1-phosphate-induced neuroprotection against ischemic stroke.Theranostics. 2018 Nov 29;8(22):6111-6120. doi: 10.7150/thno.29435. eCollection 2018. Theranostics. 2018. PMID: 30613286 Free PMC article.
-
Hemodynamic and oxygen-metabolic responses of the awake mouse brain to hypercapnia revealed by multi-parametric photoacoustic microscopy.J Cereb Blood Flow Metab. 2021 Oct;41(10):2628-2639. doi: 10.1177/0271678X211010352. Epub 2021 Apr 25. J Cereb Blood Flow Metab. 2021. PMID: 33899557 Free PMC article.
-
Ultrasound-aided Multi-parametric Photoacoustic Microscopy of the Mouse Brain.Sci Rep. 2015 Dec 21;5:18775. doi: 10.1038/srep18775. Sci Rep. 2015. PMID: 26688368 Free PMC article.
-
Time to wake up: Studying neurovascular coupling and brain-wide circuit function in the un-anesthetized animal.Neuroimage. 2017 Jun;153:382-398. doi: 10.1016/j.neuroimage.2016.11.069. Epub 2016 Nov 28. Neuroimage. 2017. PMID: 27908788 Free PMC article. Review.
-
Functional photoacoustic microscopy of hemodynamics: a review.Biomed Eng Lett. 2022 Apr 10;12(2):97-124. doi: 10.1007/s13534-022-00220-4. eCollection 2022 May. Biomed Eng Lett. 2022. PMID: 35529339 Free PMC article. Review.
Cited by
-
Free-moving-state microscopic imaging of cerebral oxygenation and hemodynamics with a photoacoustic fiberscope.Light Sci Appl. 2024 Jan 2;13(1):5. doi: 10.1038/s41377-023-01348-3. Light Sci Appl. 2024. PMID: 38163847 Free PMC article.
-
Hessian filter-assisted full diameter at half maximum (FDHM) segmentation and quantification method for optical-resolution photoacoustic microscopy.Biomed Opt Express. 2022 Aug 9;13(9):4606-4620. doi: 10.1364/BOE.468685. eCollection 2022 Sep 1. Biomed Opt Express. 2022. PMID: 36187248 Free PMC article.
-
Three-dimensional non-invasive brain imaging of ischemic stroke by integrated photoacoustic, ultrasound and angiographic tomography (PAUSAT).Photoacoustics. 2022 Dec 25;29:100444. doi: 10.1016/j.pacs.2022.100444. eCollection 2023 Feb. Photoacoustics. 2022. PMID: 36620854 Free PMC article.
-
A novel lysosome-to-mitochondria signaling pathway disrupted by amyloid-β oligomers.EMBO J. 2018 Nov 15;37(22):e100241. doi: 10.15252/embj.2018100241. Epub 2018 Oct 22. EMBO J. 2018. PMID: 30348864 Free PMC article.
-
Comprehensive Characterization of Cerebrovascular Dysfunction in Blast Traumatic Brain Injury Using Photoacoustic Microscopy.J Neurotrauma. 2019 May 15;36(10):1526-1534. doi: 10.1089/neu.2018.6062. Epub 2019 Jan 25. J Neurotrauma. 2019. PMID: 30501547 Free PMC article.
References
Publication types
MeSH terms
Grants and funding
LinkOut - more resources
Full Text Sources
Other Literature Sources
Research Materials
Miscellaneous
