. 2017 Apr 1:149:33-43.
doi: 10.1016/j.neuroimage.2017.01.046. Epub 2017 Jan 19.

Mapping the critical gestational age at birth that alters brain development in preterm-born infants using multi-modal MRI

Affiliations

Mapping the critical gestational age at birth that alters brain development in preterm-born infants using multi-modal MRI

Dan Wu et al. Neuroimage. .

Abstract

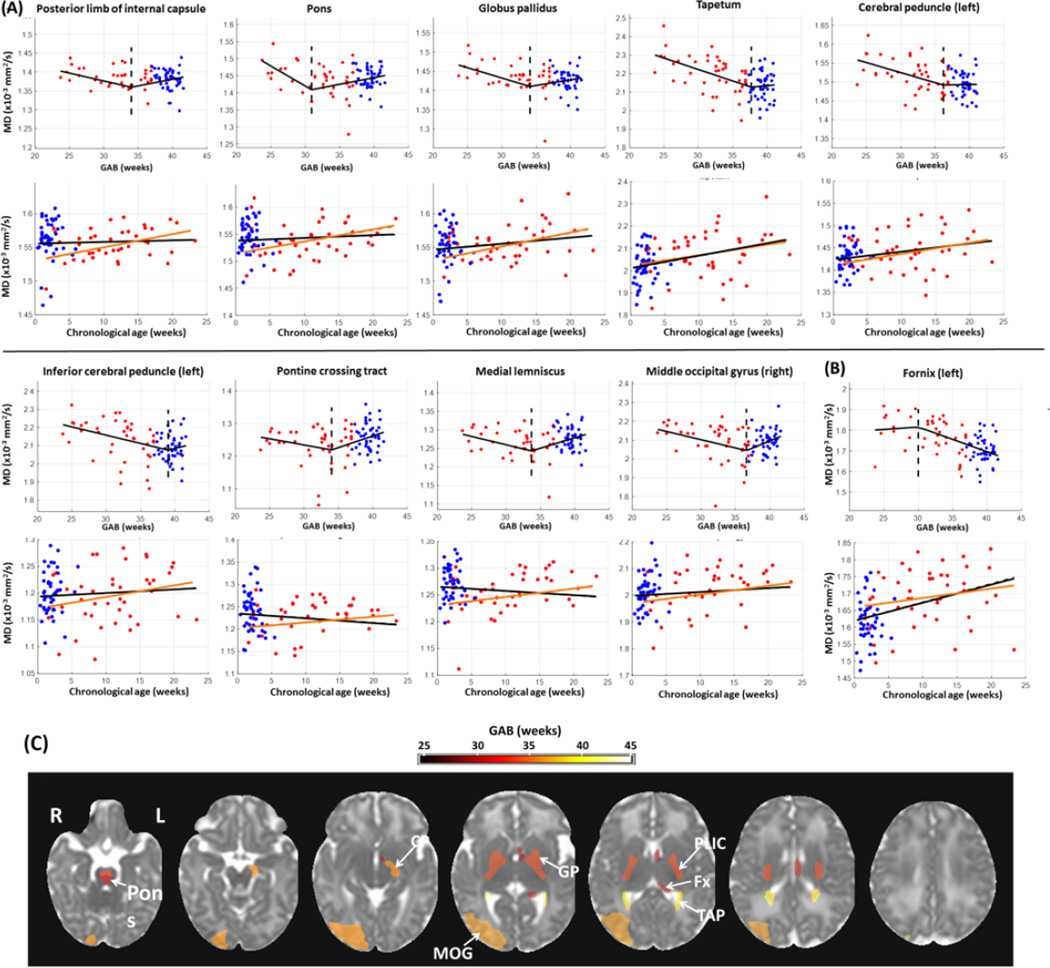
Preterm birth adversely affects postnatal brain development. In order to investigate the critical gestational age at birth (GAB) that alters the developmental trajectory of gray and white matter structures in the brain, we investigated diffusion tensor and quantitative T2 mapping data in 43 term-born and 43 preterm-born infants. A novel multivariate linear model-the change point model, was applied to detect change points in fractional anisotropy, mean diffusivity, and T2 relaxation time. Change points captured the "critical" GAB value associated with a change in the linear relation between GAB and MRI measures. The analysis was performed in 126 regions across the whole brain using an atlas-based image quantification approach to investigate the spatial pattern of the critical GAB. Our results demonstrate that the critical GABs are region- and modality-specific, generally following a central-to-peripheral and bottom-to-top order of structural development. This study may offer unique insights into the postnatal neurological development associated with differential degrees of preterm birth.

Keywords: Change point analysis; Diffusion MRI; Gestational age at birth; Neonatal brain atlas; Preterm birth; T2 mapping.


Figures

Figure 1
Figure 1
Change point analyses in the white and gray matter structures that showed GAB-dependent FA changes with significant change points (familywise p<0.05). (A–B) First row for each structure: the x-axes represent GAB in unit of weeks, and the y-axes represent FA after correcting for PMA at scan and gender, based on the multivariate regression change point model. The red and blue dots denote data from preterm and term-born neonates, respectively. The black lines show FA values fitted to GAB only (first and second terms in Equation 1), and dashed lines indicate the change points. Second row for each structure: the x-axes represent chronological age (age after birth) in unit of weeks, and the y-axes represent FA after correcting for PMA at scan and gender. The black lines indicated the linear regression between FA and chronological age with both the term and preterm-born infants, and the orange lines showed the linear fitting with only the preterm data. In a majority of structures (n=39), FA increased with GAB before the change point, and then remained relatively stable after the change point (A). However, in some structures (n=10), the FA was relatively stable before the change point and then decreased with GAB after the change point (B). For the first pattern (A), only the structures with most significant change points (familywise p<0.01) were plotted. For the structures that were bilaterally significant, only one side (left side) was presented; for those that were significant only in one side, the laterality is indicated in the plots.(C): Change point values of FA in regions with significant change points (family-wise p<0.05), overlaid on the JHU neonate FA atlas. The color bar indicates the change points in units of GAB (weeks). Abbreviations: SCP – superior cerebellar peduncle; ITG –inferior temporal gyrus; CP –cerebral peduncle; MB – midbrain; SS –sagittal striatum; IFO – inferior fronto-occipital fasciculus; GP –globus pallidus; Put –putamen; Thal –thalamus; Cu – cuneus; ALIC –anterior limb of internal capsule; PLIC – posterior limb of internal capsule; RLIC – retrolenticular part of internal capsule; TAP –tapetum; PCR – posterior corona radiata; PrCu – precuneus; SLF –superior longitudinal fasciculus; CGC – cingulum cingular part.
Figure 2
Figure 2
Change point analysis of MD measurements (corrected for PMA at scan and gender) in the structures with significant change points (familywise p<0.05). (A–B) First row for each structure: change of MD against GAB, after correcting for PMA at scan and gender. The red and blue dots denote data from preterm and term-born neonates, respectively. The black lines show FA values fitted to GAB only, and dashed lines indicate the change points. Second row for each structure: change of MD against chronological age, after correcting for PMA at scan and gender. The black lines indicated the linear regression between FA and chronological age with both the term and preterm-born infants, and the orange lines showed the linear fitting with only the preterm data. For the structures that were bilaterally significant, only one side (left side) was presented; for those that were significant only in one side, the laterality is indicated in the plots. In a majority of regions (n=15), MD decreased with GAB before the change point, and remained relatively stable after the change point (A). Conversely, MD values in left fornix (B) were relatively stable before the change point and then decreased with GAB after the change point. (C): Change point values of MD in regions with significant change points (family-wise p<0.05), overlaid on the JHU neonate MD atlas. The color bar indicates change points in units of GAB (weeks). Abbreviations: CP –cerebral peduncle; MOG –middle occipital lobe; GP –globus pallidus; PLIC –posterior limb of internal capsule; Fx –fornix; TAP –tapetum.
Figure 3
Figure 3
Change point analysis of T2 relaxation times (corrected for PMA at scan and gender) in the structures with significant change points (familywise p<0.05). (A) First row for each structure: change of T2 relaxation time against GAB, after correcting for PMA at scan and gender. The red and blue dots denote data from preterm and term-born neonates, respectively. The black lines show T2 relaxation time fitted to GAB only, and dashed lines indicate the change points. Second row for each structure: change of T2 relaxation time against chronological age, after correcting for PMA at scan and gender. The black lines indicated the linear regression between T2 relaxation time and chronological age with both the term and preterm-born infants, and the orange lines showed the linear fitting with only the preterm data. For the structures that were bilaterally significant, only one side (left side) was presented; for those that were significant only in one side, the laterality is indicated in the plots. In all regions (n = 11), T2 relaxation times increased slightly before the change point and then shortened with GAB after the change point. (B): Change point values of T2 relaxation time in regions that showed significant change points (FDR p<0.05), overlaid on the JHU neonate T2-weighted atlas. The color bar indicates the change points in units of GAB (weeks). Abbreviations: MFOG – medial fronto-orbaital gyrus; RG – gyrus rectus; SCP –superior cerebellar peduncle; Fx –fornix; PrCu – precuneus; PoCG –postcentral gyrus.

Similar articles

Cited by

References

    1. Akazawa K, Chang L, Yamakawa R, Hayama S, Buchthal S, Alicata D, Andres T, Castillo D, Oishi K, Skranes J, Ernst T, Oishi K. Probabilistic maps of the white matter tracts with known associated functions on the neonatal brain atlas: Application to evaluate longitudinal developmental trajectories in term-born and preterm-born infants. Neuroimage. 2016;128:167–179. - PMC - PubMed
    1. Alexandrou G, Martensson G, Skiold B, Blennow M, Aden U, Vollmer B. White matter microstructure is influenced by extremely preterm birth and neonatal respiratory factors. Acta Paediatr. 2014;103:48–56. - PubMed
    1. Anjari M, Srinivasan L, Allsop JM, Hajnal JV, Rutherford MA, Edwards AD, Counsell SJ. Diffusion tensor imaging with tract-based spatial statistics reveals local white matter abnormalities in preterm infants. Neuroimage. 2007;35:1021–1027. - PubMed
    1. Assaf Y, Blumenfeld-Katzir T, Yovel Y, Basser PJ. AxCaliber: a method for measuring axon diameter distribution from diffusion MRI. Magnetic Resonance in Medicine. 2008;59:1347–1354. - PMC - PubMed
    1. Atkinson J, Braddick O. Visual and visuocognitive development in children born very prematurely. Prog Brain Res. 2007;164:123–149. - PubMed

Publication types