. 2017 Apr 6;20(4):435-449.e4.
doi: 10.1016/j.stem.2016.12.007. Epub 2017 Jan 19.

Human iPSC-Derived Cerebral Organoids Model Cellular Features of Lissencephaly and Reveal Prolonged Mitosis of Outer Radial Glia

Affiliations

Human iPSC-Derived Cerebral Organoids Model Cellular Features of Lissencephaly and Reveal Prolonged Mitosis of Outer Radial Glia

Marina Bershteyn et al. Cell Stem Cell. .

Abstract

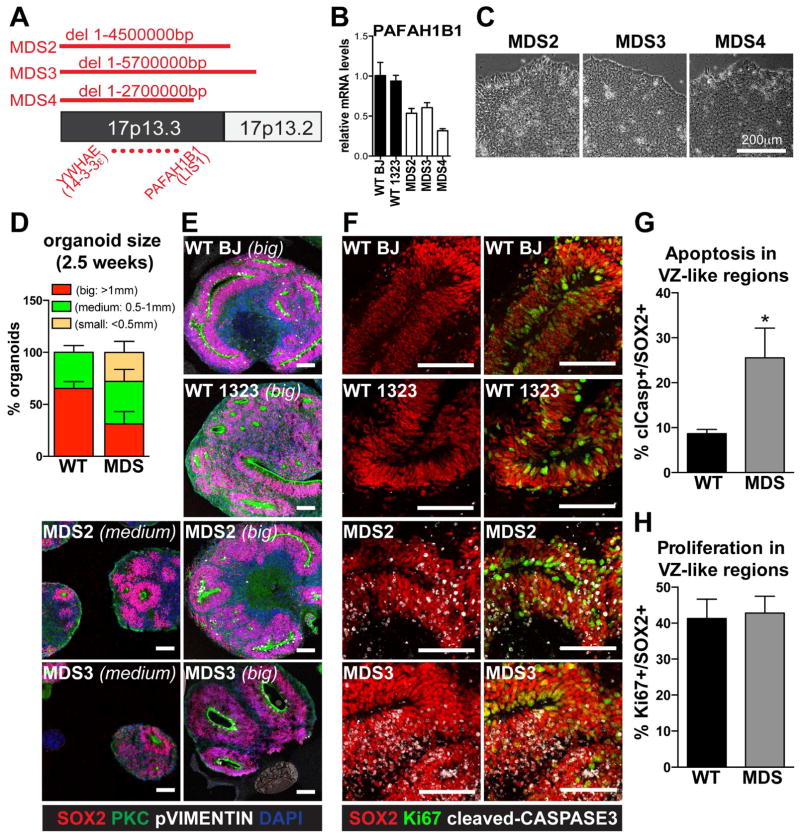
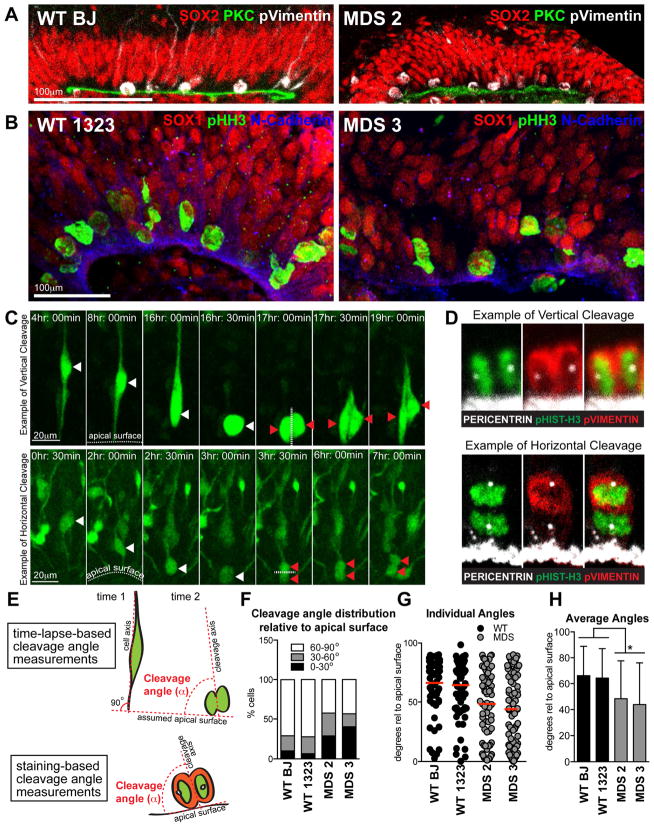
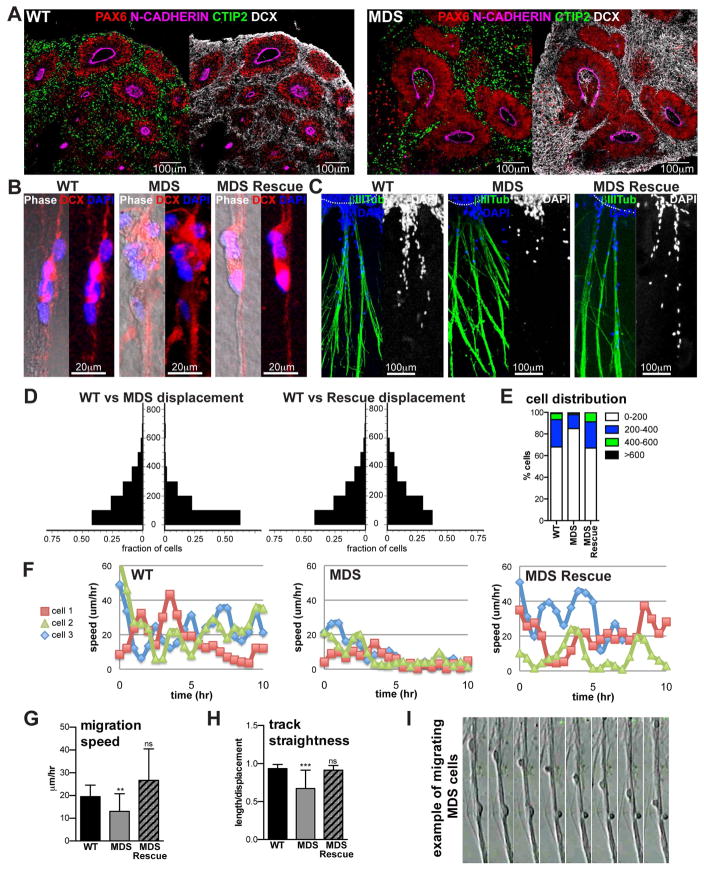
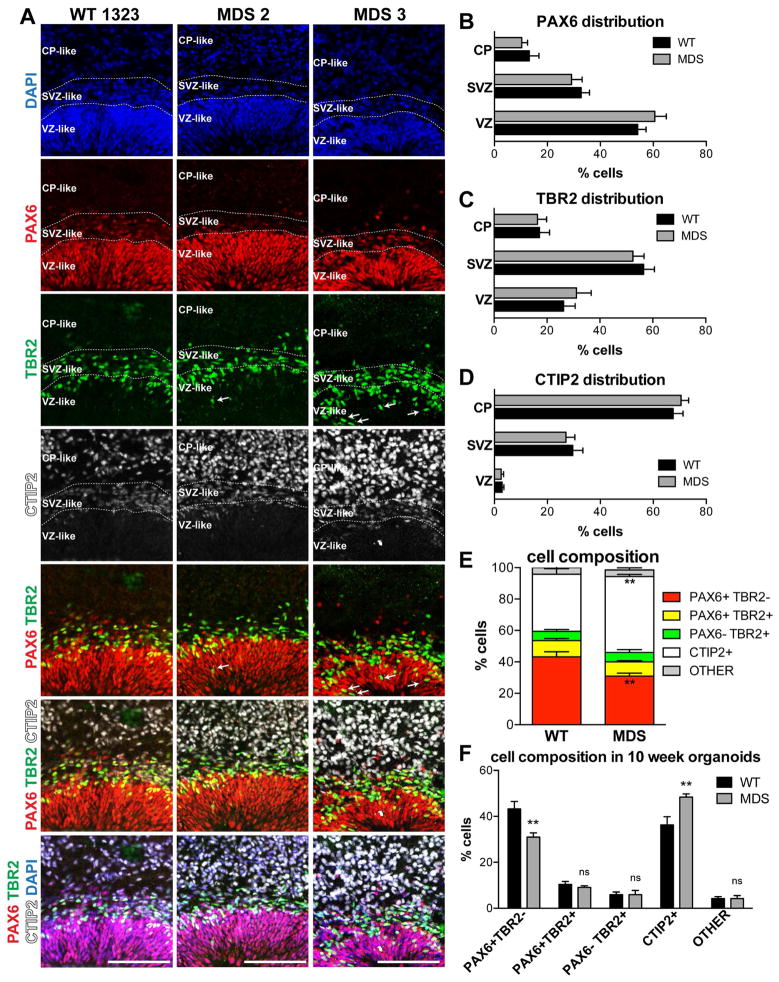
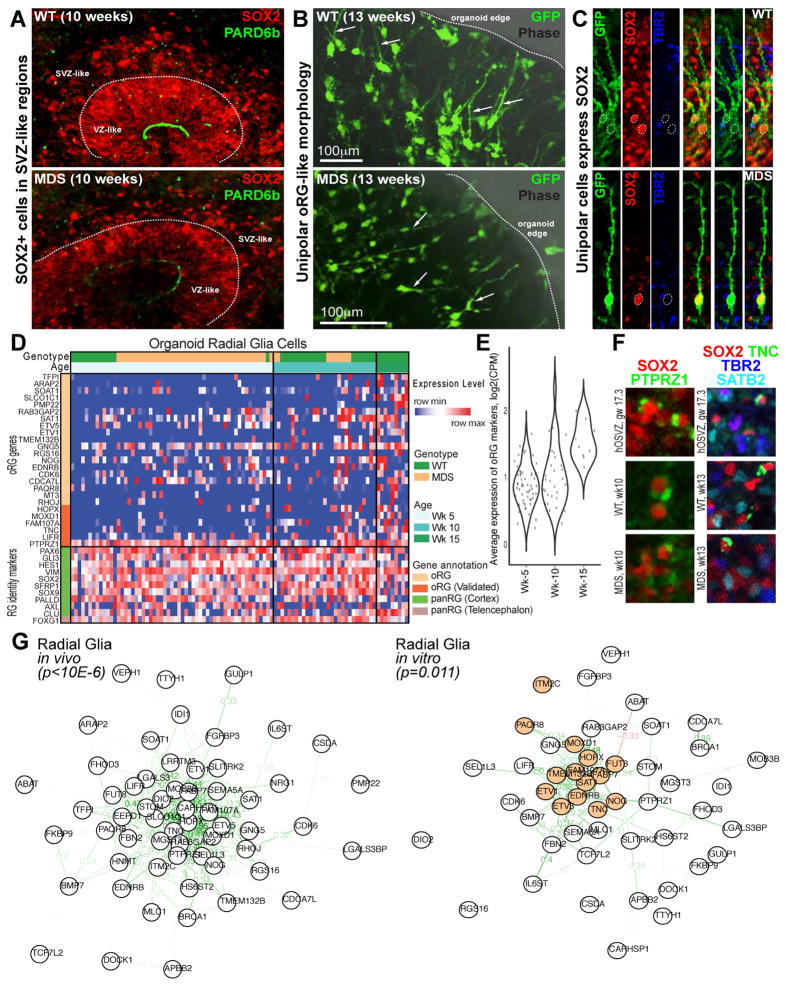
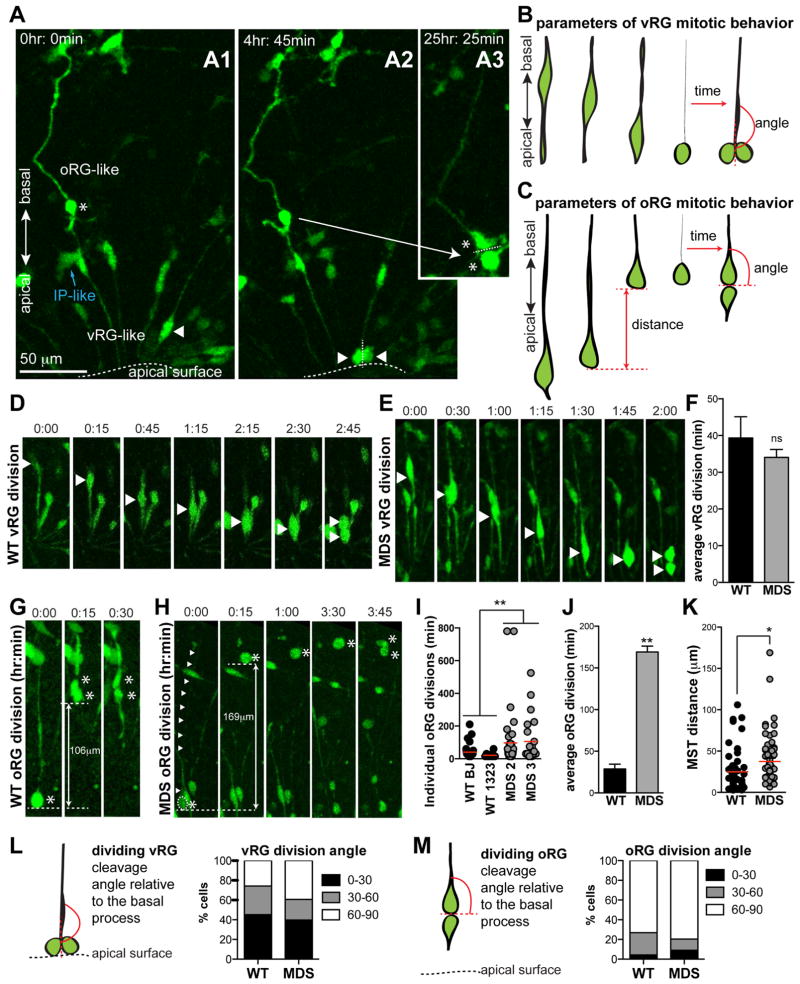
Classical lissencephaly is a genetic neurological disorder associated with mental retardation and intractable epilepsy, and Miller-Dieker syndrome (MDS) is the most severe form of the disease. In this study, to investigate the effects of MDS on human progenitor subtypes that control neuronal output and influence brain topology, we analyzed cerebral organoids derived from control and MDS-induced pluripotent stem cells (iPSCs) using time-lapse imaging, immunostaining, and single-cell RNA sequencing. We saw a cell migration defect that was rescued when we corrected the MDS causative chromosomal deletion and severe apoptosis of the founder neuroepithelial stem cells, accompanied by increased horizontal cell divisions. We also identified a mitotic defect in outer radial glia, a progenitor subtype that is largely absent from lissencephalic rodents but critical for human neocortical expansion. Our study, therefore, deepens our understanding of MDS cellular pathogenesis and highlights the broad utility of cerebral organoids for modeling human neurodevelopmental disorders.

Keywords: cerebral organoids; human lissencephaly; migration; outer radial glia; spindle orientation.


Figures

Figure 1
Figure 1. Apoptosis of NESCs in Miller-Dieker Syndrome (MDS) organoids (see also Figures S1, S2 and Table S2)
(A) Schematic and coordinates of the deletions (red lines) on chromosome 17 in MDS cells used in this study. YWHAE and PAFAH1B1 genes delineate the minimal critical deletion that causes MDS. (B) Quantitative real-time PCR (qRT-PCR) analysis of PAFAH1B1 expression in the WT and MDS fibroblasts that were used to make iPSCs. Average values ± S.D. for each individual are shown. (C) Representative images of MDS iPSCs grown on Matrigel. Scale bar=200μm. (D) Analysis of organoid sizes at 2.5 weeks of differentiation representing an average ± S.E.M. from WT (n=4 independent iPSC clones) and MDS (n=6 iPSC clones) (also see table in Experimental Procedures). (E) Representative images of organoid sections after 5 weeks of differentiation. Scale bar=100μm. (F) Representative images of VZ-like regions in 5 week organoids immunostained with apoptotic marker cleaved-CASPASE-3 and proliferation marker Ki67. Scale bar=100μm. (G/H) Percent of SOX2+ cells in VZ-like regions expressing cleaved CASP3 (G) and Ki67 (H). Average values ± S.E.M. for WT (n=3) and MDS (n=3) are plotted (also see table in Experimental Procedures). Statistical analysis was done using t-test (p=0.04).
Figure 2
Figure 2. Increased incidence of horizontal cleavage angles in MDS VZ-like regions at 5 weeks (see also Movies S1, S2 and Table S2)
(A, B) Representative images of VZ-like regions in WT and MDS. Scale bar=100μm. (C) Frames from time-lapse imaging showing examples of vertical (top) and horizontal (bottom) divisions. Scale bar=20μm. White arrowheads mark the parent cell, red arrowheads mark the progeny. The apical surface and the axis of the cleavage plane are demarcated with dotted white lines. (D) Examples of vertical and horizontal divisions observed in VZ-like regions of fixed organoids. Anaphase mitoses were identified by chromosomal position and morphology, only anaphase cells were considered for analysis of the cleavage angle. (E) Schematic of how cleavage angles were measured from time-lapse and immunostaining data. (F–H) Quantification of cleavage angle data. Collectively, 70–92 dividing cells were analyzed from each of WT (n=2) and MDS (n=2) individuals. The red line in (G) represents the mean cleavage angle. (H) Average cleavage angles ± S.D for each individual are shown. Statistical analysis was done using t-test (p=0.0158).
Figure 3
Figure 3. Defective neuronal migration in MDS is rescued by compensatory duplication of wild type chromosome 17 (see also Figures S3, S4 and Movies S3, S4 and Table S2)
(A) Representative images of WT and MDS cortical organoids after 5 weeks of differentiation. Scale bar=100μm. (B/C) Immunostaining of cells migrating on processes three days after intact organoids were attached to Matrigel. (B) Some of the processes seen in phase are not marked by DCX, suggesting that these may be radial glia fibers (see also Figure S3). (D) Quantification of cell displacement along the processes on day 3. On the y-axis is distance from the edge of the organoid (μm), on the x-axis is fraction of the total migrating cells at the corresponding distance bin. Migration assays were performed with WT (n=3), MDS (n=3) and MDS rescue (n=1) individuals. Data from the 3rd MDS individual is not represented in this quantification because there were very few (almost no) migrating cells (data not shown). (E) Summary of cell distribution across 200μm bins of displacement. (F) Representative tracks of speed over time for three different WT, MDS and MDS rescue cells. (G) Average migration speed. (H) Average track straightness. Statistical significance was determined by one way ANOVA followed by Tukey’s multiple comparison test. (I) Frames from time-lapse imaging of an MDS sample showing two cells migrating on processes. The top cell exhibits salutatory migration pattern of rounding up followed by leading process extension, while the bottom cell rounds up but fails to continue migration.
Figure 4
Figure 4. Increased abundance of CTIP2-positive neurons in MDS organoids at 10 weeks (see also Table S2)
(A) Representative images of WT (1323), MDS2 and MDS3 cortical organoids. Scale bar=100μm. The inferred VZ-, SVZ- and CP-like regions are delineated based on the combination of DAPI, PAX6, TBR2 and CTIP2 staining patterns. White arrows in the MDS TBR2 and PAX6/TBR2 panels point to IP cells located in the apical portions of the VZ. (B–F) Analysis of marker distribution across the VZ/SVZ/CP (B–D) and cell composition (E,F) within the organized regions in WT (12 total organoids from 3 individuals, 4 iPSC clones) and MDS (13 organoids from 2 individuals, 3 iPSC clones) organoids. Average value ± S.E.M. is plotted after collapsing technical replicates from each clone (WT n=4, MDS n=3). Two way ANOVA followed by Bonferroni’s adjustment for multiple comparisons was performed to determined statistical significance. For cell distribution (B–C) the only significant source of variation was region. For cell composition, there was a significant difference between WT and MDS in the proportion of PAX6+TBR2− cells and CTIP2+ cells.
Figure 5
Figure 5. Production of oRG cells in organoids after 10 weeks (see also Figures S5, S6 and Tables S1, S2 and dbGaP: phs000989.v3.p1)
(A) Representative images of WT and MDS progenitor zones in 10 week organoids. (B) GFP labeling with adenovirus reveals unipolar morphology and radial orientation of cells close to the edge of the organoids. Scale bar=100μm. (C) Immunostaining confirms radial glia fate of unipolar cells that express SOX2 and not the IP cell marker TBR2. (D) Heat map shows relative gene expression levels across 95 single radial glia cells captured from cerebral organoid samples (n=5 individuals from both WT and MDS). Genes represent canonical markers of radial glia (green bar) and forebrain identity (brown bar), as well as genes correlated with oRG identity (light and dark orange, the dark shade highlighting genes validated in vivo) (Pollen et al., 2015). The expression of oRG-correlated genes increases with age of the organoid (also see Supplementary Figure 5). (E) Violin plots representing distribution of the average expression of oRG marker genes across single cells captured from cerebral organoids at each stage of differentiation. (F) Validation of oRG markers’ (PTPRZ1 and TNC) co-expression with radial glia marker SOX2 in 10 week organoids. Note the similarity in the staining pattern between human OSVZ (GW17.3) and iPSC-derived organoids. (G) Network maps representing Pearson’s correlation between oRG marker genes across single cells in primary human brain tissue (Pollen et al., 2015) (left), and across cells captured from cerebral organoids (right). Correlations greater than 0.25 are highlighted with a pale green line, and correlations greater than 0.5 are highlighted with a dark green line. Genes that are most highly correlated across in vitro cells out of the oRG marker genes are highlighted in orange.
Figure 6
Figure 6. Prolonged mitosis in MDS oRG but not vRG cells at 10 weeks (see also Figure S5, Movie S5 and Table S2)
(A) Frames from time-lapse imaging showing representative examples of distinct vRG and oRG cell morphology, orientation and dividing properties in the same imaging field. The oRG-like cell is marked with a white star. Note the long basal process, and its superficial location relative to the bipolar vRG-like cells (example: white arrowhead). The indicated bipolar vRG-like cell from panel A1 moves apically and divides in A2 with a cleavage angle parallel to its basal process. In contrast, the indicated oRG-like cell undergoes an MST in the basal direction (not shown) and divides in A3 with a cleavage angle perpendicular to its basal process. Scale bar=50μm. (B) Schematic of parameters used to analyze vRG mitotic behavior: time from cell rounding to the first appearance of two daughters, angle of cleavage relative to the cell body axis just prior to basal process retraction. (C) Schematic of parameters used to analyze oRG mitotic behavior: MST distance, time from cell rounding to the first appearance of two daughters, angle of cleavage relative to the basal process. (D,E) Frames from time-lapse imaging showing representative examples of WT (D) and MDS (E) vRG-like divisions. (F) divisions. (I,J) Quantification of oRG division time (p=0.0028). (K) Quantification of oRG MST distance (p=0.05). (L, M) Quantification of vRG (L) and oRG (M) cleavage angle relative to the basal process. Average values ± S.E.M. are plotted in F and J. Statistical analysis was done using t-test (WT n=3; MDS n=2). For all the phenotypes, 20–50 cells were analyzed from each individual.

Comment in

References

    1. Armstrong E, Schleicher A, Omran H, Curtis M, Zilles K. The ontogeny of human gyrification. Cereb Cortex. 1995;1:56–63. - PubMed
    1. Bershteyn M, Hayashi Y, Desachy G, Hsiao EC, Sami S, Tsang KM, Weiss LA, Kriegstein AR, Yamanaka S, Wynshaw-Boris A. Cell-autonomous correction of ring chromosomes in human induced pluripotent stem cells. Nature. 2014;507:99–103. - PMC - PubMed
    1. Barkovich AJ, Koch TK, Carrol CL. The spectrum of lissencephaly: report of ten cases analyzed by magnetic resonance imaging. Ann Neurol. 1991;30:139–146. - PubMed
    1. Betizeau M, Cortay V, Patti D, Pfister S, Gautier E, Bellemin-Ménard A, Afanassieff M, Huissoud C, Douglas RJ, Kennedy H, Dehay C. Precursor diversity and complexity of lineage relationships in the outer subventricular zone of the primate. Neuron. 2013;2:442–57. - PubMed
    1. Borrell V, Gotz M. Role of radial glial cells in cerebral cortex folding. Curr Opin Neurobiol. 2014;27:39–46. - PubMed

Publication types