

Temporal Changes in Kidney Stone Composition and in Risk Factors Predisposing to Stone Formation
- PMID: 28111301
- PMCID: PMC5433898
- DOI: 10.1016/j.juro.2017.01.057
Temporal Changes in Kidney Stone Composition and in Risk Factors Predisposing to Stone Formation
Abstract
Purpose: The prevalence of kidney stones has increased globally in recent decades. However, studies investigating the association between temporal changes in the risk of stone formation and stone types are scarce. We investigated temporal changes in stone composition, and demographic, serum and urinary parameters of kidney stone formers from 1980 to 2015.
Materials and methods: We retrospectively analyzed the records of 1,516 patients diagnosed with either calcium or uric acid stones at an initial visit to a university kidney stone clinic from 1980 to 2015.
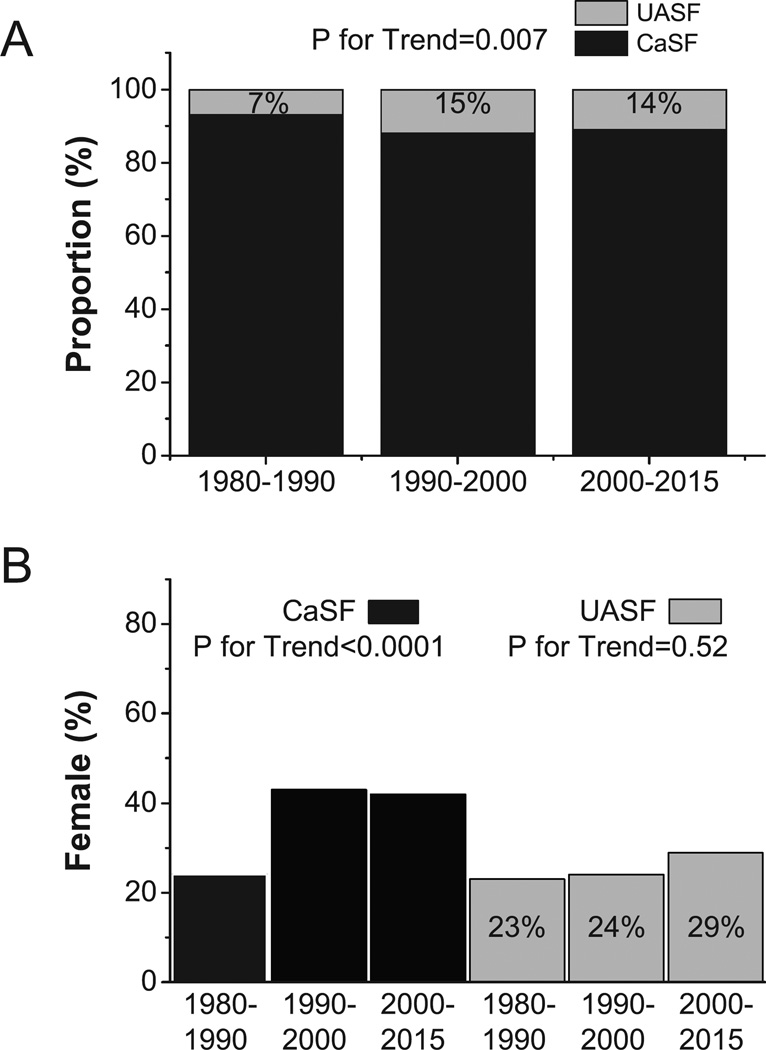
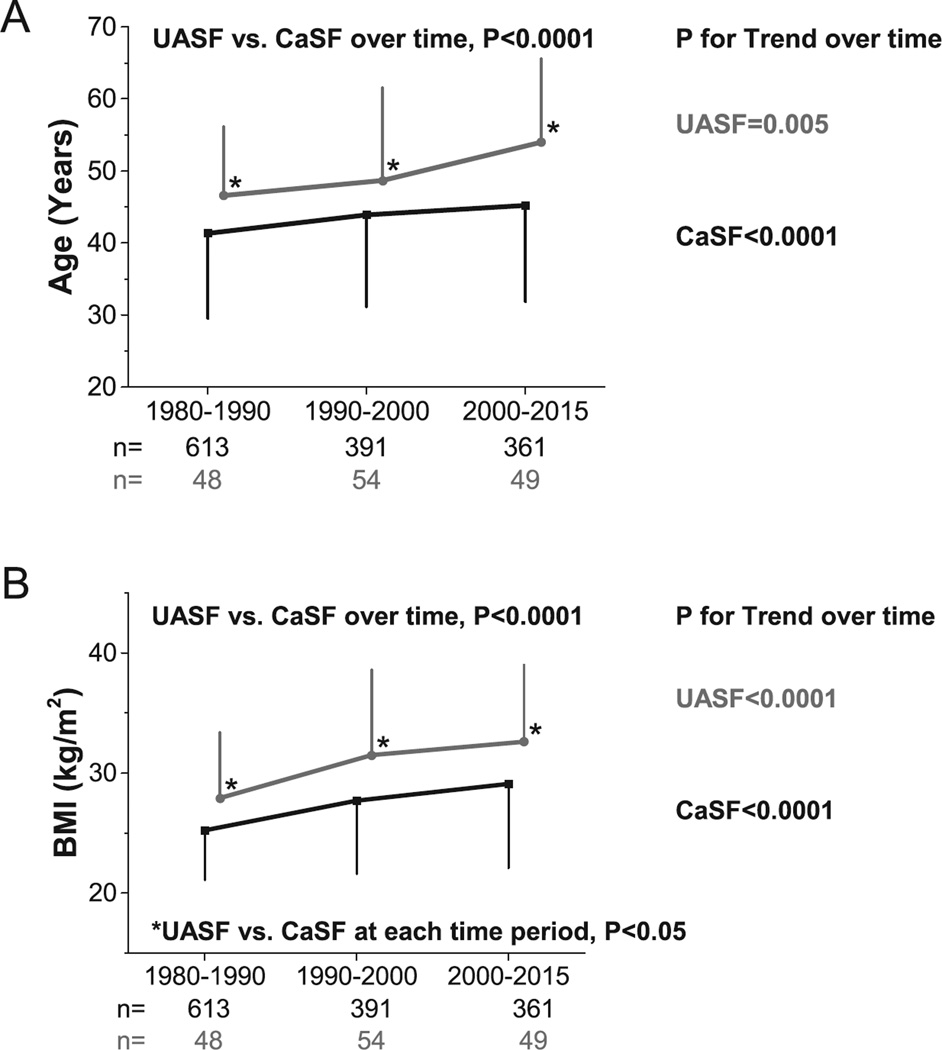
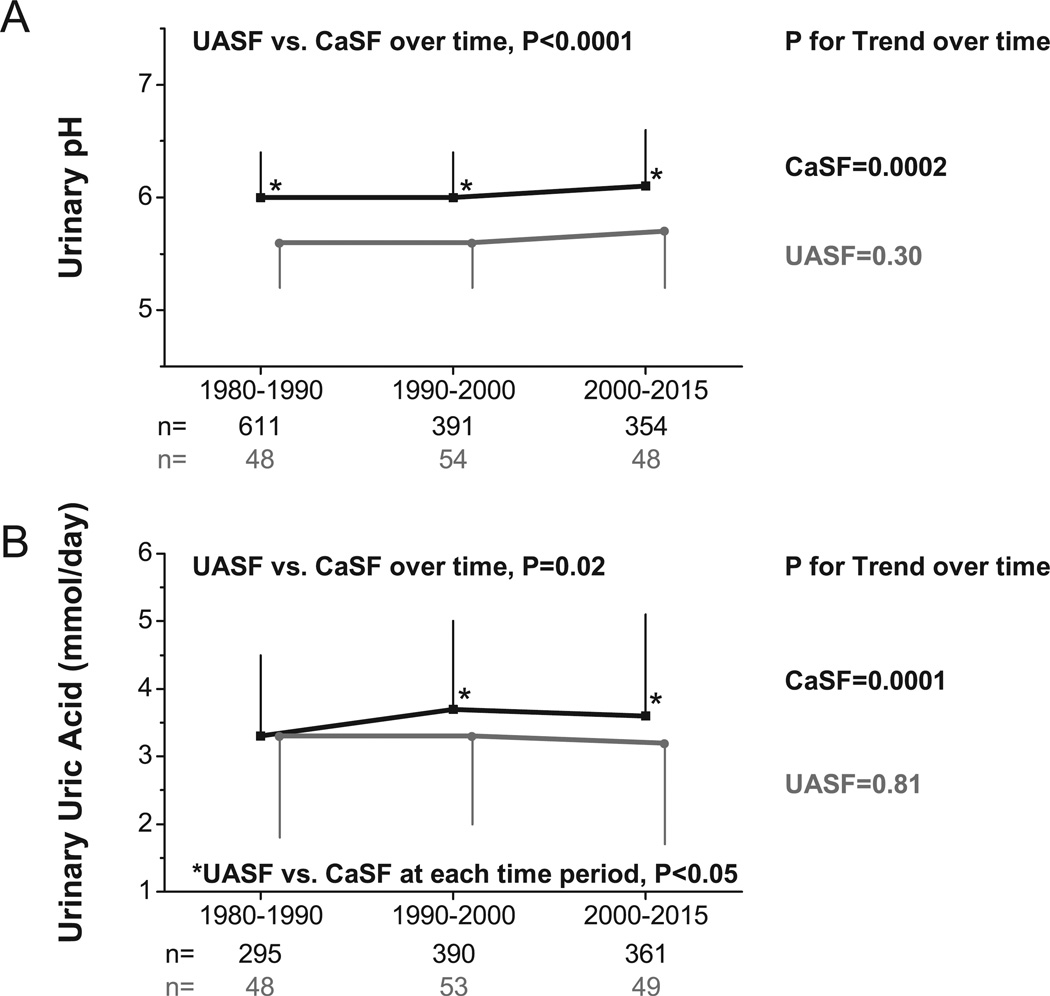
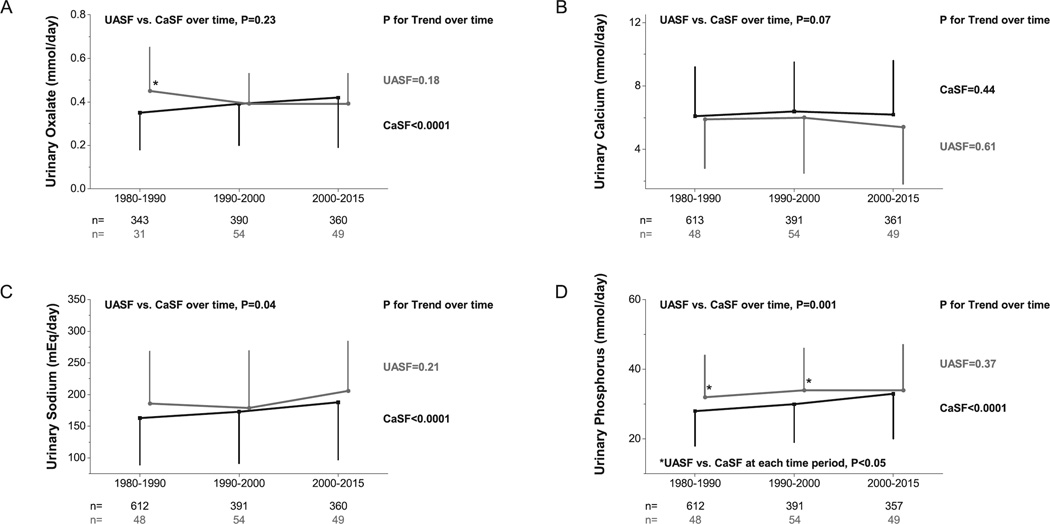
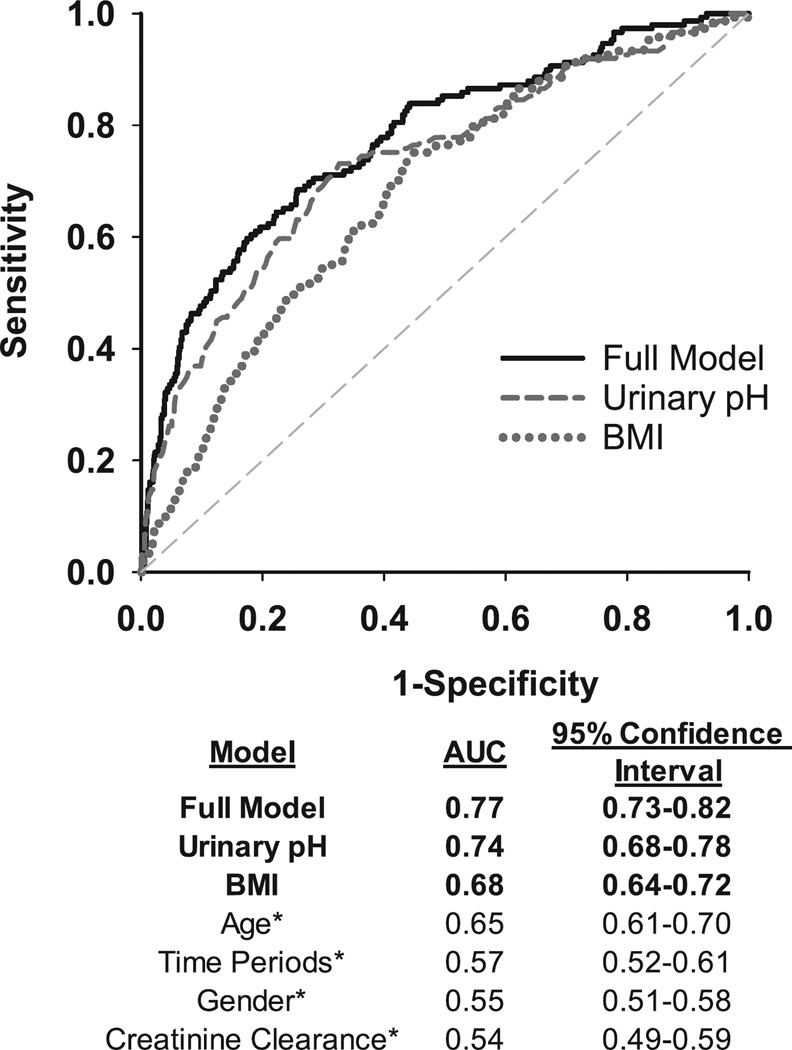
Results: From 1980 to 2015, the proportion of uric acid stones in all stone formers increased from 7% to 14%. While age and body mass index increased with time in both uric acid and calcium stone formers, uric acid stone formers were consistently older and had a higher body mass index and lower urinary pH than calcium stone formers. The proportion of females with stones has increased over time but the increase in female gender was more prominent among calcium stone formers. Urinary pH, phosphorus, oxalate and sodium increased with time in calcium stone formers but remained unchanged in uric acid stone formers. After accounting for various parameters of stone risk, the strongest clinical discriminant of uric acid vs calcium stones was urinary pH. Limitations of this study include the retrospective single center design and the available number of patients with stone analysis.
Conclusions: From 1980 to 2015, the proportion of uric acid stones increased significantly. With time, there were proportionately more female calcium stone formers but not uric acid stone formers. Urinary pH is the most prominent factor distinguishing uric acid from calcium stones.
Keywords: calcium; hydrogen-ion concentration; kidney calculi; uric acid; urine.
Copyright © 2017 American Urological Association Education and Research, Inc. Published by Elsevier Inc. All rights reserved.
Figures
References
-
- West B, Luke A, Durazo-Arvizu RA, et al. Metabolic syndrome and self-reported history of kidney stones: the National Health and Nutrition Examination Survey (NHANES III) 1988–1994. Am J Kidney Dis. 2008;51:741. - PubMed
-
- Maalouf NM, Cameron MA, Moe OW, et al. Low urine pH: a novel feature of the metabolic syndrome. Clin J Am Soc Nephrol. 2007;2:883. - PubMed
Publication types
MeSH terms
Grants and funding
LinkOut - more resources
Full Text Sources
Other Literature Sources
