. 2017 May;14(5):727-736.
doi: 10.1016/j.hrthm.2017.01.027. Epub 2017 Jan 19.

Antiarrhythmic effects of interleukin 1 inhibition after myocardial infarction

Affiliations

Antiarrhythmic effects of interleukin 1 inhibition after myocardial infarction

Nicole M De Jesus et al. Heart Rhythm. 2017 May.

Abstract

Background: Interleukin 1β (IL-1β) is a key regulator of the inflammatory response after myocardial infarction (MI) by modulating immune cell recruitment, cytokine production, and extracellular matrix turnover. Elevated levels of IL-1β are associated with adverse remodeling, and inhibition of IL-1 signaling after MI results in improved contractile function.

Objective: The goal of this study was to determine whether IL-1 signaling also contributes to post-MI arrhythmogenesis.

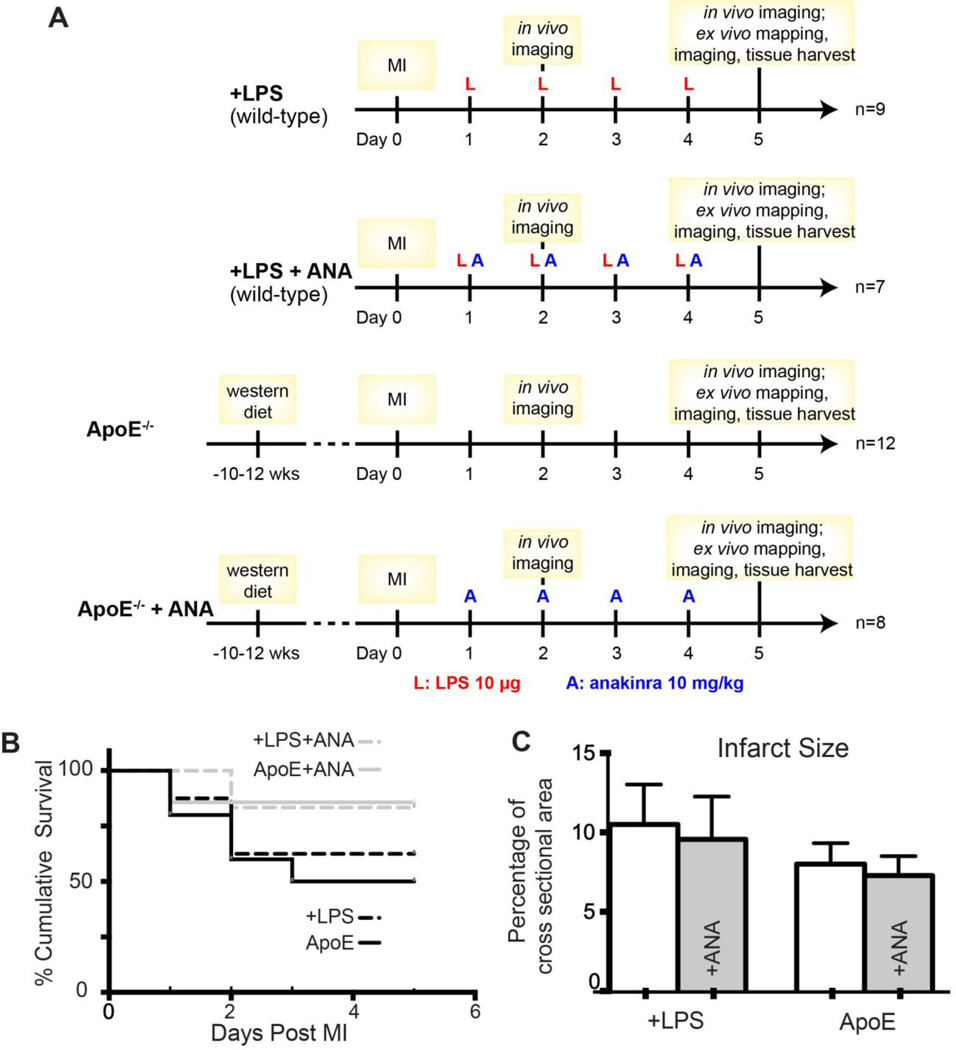
Methods: MI was created in 2 murine models of elevated inflammation: atherosclerotic on the Western diet or wild-type with a subseptic dose of lipopolysaccharide. The role of IL-1β was assessed with the IL-1 receptor antagonist anakinra (10 mg/(kg·d), starting 24 hours post-MI).

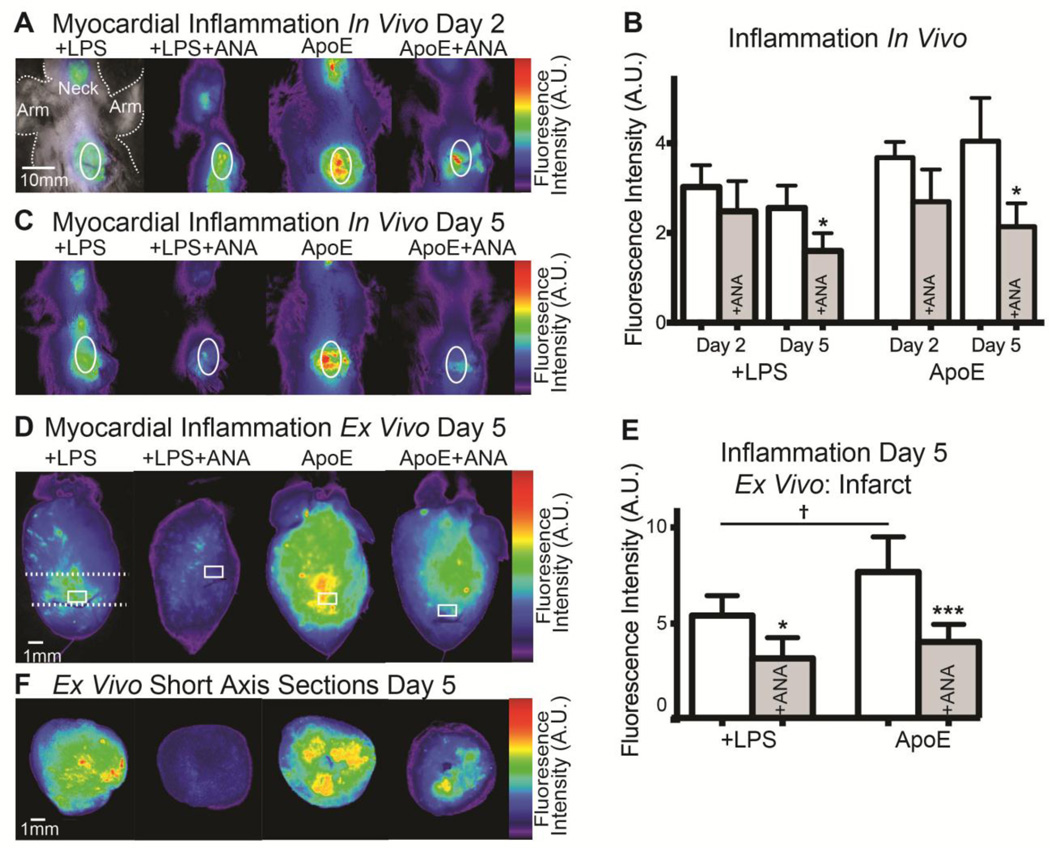
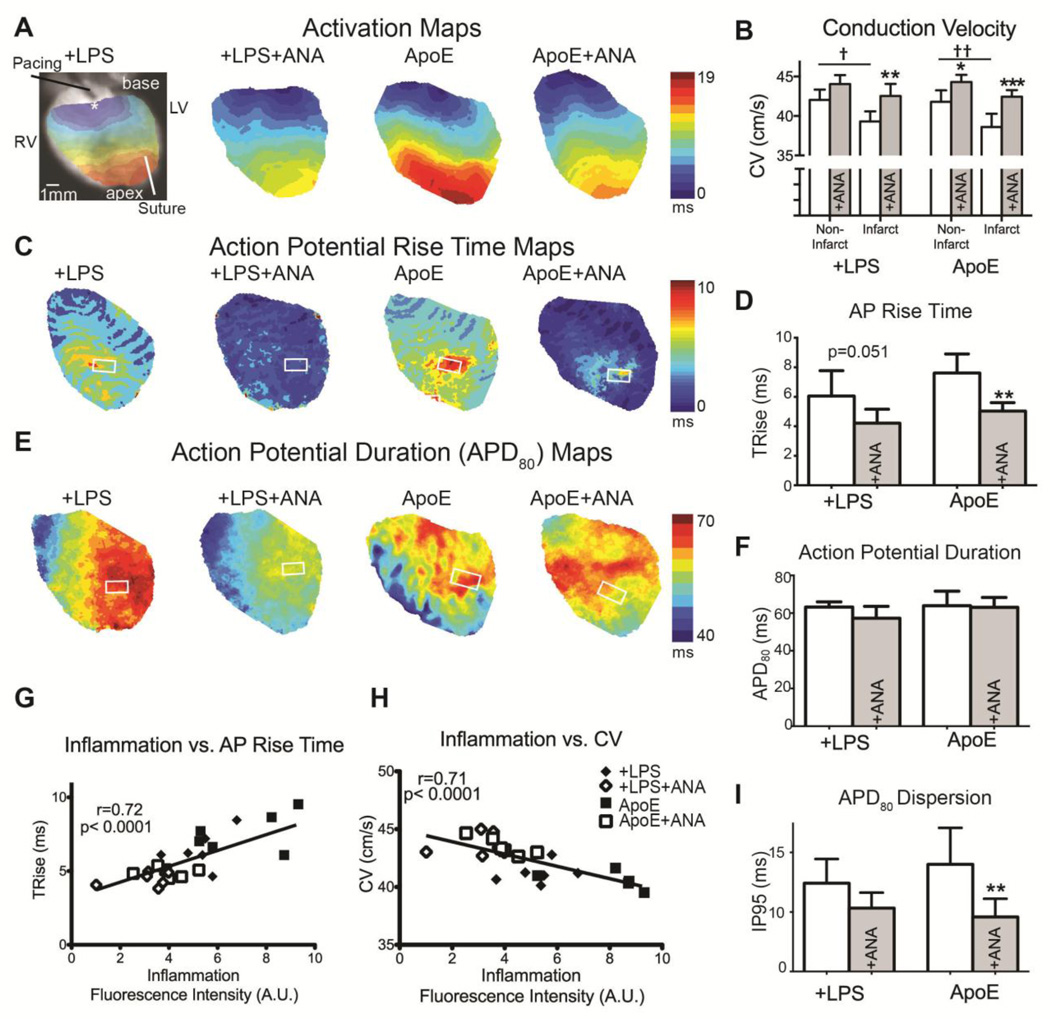
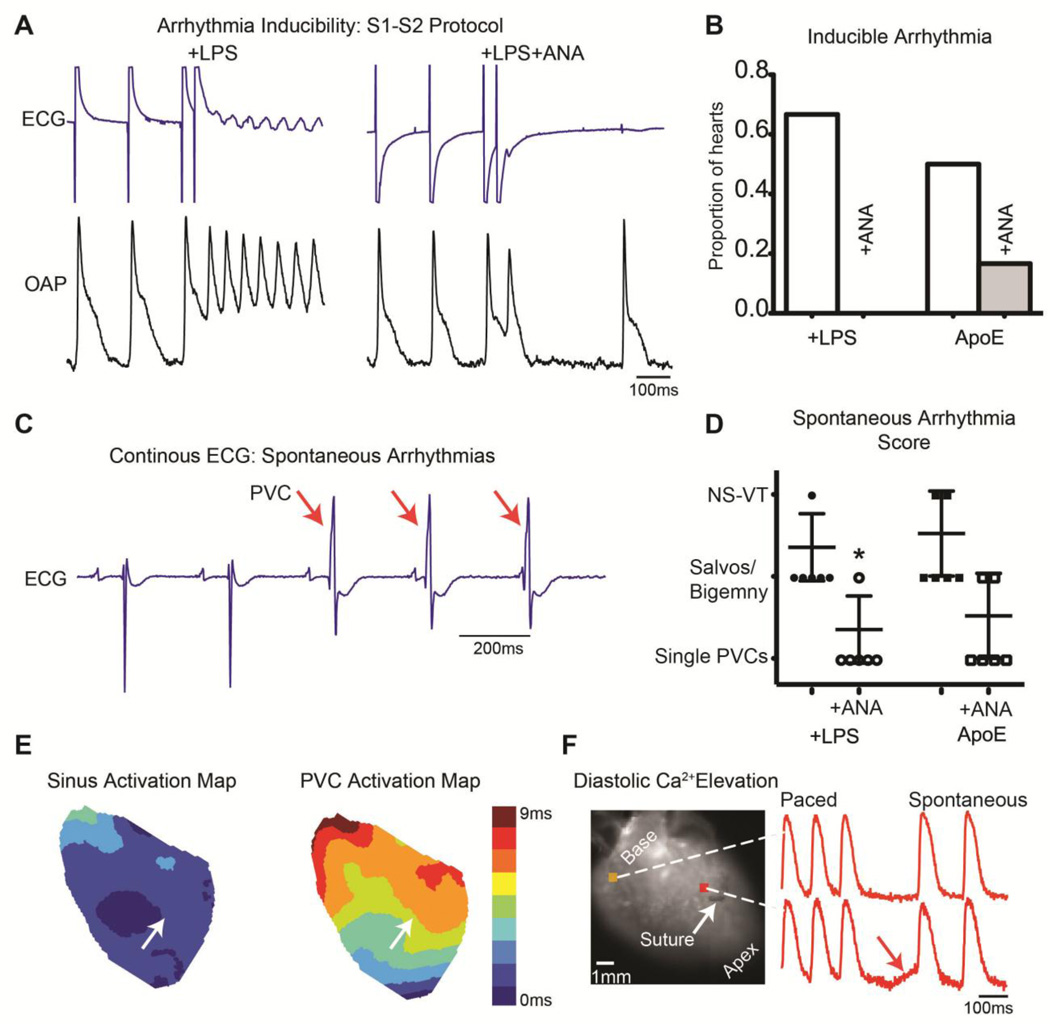
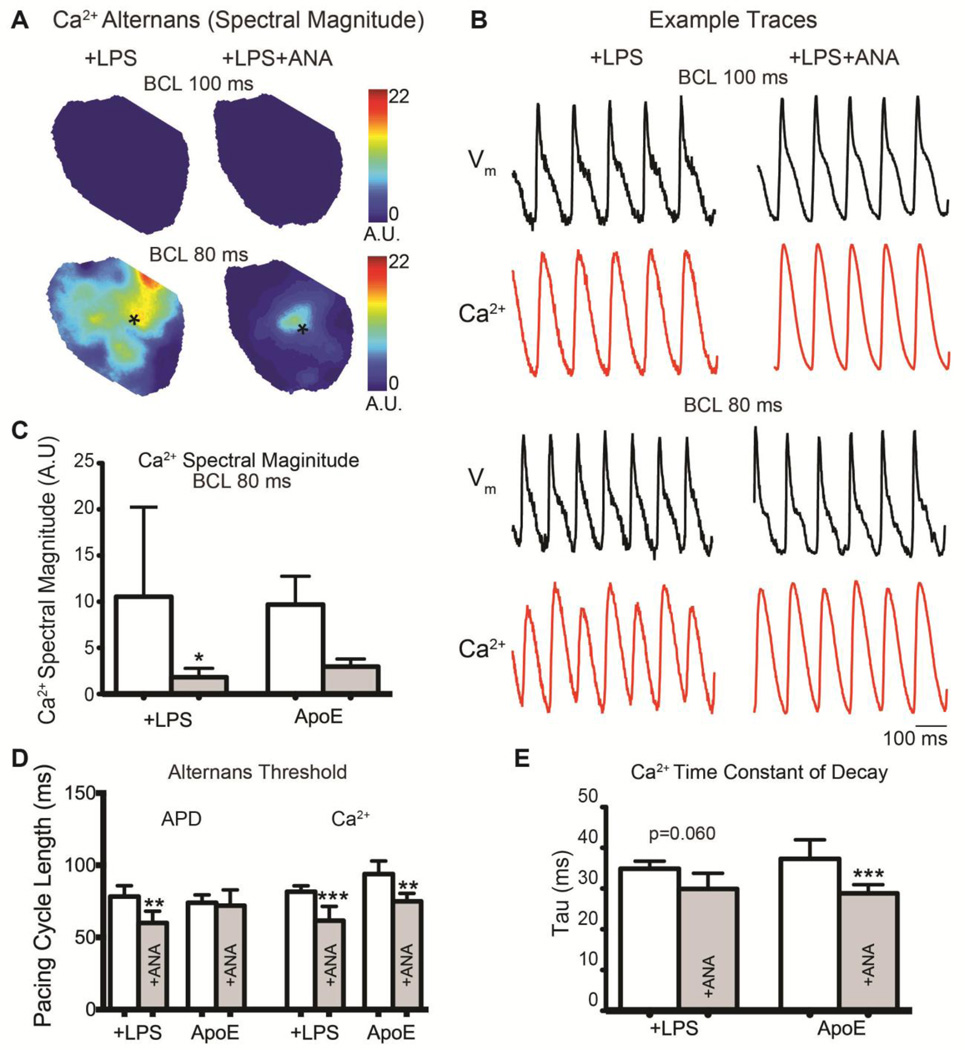
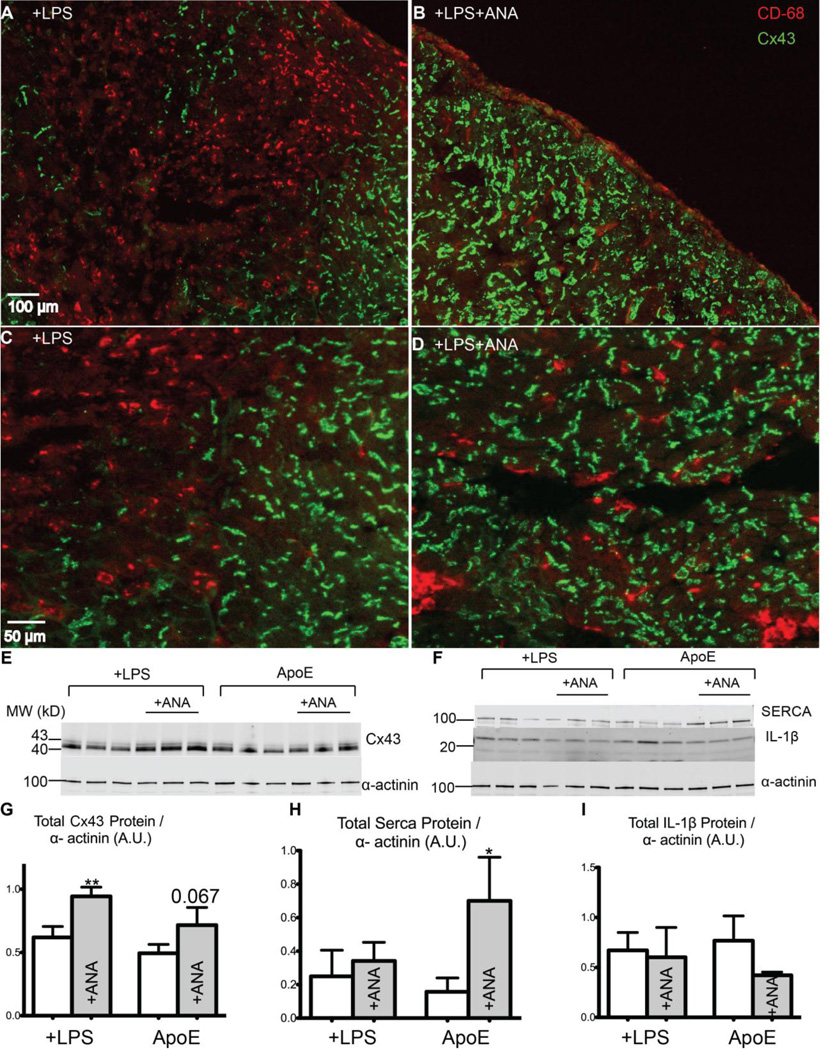
Results: In vivo and ex vivo molecular imaging showed reduced myocardial inflammation after a 4-day course of anakinra treatment, despite no change in infarct size. At day 5 post-MI, high-speed optical mapping of transmembrane potential and intracellular Ca2+ in isolated hearts revealed that IL-1β inhibition improved conduction velocity, reduced action potential duration dispersion, improved intracellular Ca2+ handling, decreased transmembrane potential and Ca2+ alternans magnitude, and reduced spontaneous and inducible ventricular arrhythmias. These functional improvements were linked to increased expression of connexin 43 and sarcoplasmic reticulum Ca2+-ATPase.

Conclusion: This study revealed a novel mechanism for IL-1β in contributing to defective excitation-contraction coupling and arrhythmogenesis in the post-MI heart. Our results suggest that inhibition of IL-1 signaling post-MI may represent a novel antiarrhythmic therapy.

Keywords: Action potentials; Antiarrhythmic agents; Calcium; Interleukins; Myocardial infarction.


Conflict of interest statement

Conflicts of Interest: None.

Figures

Figure 1
Figure 1
A) Experimental design. B) Post-MI survival. C) Infarct size. ANA: anakinra.
Figure 2
Figure 2
A) In vivo imaging of ProSense750 at day 2 post-MI. White oval indicates heart. The neck also shows mild inflammation due to a surgical incision to ensure intubation. B) No significant differences in myocardial inflammation are observed at day 2, but significant reductions are observed by day 5 in both ANA-treated groups. C) In vivo imaging of ProSense750 at day 5 post-MI. D) Ex vivo imaging of ProSense750 from isolated hearts at day 5 post-MI. White box indicates infarct region of interest (ROI). E) Quantification of ex vivo infarct ROI fluorescence. F) Ex vivo imaging of ProSense750 in short-axis slices. Dashed white line in (D) indicates location of slice. *p<0.05, ***p<0.001 +LPS vs. +LPS+ANA or ApoE vs. ApoE+ANA. †p<0.05 +LPS vs. ApoE.
Figure 3
Figure 3
A) Activation maps during LV pacing. B) CV was assessed in the non-infarct (area proximal to the suture) and infarct (area distal to the suture) regions. Untreated hearts had significantly slower CVs in the infarct vs. non-infarct regions. These differences were mitigated with ANA. Additionally, ANA treatment significantly improved CV in the infarct region of treated vs. untreated hearts. C) Maps of action potential rise time (TRise). D) TRise from the infarct region (white box in C). E) Maps of action potential duration at 80% repolarization (APD80). F) No significant differences were observed in APD80 in the infarct region (white box in E). G) When all groups were pooled, a significant positive correlation was observed between inflammation intensity (ProSense750 fluorescence) and TRise in the infarct ROI. H) A significant negative correlation was observed between inflammation intensity and mean CV. I) APD dispersion was calculated across the entire epicardial field of view as the inner 95th percentile (IP95: range over which 95% of the data lie). †p<0.05, ††p<0.01 non-infarct vs. infarct; *p<0.05, **p<0.01, ***p<0.001 +LPS vs. +LSP+ANA or ApoE vs. ApoE+ANA.
Figure 4
Figure 4
A) Example S1–S2 pacing protocol in which a reentrant arrhythmia was induced in a +LPS but not +LPS+ANA heart. B) Proportion of hearts with inducible arrhythmias. C) Example ECG from an ApoE heart with 3 spontaneous PVCs indicated with red arrows. D) ANA treatment significantly reduced the severity of spontaneous arrhythmias in +LPS hearts. E) Activation map during sinus rhythm (left) and PVC (right) from a +LPS heart. White arrow indicates suture location. Note the slower total activation time and different pattern of activation during the PVC, with earliest activation emerging apical to the infarct. F) Example of diastolic Ca2+ elevation following rapid pacing. The final 3 paced beats are shown followed by a diastolic interval in which spontaneous diastolic Ca2+ elevation is observed in the infarct region of an untreated ApoE heart. In this example, diastolic Ca2+ elevation is interrupted by a sinus beat. *p<0.05 +LPS vs. +LPS+ANA.
Figure 5
Figure 5
A) Maps of Ca2+ alternans spectral magnitude at BCL=100ms (top) and BCL=80ms (bottom). B) Example optical Vm and intracellular Ca2+ traces from the hearts shown in (A) with the signal location indicated with an asterisk. C) The average Ca2+ alternans spectral magnitude was quantified at BCL=80ms. D) The pacing cycle length at which hearts first displayed significant APD or Ca2+ alternans (spectral magnitude ≥ 2). E) The time constant of decay (tau) of the intracellular Ca2+ transient. *p<0.05, **p<0.01, ***p<0.001 +LPS vs. +LPS+ANA or ApoE vs. ApoE+ANA.
Figure 6
Figure 6
A–B) Immunohistochemistry images of the infarct area of a +LPS (A) and a +LPS+ANA (B) heart with CD68 staining for macrophages (red) and Cx43 staining (green). Note the abundant CD68-positive staining in the infarct region of the +LPS heart. C) Magnified image showing a near-complete loss of Cx43 in CD68-positive areas of a +LPS heart. D) Robust Cx43 expression in a +LPS+ANA heart, even in areas of CD68-positive cells. E) Immunoblot of Cx43 and α-actinin (loading control). F) Immunoblot of SERCA, IL-1β, and α-actinin. G) Total Cx43 protein expression. H) Total SERCA protein expression. I) Total IL-1β protein expression. *p<0.05, **p<0.01 +LPS vs. +LPS+ANA or ApoE vs. ApoE+ANA.

Comment in

References

    1. Mozaffarian D, Benjamin EJ, Go AS, et al. Heart Disease and Stroke Statistics-2016 Update: A Report From the American Heart Association. Circulation. 2016;133:e38–e360. - PubMed
    1. Libby P. Inflammation in atherosclerosis. Nature. 2002;420:868–874. - PubMed
    1. Panizzi P, Swirski FK, Figueiredo JL, Waterman P, Sosnovik DE, Aikawa E, Libby P, Pittet M, Weissleder R, Nahrendorf M. Impaired infarct healing in atherosclerotic mice with Ly-6C(hi) monocytosis. J Am Coll Cardiol. 2010;55:1629–1638. - PMC - PubMed
    1. Nahrendorf M, Swirski FK, Aikawa E, Stangenberg L, Wurdinger T, Figueiredo JL, Libby P, Weissleder R, Pittet MJ. The healing myocardium sequentially mobilizes two monocyte subsets with divergent and complementary functions. J Exp Med. 2007;204:3037–3047. - PMC - PubMed
    1. De Jesus NM, Wang L, Herren AW, Wang J, Shenasa F, Bers DM, Lindsey ML, Ripplinger CM. Atherosclerosis exacerbates arrhythmia following myocardial infarction: Role of myocardial inflammation. Heart Rhythm. 2015;12:169–178. - PMC - PubMed

Publication types

MeSH terms

Substances