. 2017 Jul;31(7):1502-1512.
doi: 10.1038/leu.2017.36. Epub 2017 Jan 23.

Differential signaling networks of Bcr-Abl p210 and p190 kinases in leukemia cells defined by functional proteomics

Affiliations

Differential signaling networks of Bcr-Abl p210 and p190 kinases in leukemia cells defined by functional proteomics

S Reckel et al. Leukemia. 2017 Jul.

Abstract

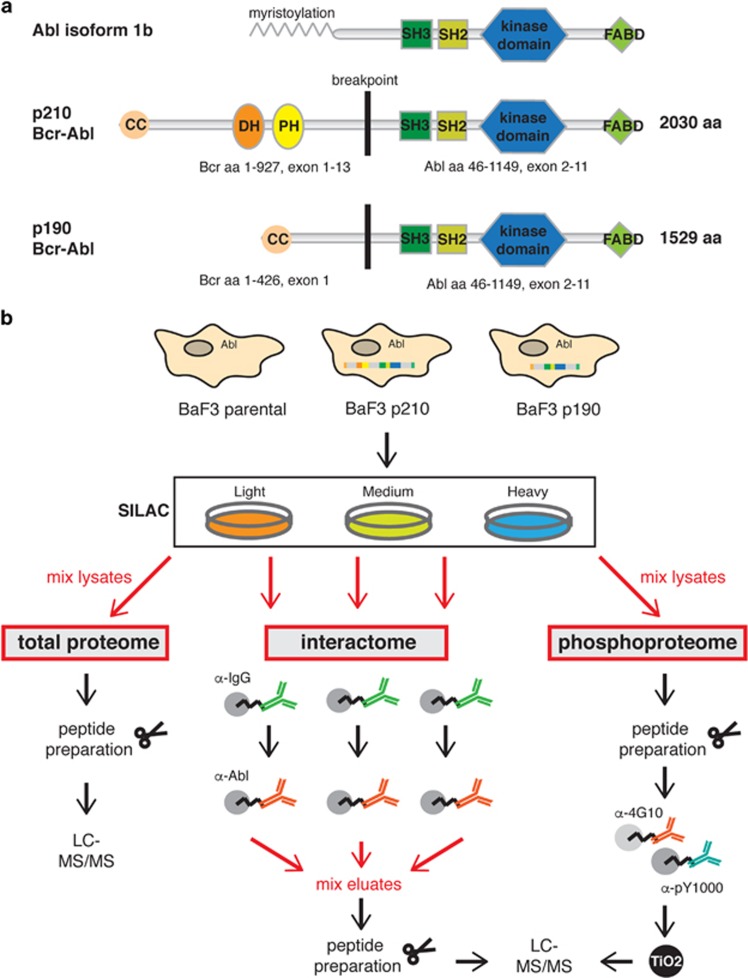
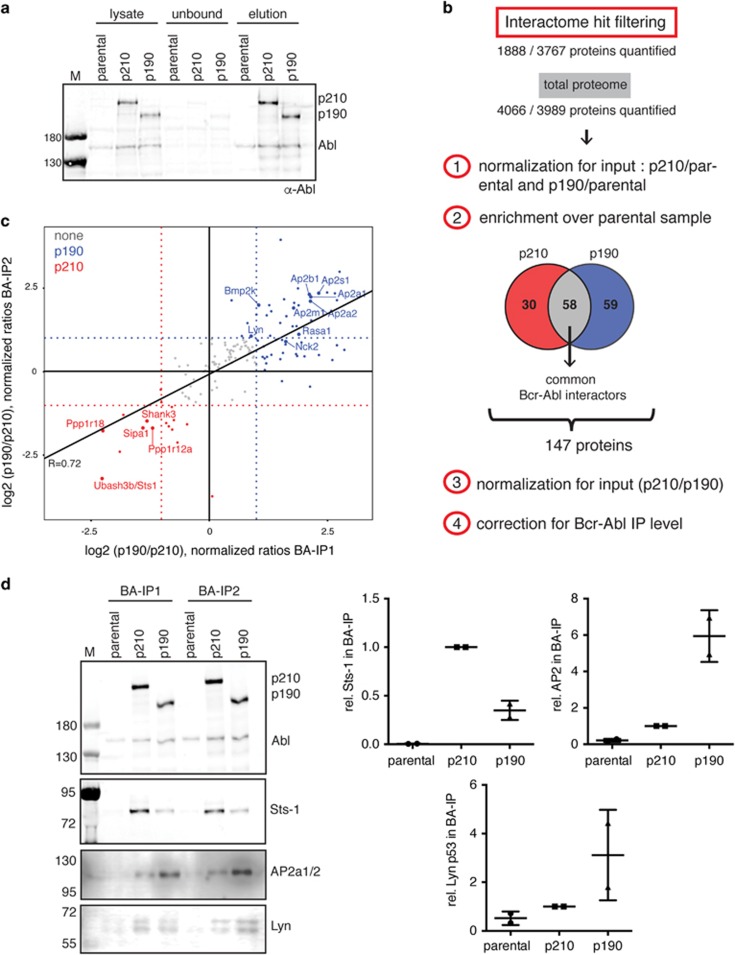
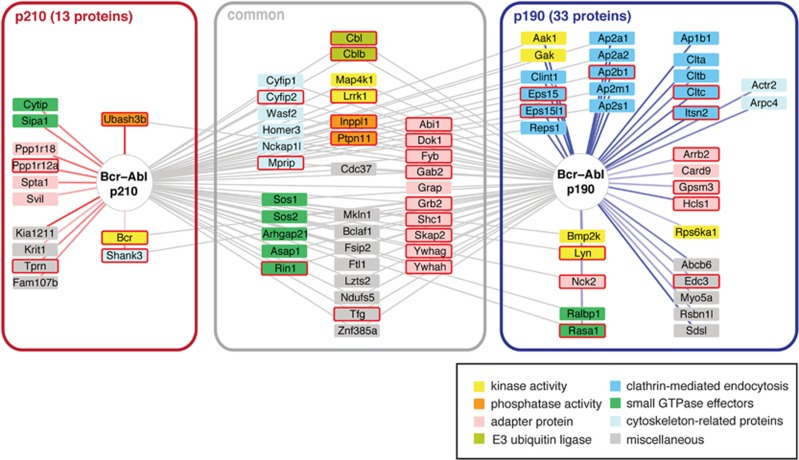
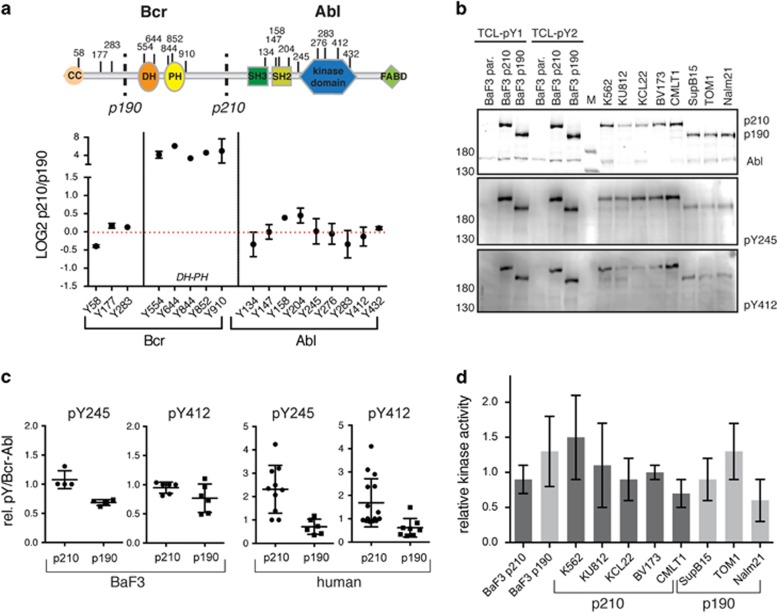
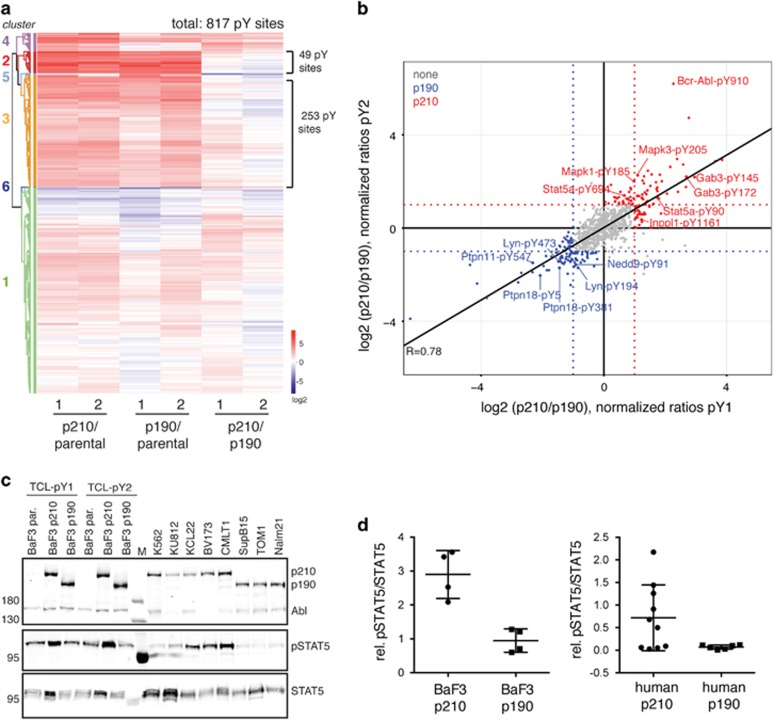
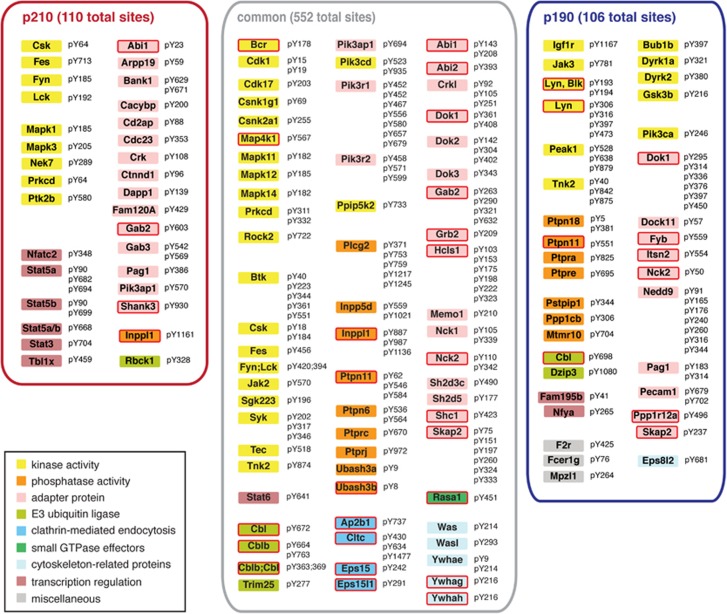
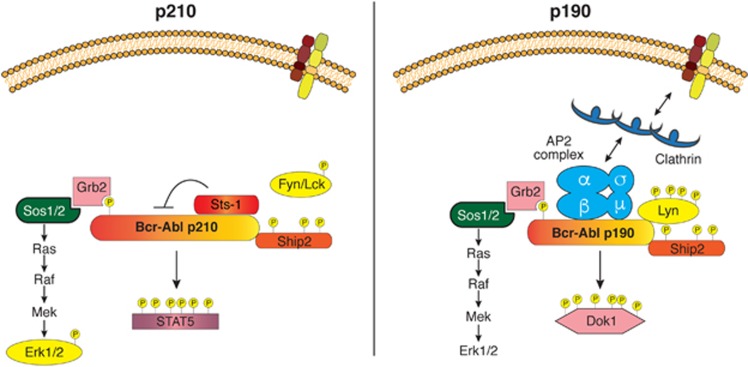
The two major isoforms of the oncogenic Bcr-Abl tyrosine kinase, p210 and p190, are expressed upon the Philadelphia chromosome translocation. p210 is the hallmark of chronic myelogenous leukemia, whereas p190 occurs in the majority of B-cell acute lymphoblastic leukemia. Differences in protein interactions and activated signaling pathways that may be associated with the different diseases driven by p210 and p190 are unknown. We have performed a quantitative comparative proteomics study of p210 and p190. Strong differences in the interactome and tyrosine phosphoproteome were found and validated. Whereas the AP2 adaptor complex that regulates clathrin-mediated endocytosis interacts preferentially with p190, the phosphatase Sts1 is enriched with p210. Stronger activation of the Stat5 transcription factor and the Erk1/2 kinases is observed with p210, whereas Lyn kinase is activated by p190. Our findings provide a more coherent understanding of Bcr-Abl signaling, mechanisms of leukemic transformation, resulting disease pathobiology and responses to kinase inhibitors.


Conflict of interest statement

The authors declare no conflict of interest.

Figures

Figure 1
Figure 1
Bcr–Abl domain organization and workflow of the proteomics experiments. (a) The Abl tyrosine kinase and the two isoforms of the fusion protein Bcr–Abl, p210 and p190, are shown with their sizes and domain arrangement. The p210 isoform is 501 amino acids longer than p190 as it contains the DH–PH tandem domain. Domain abbreviations: CC, coiled-coil; DH, Dbl-homology; PH, Pleckstrin-homolgy; SH3/SH2, Src-homology 3/2; FABD, F-actin binding domain. (b) SILAC labeling was employed to allow quantitative comparison of three BaF3 cell lines (Supplementary Table S1). BaF3 parental cells express Abl endogenously. BaF3 p210 and BaF3 p190 cells express human Bcr–Abl p210 and p190. An immunoaffinity purification strategy was used to enrich for Bcr–Abl complexes for the interactome analysis and sample mixing was performed just prior to peptide preparation. For analysis of the tyrosine phosphoproteome cell lysates were mixed prior to enrichment of the pY peptides using the pY1000 and 4G10 antibodies and an additional TiO2 purification step. For both experiments, the analysis of the total proteome served for different normalization steps. LC-MS, liquid chromatography-mass spectrometry.
Figure 2
Figure 2
Analysis of the Bcr–Abl p210 and p190 interactome. (a) Quality control anti-Abl immunoblot after immunoaffinity purification of the Bcr–Abl complexes for a representative experiment. For the lysate samples 50 μg of total protein was loaded and an equivalent volume was used for the unbound fraction. The ratio of the two Bcr–Abl isoforms p210:p190 was 1.4:1 in the eluate, which was in accordance with the quantification by mass spectrometry (Supplementary Figure S1). For the elution fraction, 0.7% of the total SILAC eluate was loaded and quantification of bands enabled the calculation of the immunoprecipitation (IP) efficiency/Bcr–Abl complex recovery of 29% of the input amount. (b) Schematic representation of filtering criteria to select the differential Bcr–Abl interactors. Quantified proteins (1888 and 3767 proteins, respectively) were normalized to their input amounts (4066 and 3989 proteins quantified, respectively) and only those proteins with significant enrichment (according to Significance B) over the parental control were selected. This reduced number of proteins were further normalized for the Bcr–Abl IP amounts and finally selected if differentially enriched by at least twofold. A detailed description of the data analysis workflow is described in the Supplementary Methods. (c) Scatter plot representation depicting the final list of 147 Bcr–Abl interactors (see panel b) with the respective log2 ratios in both experiments (Bcr–Abl (BA) IP1 and IP2) showing an overall good correlation (R=0.72). Those proteins considered differential are colored in red (p210) and blue (p190). Selected proteins are highlighted with bigger dot size and gene name labels. (d) Validation of differential Bcr–Abl interactors by immunoblotting. Elution fractions of both replicates were analyzed corresponding to 0.7% of the total SILAC elution fraction. We chose to validate the interactome hits Ubash3b/Sts1 (enriched in p210) and AP2a1/2 and Lyn (both enriched in p190). The quantified signal after correction for the Bcr–Abl IP amounts is shown on the right side. Individual values are plotted together with the mean±s.d.
Figure 3
Figure 3
Network of Bcr–Abl interacting proteins. Common and differential interactors of Bcr–Abl p210 and p190 are shown and summarized in Supplementary Tables S4 and S5. Connections for the differential interactors are color-coded according to their log2 ratios (from ‘light red’ for a weak p210 enrichment to ‘dark red’ for a strong p210 enrichment; ‘light blue’ for a weak p190 enrichment to ‘dark blue’ for a strong p190 enrichment). Boxes around the individual proteins are color-coded according to the function and a red frame indicates that the protein was also found phosphorylated in the phosphoproteome analysis. Note that certain proteins enriched with either of the two Bcr–Abl isoforms can also interact with the other isoform and thus have a connection to both proteins.
Figure 4
Figure 4
Bcr–Abl p210 and p190 phosphorylation sites and kinase activity. (a) Several Bcr–Abl pY sites were quantified in our phosphoproteome data set. The domain organization and location of the pY sites are shown and the sites are plotted together with their respective log2 ratio between p210/p190. Dots represent mean values ±s.d. Five out of the 17 sites could only be quantified in one experiment. Residues are numbered according to the Bcr and Abl 1b protein numbering. (b) Immunoblot analysis of the two autophosphorylation sites that are important for Abl catalytic activity: pY245 and pY412. Equal amounts of total cell lysates of the indicated BaF3 and human p210 and p190 expressing cell lines were loaded, immunoblotted with the indicated antibodies and quantified (see (c)). Note that only Bcr–Abl is phosphorylated on Y245 and Y412, while Abl is not or only very weakly phosphorylated on these sites. (c) Quantified pY245 and pY412 immunoblot signals (from panel (b)) after normalization to the total Bcr–Abl protein in BaF3 (left two graphs) or human cell lines (right two graphs). Individual values are plotted together with the mean±s.d. (d) Bcr–Abl was immunoprecipitated from the indicated BaF3 and human p210 and p190 cell lines and a radioactive in vitro kinase activity was performed measuring phosphotransfer to an optimal Abl substrate peptide. Each kinase assay was run in triplicate for each immunoprecipitate and the resulting averaged activity value was normalized to the Bcr–Abl amount determined by immunoblot analysis. The bar graph shows the mean±s.d. from three biological replicates.
Figure 5
Figure 5
Bcr–Abl pY phosphoproteome. (a) Heatmap representation of the 817 quantified phosphosites and their respective ratios in the comparison of the three samples: BaF3 parental, BaF3 p210 and BaF3 p190. The two biological replicates are plotted next to each other. The six clusters identified by unsupervised hierarchical clustering are highlighted. (b) Scatter plot for the normalized log2 ratios between the p210 and p190 Bcr–Abl samples (without correction for the total protein levels) in both biological replicates (pY1 and pY2). Each dot is representative of a phosphopeptide. Those pY sites considered as differential are colored in red (p210) and blue (p190). Selected phosphorylation sites are labeled. (c, d) Immunoblot validation of Stat5 pY694 using the BaF3 and human cell line panel. The quantified signals of two technical replicates were normalized to the total Stat5 protein and individual values are plotted together with the mean±s.d.
Figure 6
Figure 6
Selected phosphorylation events of p210 and p190 Bcr–Abl. A selection of differential and common Bcr–Abl phosphorylation sites that were found in the pY data set is shown. The complete data set is listed in Supplementary Table S6. Boxes around the individual proteins are color-coded according to their function and a red frame indicates that a protein was also found in the interactome analysis.
Figure 7
Figure 7
Model of differential signaling networks of p210 and p190 Bcr–Abl. The main differences in Bcr–Abl interactors and phosphorylated proteins between p210 and p190 that we found, validated and discussed in this paper are summarized in this figure. As examples for common interactors/pY sites, the Ship2 phosphatase and the interaction of the Grb2/Sos complex with pY177 are shown. p210 shows stronger association with the Sts1 phosphatase and higher activation of the Stat5 transcription factor, as well as the Erk1/2 and Fyn/Lck kinases. p190 shows stronger association with the AP2 complex and clathrin, and higher activation of the Dok1 adaptor and the Lyn kinase.

References

    1. O'Hare T, Zabriskie MS, Eiring AM, Deininger MW. Pushing the limits of targeted therapy in chronic myeloid leukaemia. Nat Rev Cancer 2012; 12: 513–526. - PubMed
    1. Wong S, Witte ON. The BCR-ABL story: bench to bedside and back. Annu Rev Immunol 2004; 22: 247–306. - PubMed
    1. Deininger MW, Goldman JM, Melo JV. The molecular biology of chronic myeloid leukemia. Blood 2000; 96: 3343–3356. - PubMed
    1. Hantschel O. Structure, regulation, signaling, and targeting of abl kinases in cancer. Genes Cancer 2012; 3: 436–446. - PMC - PubMed
    1. Gambacorti-Passerini C, Antolini L, Mahon F-X, Guilhot F, Deininger M, Fava C et al. Multicenter independent assessment of outcomes in chronic myeloid leukemia patients treated with imatinib. J Natl Cancer Inst 2011; 103: 553–561. - PubMed

Publication types

Substances

LinkOut - more resources