

A simulation study of methods for selecting subgroup-specific doses in phase 1 trials
- PMID: 28111916
- PMCID: PMC5352526
- DOI: 10.1002/pst.1797
A simulation study of methods for selecting subgroup-specific doses in phase 1 trials
Abstract
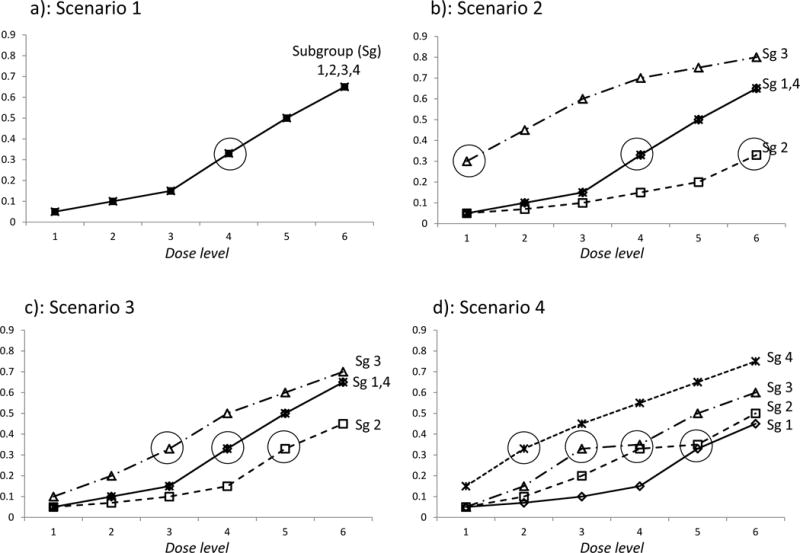
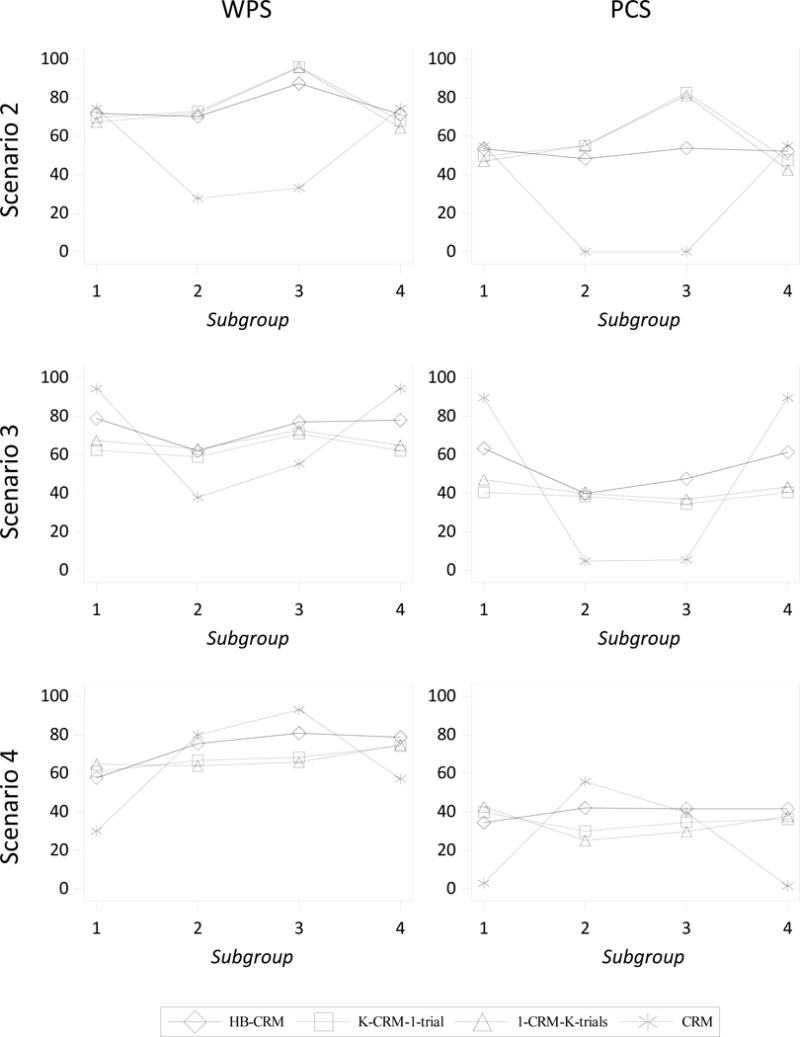
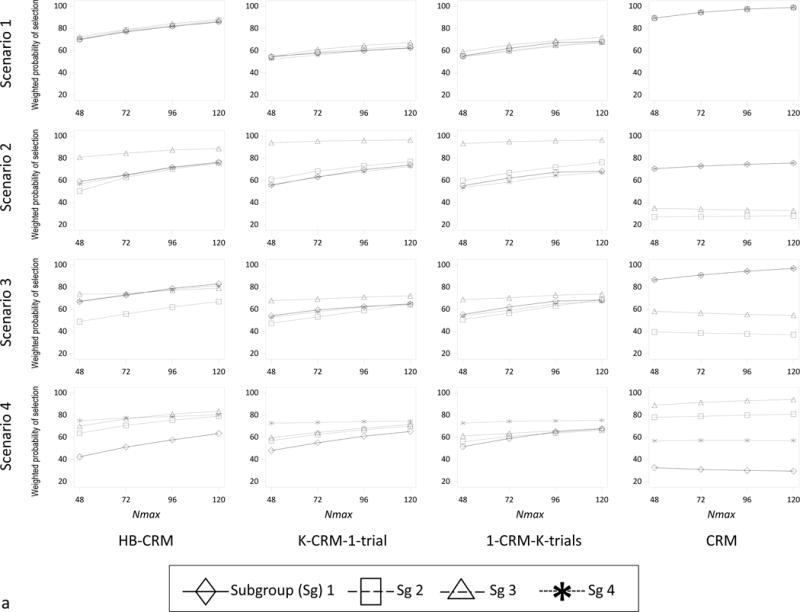
Patient heterogeneity may complicate dose-finding in phase 1 clinical trials if the dose-toxicity curves differ between subgroups. Conducting separate trials within subgroups may lead to infeasibly small sample sizes in subgroups having low prevalence. Alternatively,it is not obvious how to conduct a single trial while accounting for heterogeneity. To address this problem,we consider a generalization of the continual reassessment method on the basis of a hierarchical Bayesian dose-toxicity model that borrows strength between subgroups under the assumption that the subgroups are exchangeable. We evaluate a design using this model that includes subgroup-specific dose selection and safety rules. A simulation study is presented that includes comparison of this method to 3 alternative approaches,on the basis of nonhierarchical models,that make different types of assumptions about within-subgroup dose-toxicity curves. The simulations show that the hierarchical model-based method is recommended in settings where the dose-toxicity curves are exchangeable between subgroups. We present practical guidelines for application and provide computer programs for trial simulation and conduct.
Keywords: Bayesian study design; conditionally independent hierarchical model; continual reassessment method; phase 1 clinical trial; subgroup-specific dose-finding.
Copyright © 2017 John Wiley & Sons,Ltd.
Conflict of interest statement
Conflict of interest statement: There are no conflicts of interest in this study.
Figures


Similar articles
-
Subgroup-specific dose finding in phase I clinical trials based on time to toxicity allowing adaptive subgroup combination.Pharm Stat. 2018 Nov;17(6):734-749. doi: 10.1002/pst.1891. Epub 2018 Aug 15. Pharm Stat. 2018. PMID: 30112806 Free PMC article.
-
Practical model-based dose-finding in phase I clinical trials: methods based on toxicity.Int J Gynecol Cancer. 2003 May-Jun;13(3):251-61. doi: 10.1046/j.1525-1438.2003.13202.x. Int J Gynecol Cancer. 2003. PMID: 12801254 Review.
-
A comparison of phase I dose-finding designs in clinical trials with monotonicity assumption violation.Clin Trials. 2020 Oct;17(5):522-534. doi: 10.1177/1740774520932130. Epub 2020 Jul 7. Clin Trials. 2020. PMID: 32631095
-
Subgroup-specific dose finding for phase I-II trials using Bayesian clustering.Stat Med. 2022 Jul 20;41(16):3164-3179. doi: 10.1002/sim.9410. Epub 2022 Apr 16. Stat Med. 2022. PMID: 35429178 Free PMC article.
-
Software to compute and conduct sequential Bayesian phase I or II dose-ranging clinical trials with stopping rules.Comput Methods Programs Biomed. 2003 Oct;72(2):117-25. doi: 10.1016/s0169-2607(02)00120-7. Comput Methods Programs Biomed. 2003. PMID: 12941516 Review.
Cited by
-
Subgroup-specific dose finding in phase I clinical trials based on time to toxicity allowing adaptive subgroup combination.Pharm Stat. 2018 Nov;17(6):734-749. doi: 10.1002/pst.1891. Epub 2018 Aug 15. Pharm Stat. 2018. PMID: 30112806 Free PMC article.
-
A Phase I-II Basket Trial Design to Optimize Dose-Schedule Regimes Based on Delayed Outcomes.Bayesian Anal. 2021 Mar;16(1):179-202. doi: 10.1214/20-ba1205. Epub 2020 Mar 28. Bayesian Anal. 2021. PMID: 34267857 Free PMC article.
-
A nonparametric Bayesian continual reassessment method in single-agent dose-finding studies.BMC Med Res Methodol. 2018 Dec 18;18(1):172. doi: 10.1186/s12874-018-0604-9. BMC Med Res Methodol. 2018. PMID: 30563454 Free PMC article.
-
The Correlated Beta Dose Optimisation Approach: Optimal Vaccine Dosing Using Mathematical Modelling and Adaptive Trial Design.Vaccines (Basel). 2022 Oct 30;10(11):1838. doi: 10.3390/vaccines10111838. Vaccines (Basel). 2022. PMID: 36366347 Free PMC article.
-
Challenges, opportunities, and innovative statistical designs for precision oncology trials.Ann Transl Med. 2022 Sep;10(18):1038. doi: 10.21037/atm-22-356. Ann Transl Med. 2022. PMID: 36267789 Free PMC article. Review.
References
-
- O’Quigley J, Pepe M, Fisher L. Continual reassessment method: a practical design for phase 1 clinical trials in cancer. Biometrics. 1990;46:33–48. - PubMed
-
- O’Quigley J, Shen LZ, Gamst A. Two-sample continual reassessment method. J Biopharm Stat. 1999;9:17–44. - PubMed
-
- O’Quigley J, Paoletti X. Continual reassessment method for ordered groups. Biometrics. 2003;59:430–440. - PubMed
-
- Ivanova A, Wang K. Bivariate isotonic design for dose-finding with ordered groups. Biometrics. 2006;25:2018–2026. - PubMed
Publication types
MeSH terms
Substances
Grants and funding
LinkOut - more resources
Full Text Sources
Other Literature Sources
