Review
. 2017 Jan;9(2):223-243.
doi: 10.4155/fmc-2016-0190. Epub 2017 Jan 23.

A tale of two glutaminases: homologous enzymes with distinct roles in tumorigenesis

Affiliations
Review

A tale of two glutaminases: homologous enzymes with distinct roles in tumorigenesis

William P Katt et al. Future Med Chem. 2017 Jan.

Erratum in

  • Corrigendum.
    [No authors listed] [No authors listed] Future Med Chem. 2017 Apr;9(5):527. doi: 10.4155/fmc-2016-0190c1. Epub 2017 Mar 23. Future Med Chem. 2017. PMID: 28332860 Free PMC article. No abstract available.

Abstract

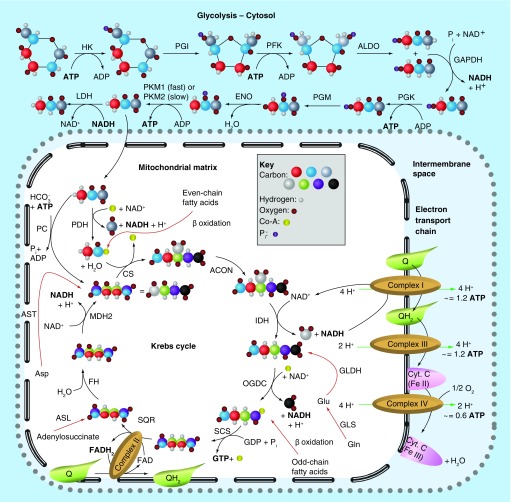
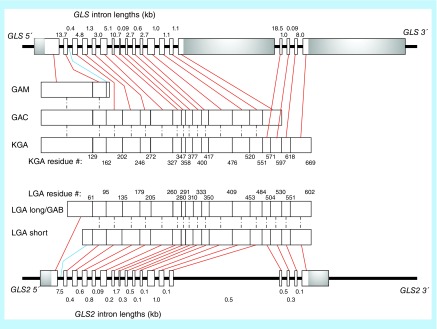
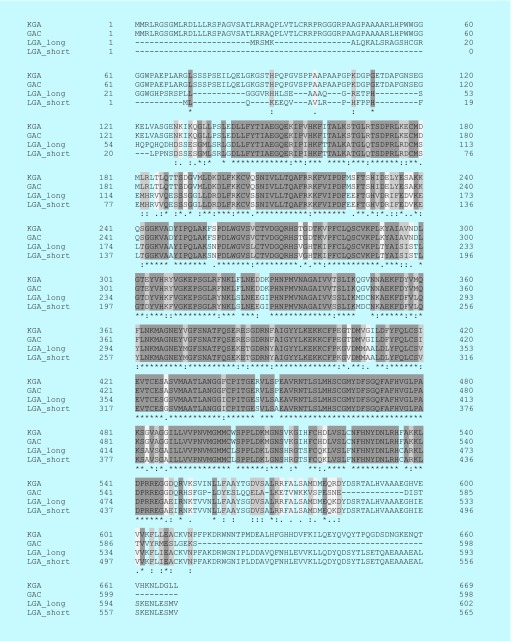
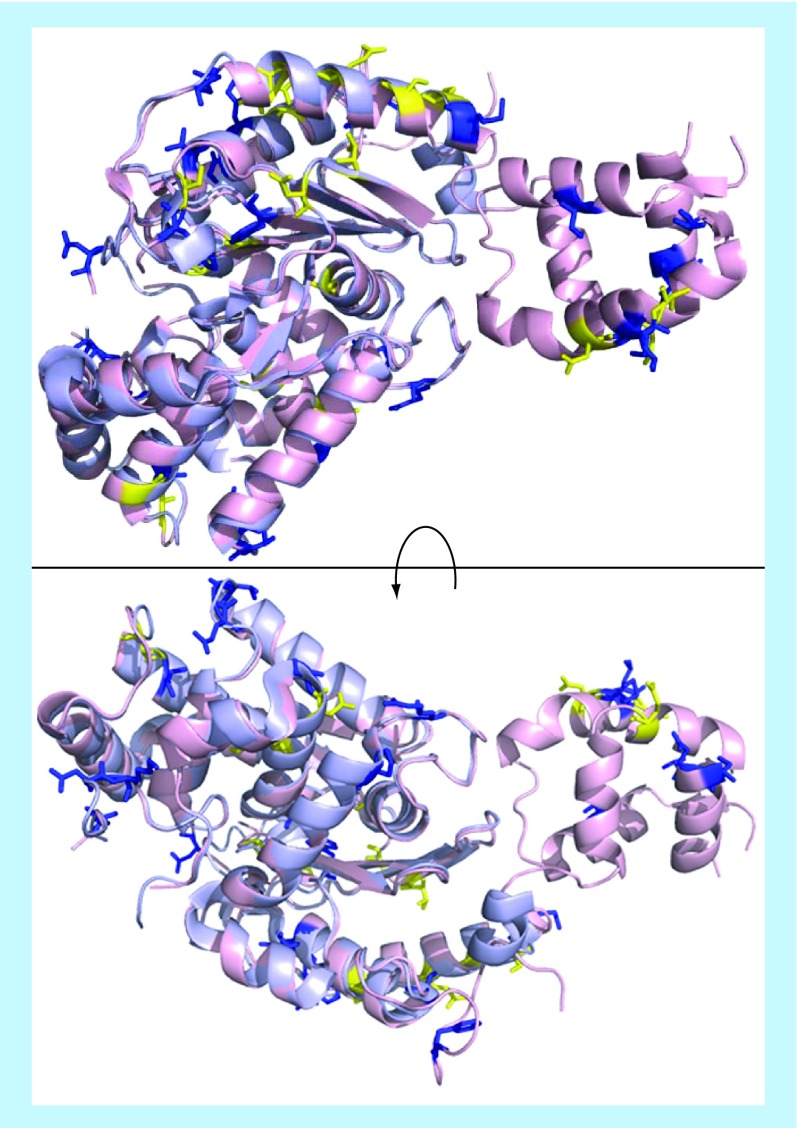
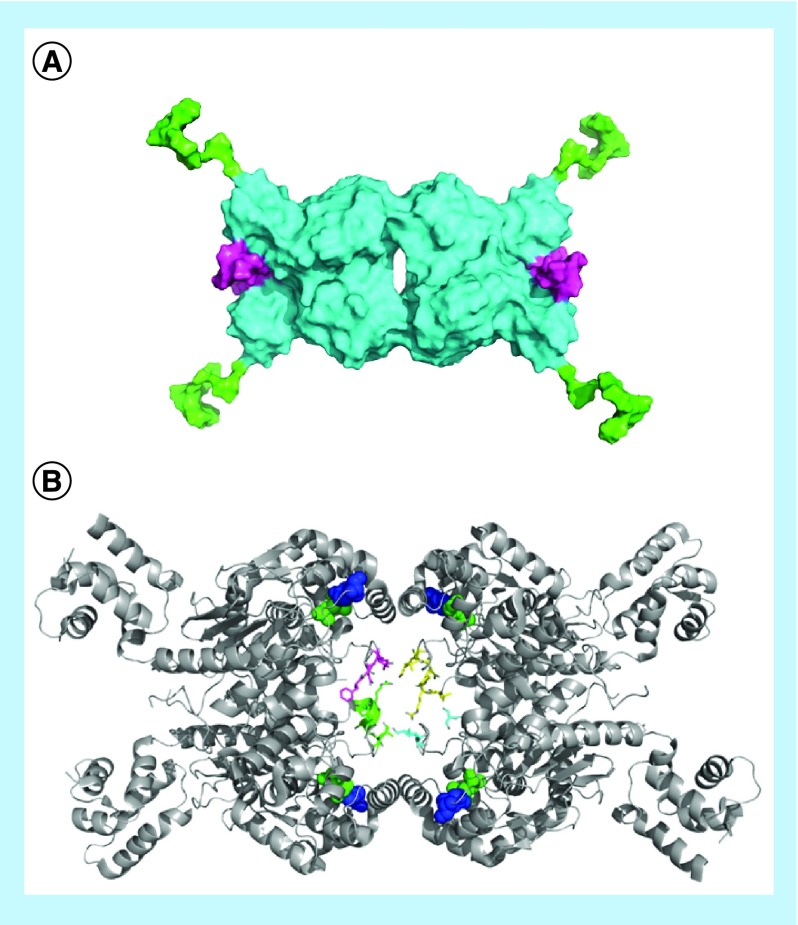
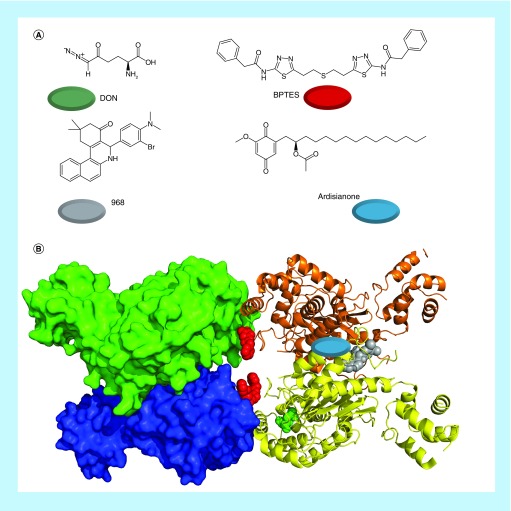
Many cancer cells exhibit an altered metabolic phenotype, in which glutamine consumption is upregulated relative to healthy cells. This metabolic reprogramming often depends upon mitochondrial glutaminase activity, which converts glutamine to glutamate, a key precursor for biosynthetic and bioenergetic processes. Two isozymes of glutaminase exist, a kidney-type (GLS) and a liver-type enzyme (GLS2 or LGA). While a majority of studies have focused on GLS, here we summarize key findings on both glutaminases, describing their structure and function, their roles in cancer and pharmacological approaches to inhibiting their activities.

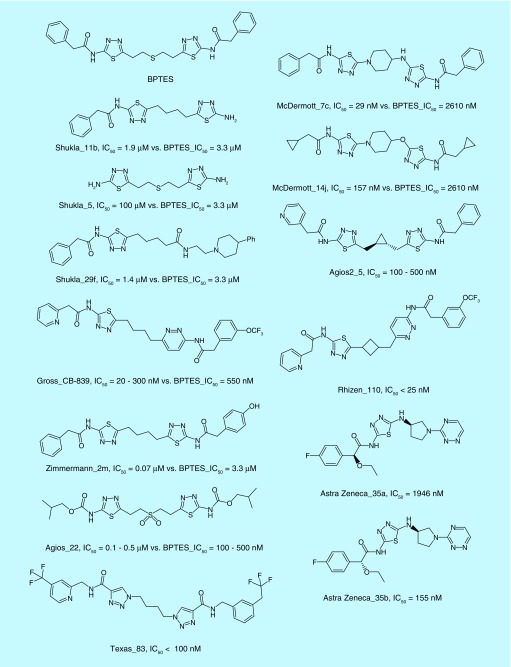
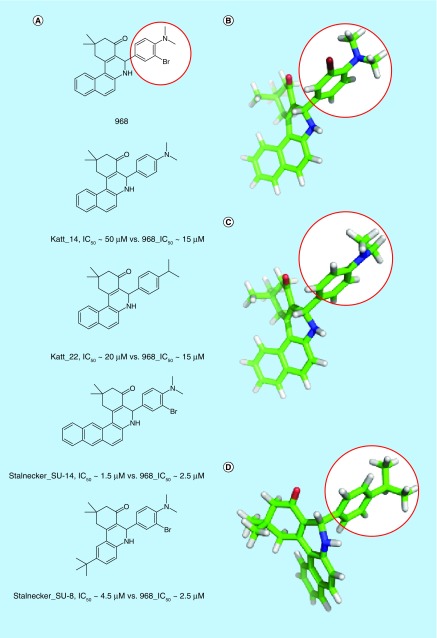
Keywords: 968; BPTES; CB-839; Warburg effect; cancer; glutaminase; inhibitor; metabolism.


Conflict of interest statement

Financial & competing interests disclosure

This work was supported by funding from the NIH (GM040654, GM047458, CA201402). The authors have no other relevant affiliations or financial involvement with any organization or entity with a financial interest in or financial conflict with the subject matter or materials discussed in the manuscript apart from those disclosed.

No writing assistance was utilized in the production of this manuscript.

Figures

<b>Figure 1.</b>
Figure 1.. Schematic overview of cellular energetics.
Three primary metabolic pathways supply cells with biosynthetic intermediates and ATP: glycolysis (top), the Krebs cycle (left) and the electron transport chain (right and bottom). Glycolysis converts glucose to pyruvate, and consumes two molecules of ATP in the process, but splits glucose into two molecules (top right), further conversions of which eventually produce two ATPs each, for a net total of two ATPs. Two NADHs are also generated, which can fuel the electron transport chain. Pyruvate then enters the mitochondria where it is used to generate acetyl-CoA for the Krebs cycle, or exits the cell as lactate (regenerating NAD+ and allowing glycolysis to continue). The Krebs cycle turns once per acetyl-CoA molecule fed in, and so turns twice per molecule of glucose. Each turn of the Krebs cycle produces four molecules of NADH, one molecule of GTP and one molecule of FADH2. NADH enters the electron transport chain at Complex 1, which reduces membrane soluble ubiquinone (Q) to ubiquinol (QH2), and exports four protons to the intermembrane space (IMS). Complex III transfers electrons from QH2 to membrane-anchored cytochrome C, reducing the bound heme and simultaneously exports a further four protons to the IMS. Finally, Complex IV uses molecular oxygen to re-oxidize cytochrome C, and exports another 2 protons to the IMS per unit of NADH. Complex II (i.e., SQR) generates FADH2 to reduce Q to QH2, but without any proton transport. Every ten protons exported can ideally generate three units of ATP via ATP synthase (not shown), for a total of 34 ATP molecules (∼3 per NADH, ∼2 per FADH2 generated during cellular metabolism) and two GTP molecules per glucose molecule, but proton leakage and the use of protons to transport pyruvate and phosphate into the matrix reduce this number to approximately 29–31 ATP/GTP molecules formed per glucose molecule. The Krebs cycle can be supplied with intermediates from five sources in addition to glucose, shown with red arrows. Carbon atoms are represented by large spheres of different colors, and are given mixed colors to represent the point at which molecules gain symmetry and unique carbons become mixed; none of the pyruvate carbon atoms used to form citrate leave as CO2 during a single turn of the Krebs cycle. Hydrogens are shown only on carbon, to assist in tracing oxidation states. Anaplerotic reactions are shown as red arrows, and proton transport is shown by green arrows. ACON: Aconitase; ALDO: Aldolase; ASL: Adenylosuccinate lyase; AST: Aspartate transaminase; CS: Citrate Synthase; ENO: Enolase; FH: Fumarase; GAPDH: Glyceraldehyde phosphate dehydrogenase; GLDH: Glutamate dehydrogenase; GLS: Glutaminase; HK: Hexokinase; IDH: Isocitrade dehydrogenase; IMS: Intermembrane space; LDH: Lactate dehydrogenase; MDH2: Malate dehydrogenase; OGDC: α-Ketoglutarate dehydrogenase; PC: Pyruvate carboxylase; PDH: Pyruvate dehydrogenase; PFK: Phosphofructokinase; PGI: Phosphoglucose isomerase; PGK: Phosphoglycerate kinase; PGM: Phosphoglycerate mutase; PKM1/PKM2: Pyruvate Kinase M1/M2; Q: Ubiquinone; QH2: Ubiquinol; SCS: Succinyl coenzyme A synthetase; SQR: Succinate dehydrogenase.
<b>Figure 2.</b>
Figure 2.. Glutaminase gene and protein map.
The GLS gene is shown at the top, and the GLS2 gene is shown at the bottom. Proteins are drawn in the middle, with the shortest splice variants closest to the gene encoding them. Exons and protein segments encoded by them are represented by boxes, and are drawn to scale. Untranslated regions of 5′ and 3′ exons are shaded gray. Introns are represented by black lines and are not to scale; intron size is reported above or below each line. Protein segments are linked to encoding exons with red lines, and encoding introns with blue lines. Identical protein segments among splice variants are linked with dashed lines. The residue number at the end of each protein segment is labeled for the largest splice variant from each gene. Genes and proteins are aligned by homology. GLS and GLS2 show high homology in their exons, but GLS has substantially larger introns and untranslated regions of terminal exons. Data to generate this chart were taken from the RCSB Protein Data Bank, UniProtKB and Ensembl public data repositories. The smaller GLS2 isoform identified by Ota et al. is not included, due to uncertainty regarding its biological importance.
<b>Figure 3.</b>
Figure 3.. Alignment of the amino acid sequences of the major isoforms of glutaminase and liver-type glutaminase.
Sequences were aligned with Clustal Omega via UniProt.org. Darker regions are identical, while lighter regions have greater differences between the isoforms. Each residue position is also marked with the Clustal alignment scores, “*”, “:”, “.”, or “ ”, which represent positions with identical residues, residues with strongly similar properties, residues with weakly similar properties or residues which are entirely dissimilar, respectively. Most of the differences lie in the N- and C-termini of the enzymes.
<b>Figure 4.</b>
Figure 4.. Glutaminase C (light pink, crystal structure 5D3O) and liver-type glutaminase (light blue, crystal structure 4BQM) were aligned in PyMol.
Residues which are weakly similar or entirely dissimilar (Clustal alignment score of “.” or “ “, Figure 3) are drawn as sticks and shown in yellow and blue, respectively.
<b>Figure 5.</b>
Figure 5.. Structural and mechanistic insights into glutaminase activity.
(A) The small angle x-ray scattering envelope calculated for tetrameric glutaminase C (GAC) shows the N-terminal residues (green) extending away from the catalytic domain (blue), and the C-terminal residues (magenta) coiling close to the catalytic domain. The N- and C-terminal residues have not been resolved to date by x-ray crystallography. Figure adapted with permission from [70] © PLoS ONE (2013). (B) The tetrameric form of GAC (crystal structure 3UO9). The recently identified ‘gating’ or ‘activation’ loop is shown as sticks, colored by chain, at the center of the structure. As is common for x-ray structures of GAC, not all of the four loops are fully resolved. The tyrosine 249 ‘lid’ is shown as blue spheres, and glutamate in the catalytic site is shown as green spheres.
<b>Figure 6.</b>
Figure 6.. The most important classes of glutaminase inhibitors described in recent years.
(A) The nonselective inhibitor DON, the kidney-type glutamase and liver-type glutaminase inhibitor 968, the kidney-type glutaminase selective inhibitor BPTES and the liver-type glutaminase selective inhibitor ardisianone. The colored circles match the colors of the inhibitors below. (B) Tetrameric kidney-type glutamase (crystal structure 4JKT) with 968 docked to it (gray, on right). BPTES (red, in center) is overlayed from crystal structure 3UO9, as is DON (green, in yellow subunit) from crystal structure 4O7D. The described binding site for ardisianone on liver-type glutaminase is shown with a blue oval (right-hand subunits). BPTES: Bis-2-(5-phenylacetamido-1,2,4-thiadiazol-2-yl)ethyl sulfide; DON: 6-Diazo-5-oxo-l-norleucine.
<b>Figure 7.</b>
Figure 7.. Bis-2-(5-phenylacetamido-1,2,4-thiadiazol-2-yl)ethyl sulfide, and a selection of potent inhibitors derived from its scaffold, are shown.
Inhibitors are named by first author for academic publications, or patent assignee for patents, and then by the compound code within the relevant publication. IC50 values are reported for each compound. Because assay conditions varied between investigators, the value for bis-2-(5-phenylacetamido-1,2,4-thiadiazol-2-yl)ethyl sulfide (BPTES) in their assay system is also reported where available. BPTES: Bis-2-(5-phenylacetamido-1,2,4-thiadiazol-2-yl)ethyl sulfide.
<b>Figure 8.</b>
Figure 8.. 968 and select potent derivatives.
(A) Important compounds that help to elucidate the 968 structure–activity relationship. Compounds are labeled by first author of the reporting literature, and compound code within that manuscript. Because different assays were used for the two relevant studies, IC50 values are given for each value and for 968 as reported within that study. (B–D) 968 (B), Katt_14 (C) and Katt_22 (D), energy minimized in the MMFF94 forcefield. 968 and Katt_22, both potent compounds, have ‘hot-spot’ rings (circled in red) with para-substituents perpendicular to the plane of the ring. Katt_14, a weak inhibitor, has a ‘hot-spot’ ring with the para-substituent parallel to the plane of the ring. Similar orientations were determined following ab initio calculations at the 6–31+G* level.

Similar articles

Cited by

References

    1. Hanahan D, Weinberg RA. The hallmarks of cancer. Cell. 2000;100(1):57–70. - PubMed
    1. Hanahan D, Weinberg RA. Hallmarks of cancer: the next generation. Cell. 2011;144(5):646–674. - PubMed
    1. Warburg O, Wind F, Negelein E. The metabolism of tumors in the body. J. Gen. Physiol. 1927;8:519–530. - PMC - PubMed
    1. Warburg O. On the origin of cancer cells. Science. 1956;123(3191):309–314. - PubMed
    1. DeBerardinis RJ, Chandel NS. Fundamentals of cancer metabolism. Sci. Adv. 2016;2(5):e1600200. - PMC - PubMed

Publication types