

Genome-wide association analysis of chronic lymphocytic leukaemia, Hodgkin lymphoma and multiple myeloma identifies pleiotropic risk loci
- PMID: 28112199
- PMCID: PMC5253627
- DOI: 10.1038/srep41071
Genome-wide association analysis of chronic lymphocytic leukaemia, Hodgkin lymphoma and multiple myeloma identifies pleiotropic risk loci
Abstract
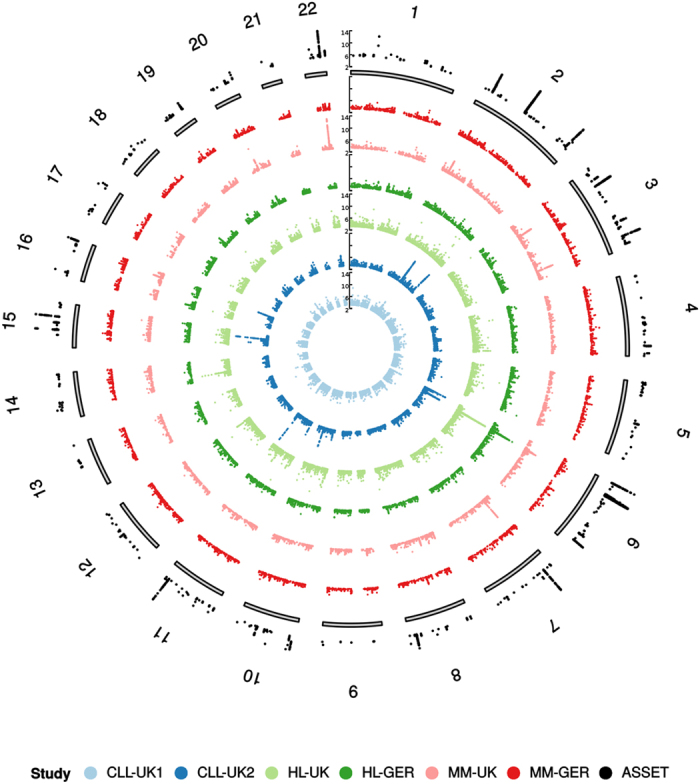
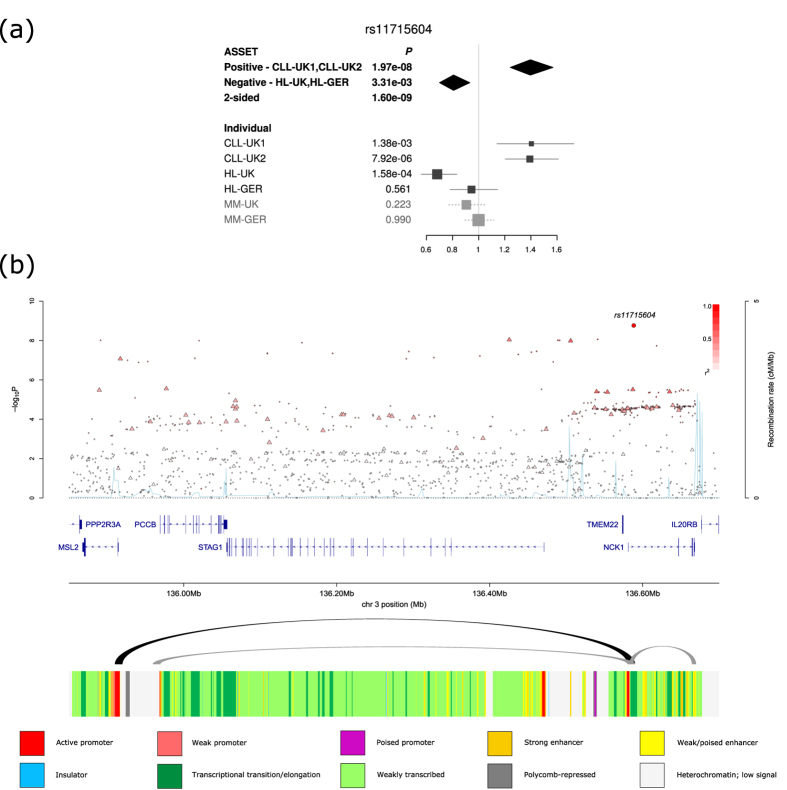
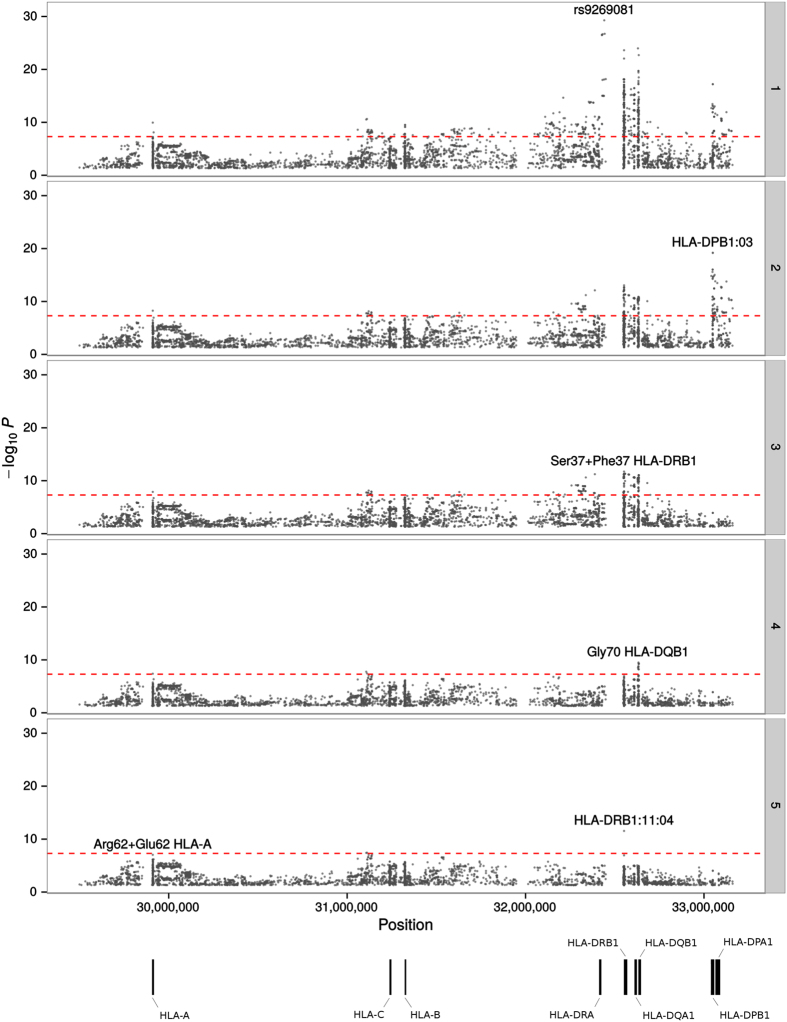
B-cell malignancies (BCM) originate from the same cell of origin, but at different maturation stages and have distinct clinical phenotypes. Although genetic risk variants for individual BCMs have been identified, an agnostic, genome-wide search for shared genetic susceptibility has not been performed. We explored genome-wide association studies of chronic lymphocytic leukaemia (CLL, N = 1,842), Hodgkin lymphoma (HL, N = 1,465) and multiple myeloma (MM, N = 3,790). We identified a novel pleiotropic risk locus at 3q22.2 (NCK1, rs11715604, P = 1.60 × 10⁻⁹) with opposing effects between CLL (P = 1.97 × 10⁻⁸) and HL (P = 3.31 × 10⁻³). Eight established non-HLA risk loci showed pleiotropic associations. Within the HLA region, Ser37 + Phe37 in HLA-DRB1 (P = 1.84 × 10⁻¹²) was associated with increased CLL and HL risk (P = 4.68 × 10⁻¹²), and reduced MM risk (P = 1.12 × 10⁻²), and Gly70 in HLA-DQB1 (P = 3.15 × 10⁻¹⁰) showed opposing effects between CLL (P = 3.52 × 10⁻³) and HL (P = 3.41 × 10⁻⁹). By integrating eQTL, Hi-C and ChIP-seq data, we show that the pleiotropic risk loci are enriched for B-cell regulatory elements, as well as an over-representation of binding of key B-cell transcription factors. These data identify shared biological pathways influencing the development of CLL, HL and MM. The identification of these risk loci furthers our understanding of the aetiological basis of BCMs.
Figures
References
-
- Rickert R. C. New insights into pre-BCR and BCR signalling with relevance to B cell malignancies. Nat Rev Immunol 13, 578–591 (2013). - PubMed
-
- Shaffer A. L., Rosenwald A. & Staudt L. M. Lymphoid Malignancies: the dark side of B-cell differentiation. Nat Rev Immunol 2, 920–933 (2002). - PubMed
-
- Craig F. E. & Foon K. A. Flow cytometric immunophenotyping for hematologic neoplasms. Blood 111, 3941–3967 (2008). - PubMed
-
- Kuppers R. Mechanisms of B-cell lymphoma pathogenesis. Nat Rev Cancer 5, 251–262 (2005). - PubMed
Publication types
MeSH terms
Substances
Grants and funding
LinkOut - more resources
Full Text Sources
Other Literature Sources
Medical
Research Materials
