Case Reports
. 2017 Jan 23:8:14209.
doi: 10.1038/ncomms14209.

A human immunodeficiency syndrome caused by mutations in CARMIL2

Affiliations
Case Reports

A human immunodeficiency syndrome caused by mutations in CARMIL2

T Schober et al. Nat Commun. .

Abstract

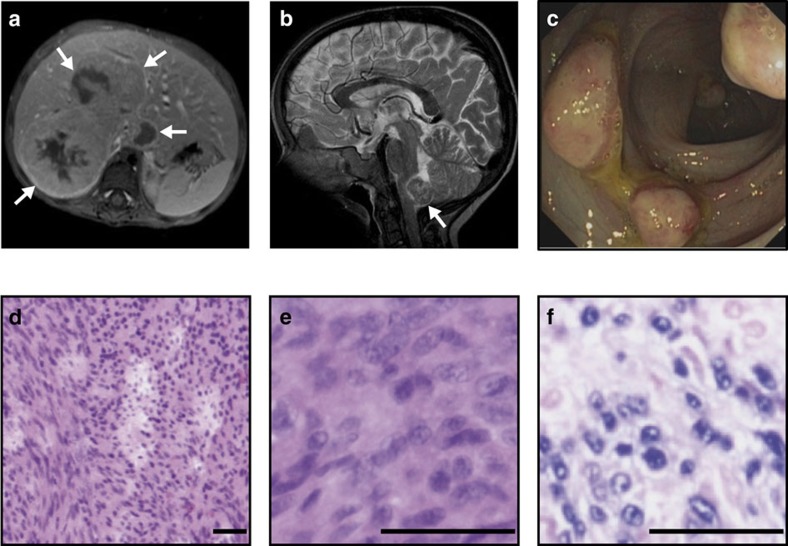
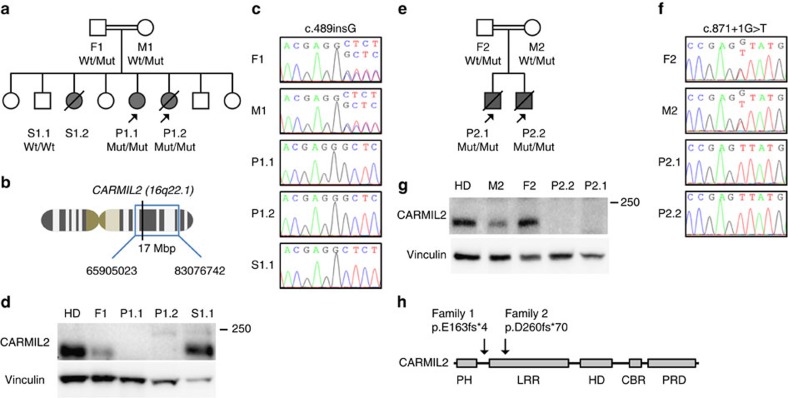
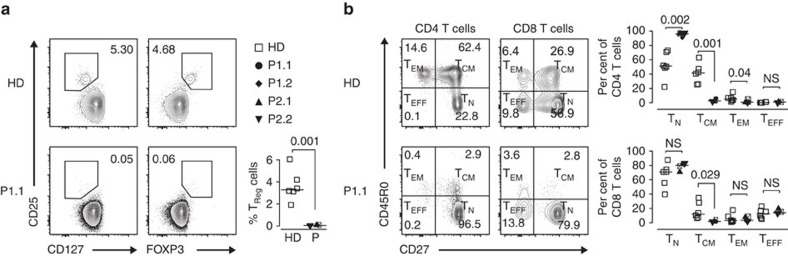
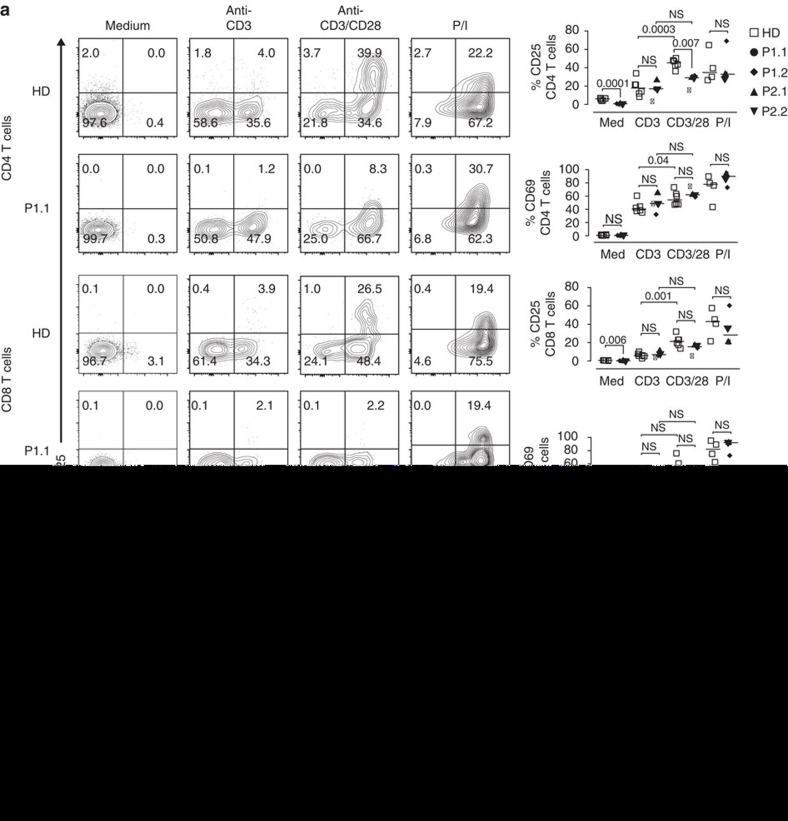
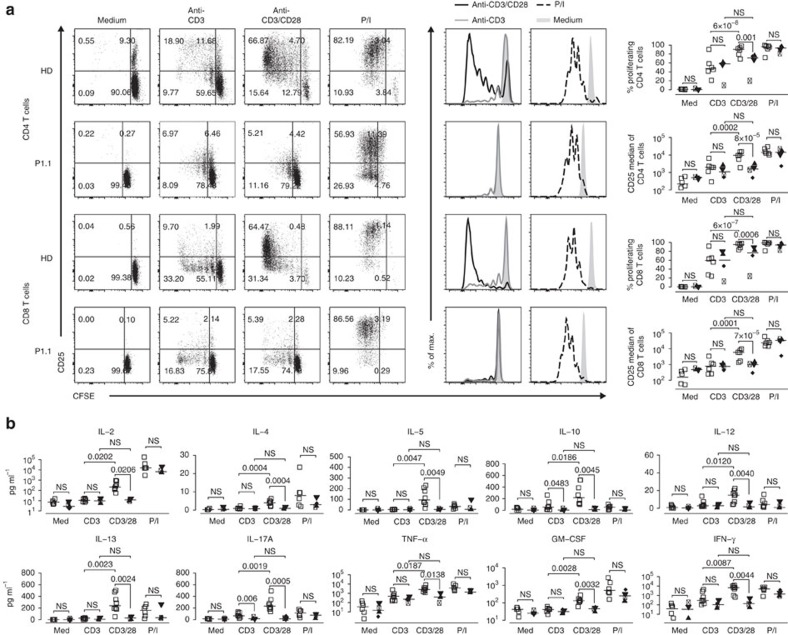
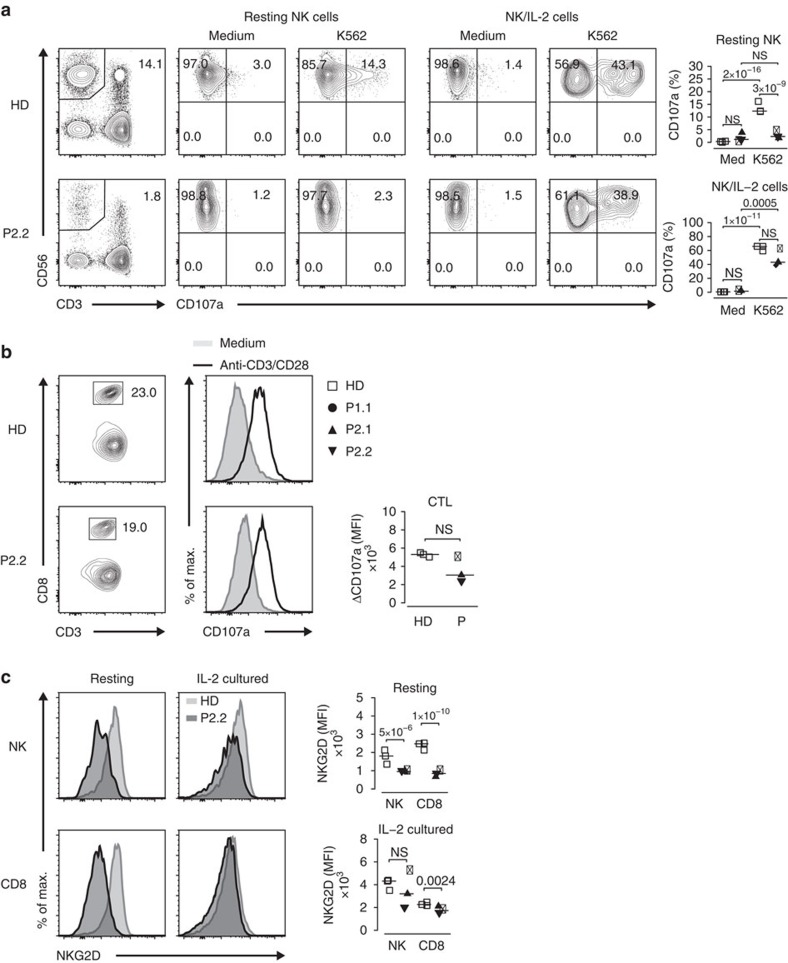
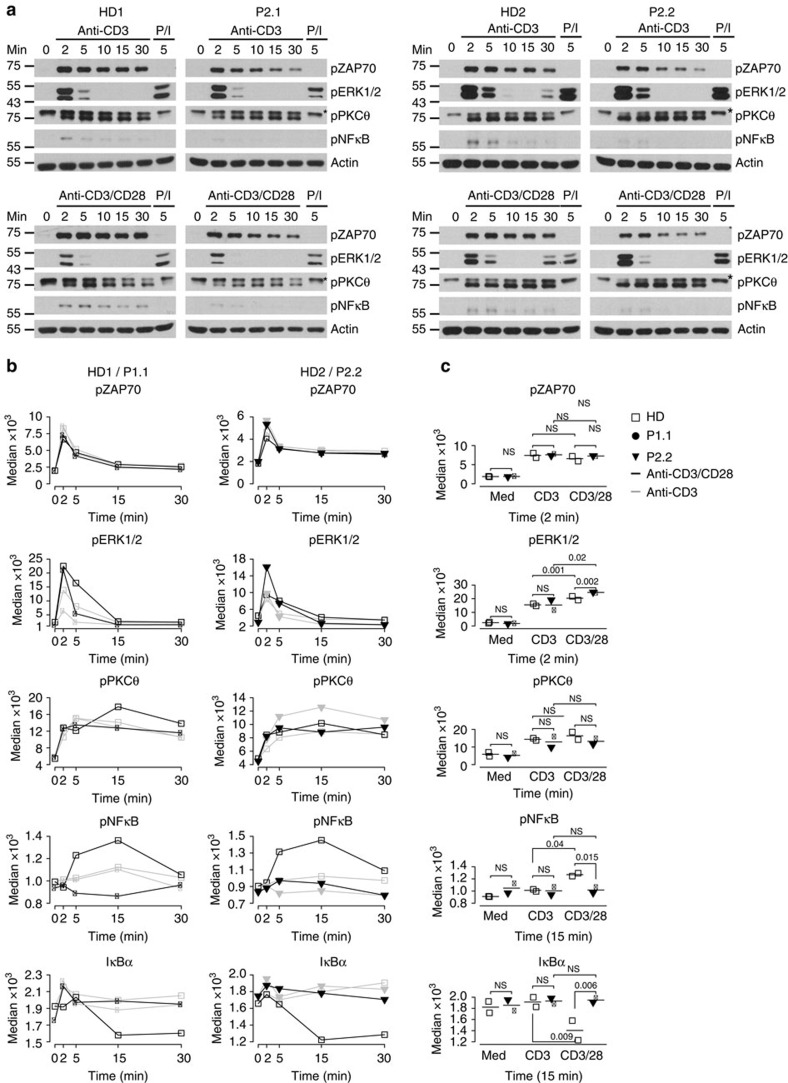
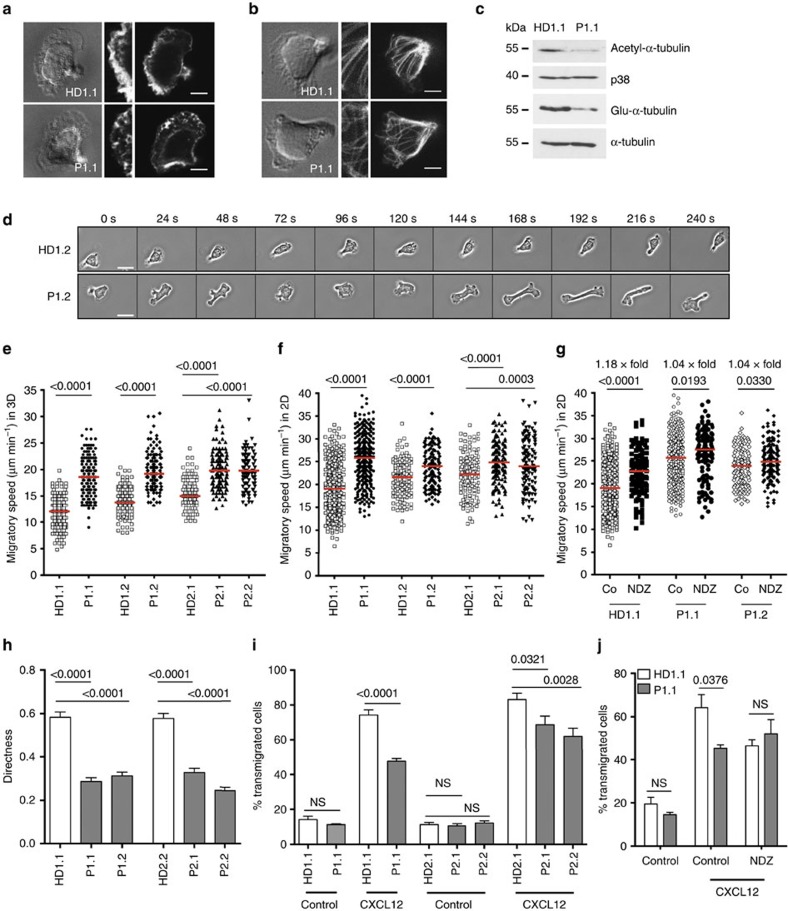
Human T-cell function is dependent on T-cell antigen receptor (TCR) and co-signalling as evidenced by immunodeficiencies affecting TCR-dependent signalling pathways. Here, we show four human patients with EBV+ disseminated smooth muscle tumours that carry two homozygous loss-of-function mutations in the CARMIL2 (RLTPR) gene encoding the capping protein regulator and myosin 1 linker 2. These patients lack regulatory T cells without evidence of organ-specific autoimmunity, and have defective CD28 co-signalling associated with impaired T-cell activation, differentiation and function, as well as perturbed cytoskeletal organization associated with T-cell polarity and migration disorders. Human CARMIL2-deficiency is therefore an autosomal recessive primary immunodeficiency disorder associated with defective CD28-mediated TCR co-signalling and impaired cytoskeletal dynamics.


Conflict of interest statement

The authors declare no competing financial interests.

Figures

Figure 1
Figure 1. Disseminated EBV+ SMT in CARMIL2-deficient patients.
(a) Abdominal magnetic resonance (MRI; T1 fat-sat post contrast medium) image of P1.2 with a tumour of ∼6 cm diameter in liver segments I and V–VIII (white arrows). (b) Cranial MRI (T2-WI) of P1.2 with a tumour of ∼1.7 cm diameter in the dorsal medulla oblongata (white arrow). (c) Colonoscopy image of P1.2 with multiple protruding tumors in the colon. (d,e) P2.1 hematoxylin and eosin (H&E) stains with leiomyogenic tumour cells and (f) EBER in situ hybridization. Scale bars, 50 μm. MRI, colonoscopy, tumour histopathology and EBER stains have been performed for four patients (P1.1, P1.2, P2.1 and P2.2).
Figure 2
Figure 2. Homozygous CARMIL2 mutations segregate with the disease phenotype.
(a) Pedigree of family 1 with father (F1), mother (M1), siblings (S1.1 and S1.2) and patients (P1.1 and P1.2). Grey symbols and diagonal bars indicate diseased and deceased subjects, respectively, and CARMIL2 wildtype (Wt) and CARMIL2 c.489insG mutated (Mut) alleles are depicted for each patient. (b) Schematic representation of chromosome 16, cytogenetic band 16q22.1 and the homozygous region (blue box and bp interval) identified by SNP chip that harbour CARMIL2 (black vertical line). (c) Electropherograms of family 1 members for CARMIL2 Wt/Mut, Mut/Mut and Wt/Wt alleles. (d) CARMIL2 immunoblots of healthy donor (HD) and family 1 members with vinculin loading control. (e) Pedigree of family 2 with father (F2), mother (M2) and patients (P2.1 and P2.2). (f) Electropherograms of family 2 members for CARMIL2 Wt/Mut and Mut/Mut. (g) CARMIL2 immunoblot of HD and family 2 members with vinculin loading control. (h) Schematic representation of CARMIL2 protein domain architecture and localization of family 1 p.E163fs*4 and family 2 p.D260fs*70 mutations. Immunoblots in (d) and (g) have been repeated three times.
Figure 3
Figure 3. CARMIL2-deficiency impairs CD28-mediated T-cell differentiation.
(a) Contour plots of CD25+CD127low and CD25+FOXP3+ Treg and summary of Treg percentages for six HD (open squares), P1.1 (black circle), P1.2 (black rhomb), P2.1 (black up-pointing triangle) and P2.2 (black down-pointing triangle). (b) Contour plots of CD4 and CD8 naive (TN, CD45R0CD27+), central memory (TCM, CD45R0+CD27+), effector memory (TEM, CD45R0+CD27) and effector (TEFF, CD45R0CD27) T-cells (corresponding percentages are indicated in each square) and summary of CD4 and CD8 T-cell subtype percentages for six HD and four patients. Small horizontal lines indicate the median. Each symbol represents an individual donor. Data are representative for four independent experiments with n=2. Significance levels are calculated with Welch's t-test and indicated in the summary graphs (NS=non significant).
Figure 4
Figure 4. CARMIL2-deficiency impairs CD28-mediated T-cell activation.
(a) Representative contour plots of CD25 and CD69 surface expression on CD4 and CD8 T cells without (medium) and after stimulation for 48 h with anti-CD3, anti-CD3/CD28 or PMA/ionomycin (P/I). Summary of CD4 and CD8 T-cell CD25 and CD69 surface expression for six HD (open squares), P1.1 (black circle), P1.2 (black rhomb), P2.1 (black up-pointing triangle) and P2.2 (black down-pointing triangle). (b) Contour plots of CD25 surface and FOXP3 expression on CD4 T cells without (medium) and after stimulation for 48 h with anti-CD3, anti-CD3/CD28 or PMA/ionomycin (P/I). Summary of CD4 T-cell CD25 surface and FOXP3 expression for four HD and three patients. Corresponding percentages are indicated in each square. Data are representative for four independent experiments with n=2 (a) or two independent experiments with n=2 (b). Small horizontal lines indicate the median. Each symbol represents an individual donor. Significance levels are calculated with Welch's t-test and indicated in the summary graphs (NS=non significant).
Figure 5
Figure 5. CARMIL2-deficiency impairs CD28-mediated T-cell function.
(a) Dot and histogram plots of CD25 surface expression and/or CFSE-dilution on CD4 and CD8 T cells without (medium) and after stimulation for 5 days with anti-CD3, anti-CD3/CD28 or PMA/ionomycin (P/I) and summary of CD4 and CD8 T-cell median CD25 MFI and proliferation percentages for six HD and four patients. (b) Multiplex cytokine assay for IL-2, IL-4, IL-5, IL-10, IL-12, IL-13, IL-17A, GM-CSF, IFN-γ and TNF-α (pg ml−1) in the supernatant collected after 48 h from T cells analysed in a. Small horizontal lines indicate the median. Each symbol represents an individual donor. Data are representative of four independent experiments with n=4 and pooled supernatants (b). Significance levels are calculated with Welch's t-test and indicated in the summary graphs (NS=non significant).
Figure 6
Figure 6. IL-2 rescues degranulation and NKG2D expression on NK and CD8 T cells.
(a) Contour plots of CD107a expression on resting and IL-2 cultured NK cells without (medium) and after K562 stimulation (K562) and summary of percentages of CD107a expression for three HD (open squares), P1.1 (black circle), P2.1 (black up-pointing triangle) and P2.2 (black down-pointing triangle). (b) Contour and histogram plots of CD107a expression on IL-2/phytohemagglutinin cultured CD8 T cells without (medium) and after anti-CD3/CD28 stimulation and summary of percentages of CD107a expression for three HD and three patients. (c) Histogram plots of NKG2D expression on resting and IL-2 cultured NK and CD8 T cells and summary of median NKG2D MFI for three HD and three patients. Small horizontal lines indicate the median. Each symbol represents an individual donor. Data are representative of two independent experiments with n=3. Significance levels are calculated with Welch's t-test and indicated in the summary graphs (NS=non significant).
Figure 7
Figure 7. CARMIL2-deficiency impairs CD28 co-signalling.
(a) Representative immunoblots for pZAP70, pERK1/2, pPKCθ and pNF-κB (p65) with total protein obtained from HD1, HD2, P2.1 and P2.2 T lymphoblasts stimulated with anti-CD3, anti-CD3/CD28 and P/I for 0, 2, 5, 10, 15 and 30 and 5 min, respectively. Actin serves as loading control, molecular weight markers are indicated in kDa and asterisks mark non-specific bands. Data are representative of two independent experiments. (b) Median of pZAP70, pERK1/2, pPKCθ, pNF-κB (p65) and IkBa in CD4 T cells of T lymphoblasts from HD1 and HD2 (open squares), P1.1 (black circle) and P2.2 (black down-pointing triangle) stimulated with anti-CD3 and anti-CD3/CD28 for 0, 2, 5, 15 and 30 min by flow cytometry. (c) Summary of median (phospho-) protein levels for two HD and two patients at the indicated time points with n=3. Significance levels are calculated with Welch's t-test (NS=non significant).
Figure 8
Figure 8. CARMIL2-deficiency leads to defective cytoskeletal organization and migration.
Differential interference contrast (DIC) images and fluorescent pictures of F-actin (a) and tubulin (b) in T lymphoblasts of HD1.1 and P1.1 migrating on ICAM1 (Scale bars, 5 μm). Fluorescent images show the level of the adhesion plane and details thereof are depicted in the middle. (c) Representative immunoblots showing stable α-tubulin as detected by acetyl- or detyrosinated glutamyl-α-tubulin in HD1.1 and P1.1. p38 and global α-tubulin serve as loading controls (n≥3). (d) Time-lapse video microscopy images of HD1.2 and P1.2 T lymphoblasts migrating on ICAM1. Time in seconds is depicted for each frame (Scale bars, 10 μm). (e) Spontaneous migration of T lymphoblasts (n≥110) in a 3D collagen matrix. For HD1.1, HD1.2, P1.1, P1.2 three and for HD2.1, HD2.2, P2.1, P2.2 two independent experiments are shown. (f) Spontaneous migration of T lymphoblasts on ICAM1 in 2D (n≥123 in three independent experiments). (g) x-fold migratory speed of control (co) versus nocodazol (NDZ) pretreated T lymphoblasts is depicted (n≥128 in two independent experiments). (eg) Red horizontal lines indicate the median. (h) Directness of migration on ICAM1 was quantified from T lymphoblast tracks (mean±s.e.m., n=99). (i,j) Chemotactic T-cell migration through 5 μm pores towards CXCL12 was analysed. When indicated T lymphoblasts were pretreated with nocodazole (NDZ). Three (i) or two (j) independent experiments with two technical replicates were done (mean±s.e.m.). Significance levels are calculated for patient T lymphoblasts in relation to HD within corresponding assays using the two-sided unpaired Student's t-test and are indicated in the summary graphs (NS=non significant).

References

    1. Milner J. D. & Holland S. M. The cup runneth over: lessons from the ever-expanding pool of primary immunodeficiency diseases. Nat. Rev. Immunol. 13, 635–648 (2013). - PubMed
    1. Fischer A. Recent advances in understanding the pathophysiology of primary T cell immunodeficiencies. Trends. Mol. Med. 21, 408–416 (2015). - PubMed
    1. Byun M. et al.. Inherited human OX40 deficiency underlying classic Kaposi sarcoma of childhood. J. Exp. Med. 210, 1743–1759 (2013). - PMC - PubMed
    1. Veillette A., Perez-Quintero L. A. & Latour S. X-linked lymphoproliferative syndromes and related autosomal recessive disorders. Curr. Opin. Allergy Clin. Immunol. 13, 614–622 (2013). - PubMed
    1. Wilson E. H. & Hunter C. A. Understanding the role of the CD40–CD40L interaction in resistance to parasitic infections. Parasite Immunol. 25, 179–183 (2003). - PubMed

Publication types