. 2017 Jan 23:7:40976.
doi: 10.1038/srep40976.

Genome and transcriptome analysis of surfactin biosynthesis in Bacillus amyloliquefaciens MT45

Affiliations

Genome and transcriptome analysis of surfactin biosynthesis in Bacillus amyloliquefaciens MT45

Yan Zhi et al. Sci Rep. .

Abstract

Natural Bacillus isolates generate limited amounts of surfactin (<10% of their biomass), which functions as an antibiotic or signalling molecule in inter-/intra-specific interactions. However, overproduction of surfactin in Bacillus amyloliquefaciens MT45 was observed at a titre of 2.93 g/l, which is equivalent to half of the maximum biomass. To systemically unravel this efficient biosynthetic process, the genome and transcriptome of this bacterium were compared with those of B. amyloliquefaciens type strain DSM7T. MT45 possesses a smaller genome while containing more unique transporters and resistance-associated genes. Comparative transcriptome analysis revealed notable enrichment of the surfactin synthesis pathway in MT45, including central carbon metabolism and fatty acid biosynthesis to provide sufficient quantities of building precursors. Most importantly, the modular surfactin synthase overexpressed (9 to 49-fold) in MT45 compared to DSM7T suggested efficient surfactin assembly and resulted in the overproduction of surfactin. Furthermore, based on the expression trends observed in the transcriptome, there are multiple potential regulatory genes mediating the expression of surfactin synthase. Thus, the results of the present study provide new insights regarding the synthesis and regulation of surfactin in high-producing strain and enrich the genomic and transcriptomic resources available for B. amyloliquefaciens.


Figures

Figure 1
Figure 1. Cell growth and surfactin production of B. amyloliquefaciens MT45 and DSM7T.
(a) Growth curve and (d) surfactin production curve in MMS media throughout the cultivation period. (b) Chemical structure of surfactin. (c) Total ion chromatogram of crude surfactin extracted from the culture broth of MT45 and DSM7T.
Figure 2
Figure 2. Genomic and comparative genomic analyses.
(a) Circular representation of the MT45 genome. From the outside inwards, circle 1: scale; circles 2 and 3: the predicted CDSs colour-coded according to their functions: cellular process, green; metabolism, pink; information pathway, orange; other functions, red; unknown, black; circle 4: predicted genomic islands; circle 5: unique genes in MT45; circle 6: rRNA; circle 7: tRNA; circle 8: predicted prophages (grey) and gene clusters involved in secondary metabolite synthesis (green); and circles 9 and 10: GC content and GC skew (G+C/G−C), respectively. (b) Global alignment of the bacterial chromosomes constructed using the M-GCAT programme; indels are depicted as red rectangles. (c) GO classification of the unique genes in MT45 and DSM7T. (d) Phylogenetic tree generated via comparison of the genomes of B. amyloliquefaciens MT45, B. amyloliquefaciens DSM7T, B. velezensis FZB42 (BV), B. subtilis DSM10T (BS), B. licheniformis DSM13T (BL), B. pumilus SAFR-032 (BP), and B. cereus ATCC14579T (BC).
Figure 3
Figure 3. Transcriptomic and comparative transcriptomic features of B. amyloliquefaciens MT45 and DSM7T.
(a) Global abundance of the gene expression of MT45 and DSM7T throughout the cultivation period. The transcripts were assessed based on FPKM values: high expression (FPKM ≥ 500), medium expression (10 ≤ FPKM < 500), low expression (1 ≤ FPKM < 10), and non-expression (FPKM < 1). (b) Major differences in metabolic pathways of MT45 compared with DSM7T cultivated for 12 h.
Figure 4
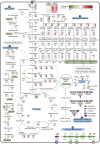
Figure 4. Metabolic pathway map for surfactin biosynthesis.
The metabolic network was reconstructed based on KEGG pathway analysis. Six modules were partitioned according to function. Transcripts of MT45 and DSM7T are shown near the pathway as a heat map, based on fold-changes in transcript levels relative to DSM7T after 12 h. Colour legend is shown at the top left of the map. Gene abbreviations are shown in Supplementary dataset 6.
Figure 5
Figure 5. Schematic representation of the differentially expressed genes affecting srfA expression.
Arrows indicate positive effects on srfA expression, the transformation of phosphoryl groups, or pentapeptide incorporation. T-bars indicate the negative effects on DNA binding or protein interactions. Bent arrow represents the promoter. ‘P’ in the circle represents the phosphoryl group. Heat maps in (a) and (b) indicate DEGs annotated as regulators that exhibit the same and opposing expression trends as srfA, respectively. Subgroups in (i)–(v) related to phosphorylation, sigma factors and their controls, transcription factors and their controls, genetic competence, and spore formation, respectively. Genes with fold-changes >2, detected by RT-qPCR, are indicated with asterisks.

References

    1. Nakano M. M. et al. srfA is an operon required for surfactin production, competence development, and efficient sporulation in Bacillus subtilis. J. Bacteriol. 173, 1770–1778 (1991). - PMC - PubMed
    1. Mukherjee S., Das P. & Sen R. Towards commercial production of microbial surfactants. Trends Biotechnol. 24, 509–515, doi: 10.1016/j.tibtech.2006.09.005 (2006). - DOI - PubMed
    1. Serror P. & Sonenshein A. L. CodY is required for nutritional repression of Bacillus subtilis genetic competence. J. Bacteriol. 178, 5910–5915 (1996). - PMC - PubMed
    1. Ogura M., Yamaguchi H., Yoshida K.-i., Fujita Y. & Tanaka T. DNA microarray analysis of Bacillus subtilis DegU, ComA and PhoP regulons: an approach to comprehensive analysis of B. subtilis two-component regulatory systems. Nucleic Acids Res. 29, 3804–3813, doi: 10.1093/nar/29.18.3804 (2001). - DOI - PMC - PubMed
    1. Strauch M. A. et al. Abh and AbrB Control of Bacillus subtilis Antimicrobial Gene Expression. J. Bacteriol. 189, 7720–7732, doi: 10.1128/jb.01081-07 (2007). - DOI - PMC - PubMed

Publication types

MeSH terms