

Zebularine upregulates expression of CYP genes through inhibition of DNMT1 and PKR in HepG2 cells
- PMID: 28112215
- PMCID: PMC5253741
- DOI: 10.1038/srep41093
Zebularine upregulates expression of CYP genes through inhibition of DNMT1 and PKR in HepG2 cells
Abstract
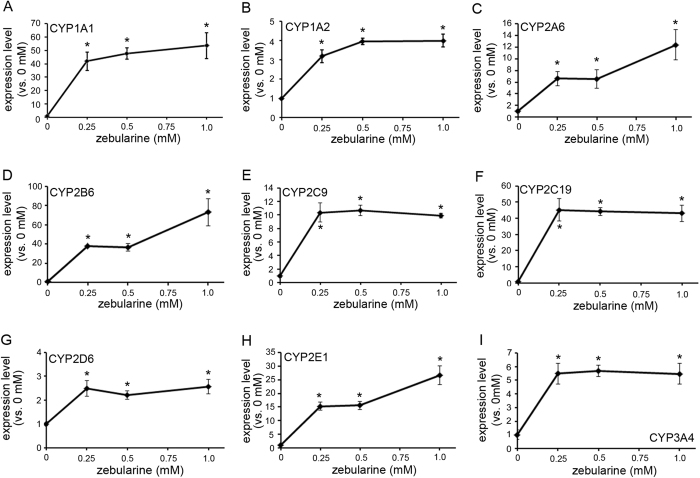
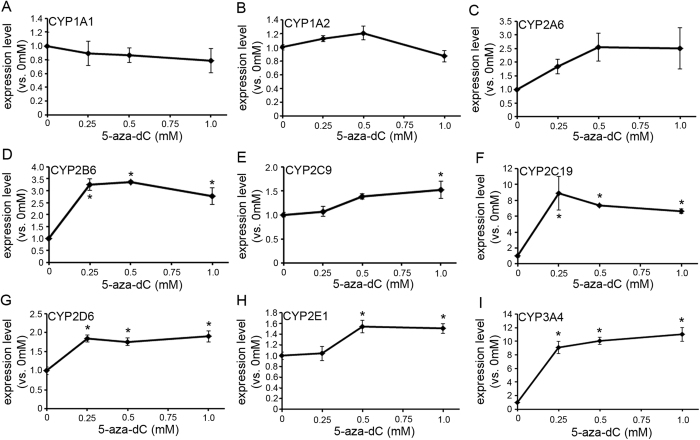
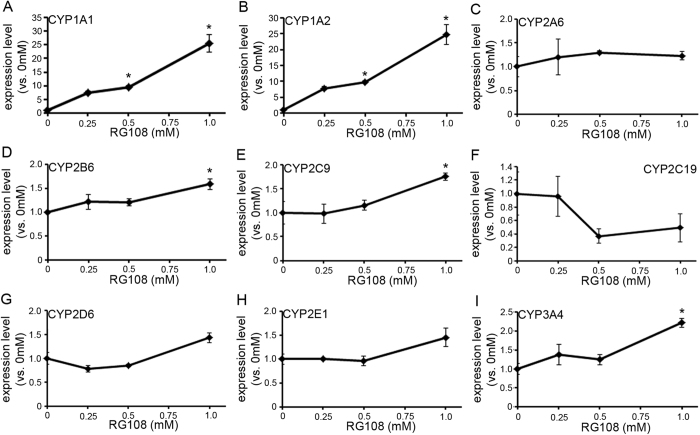
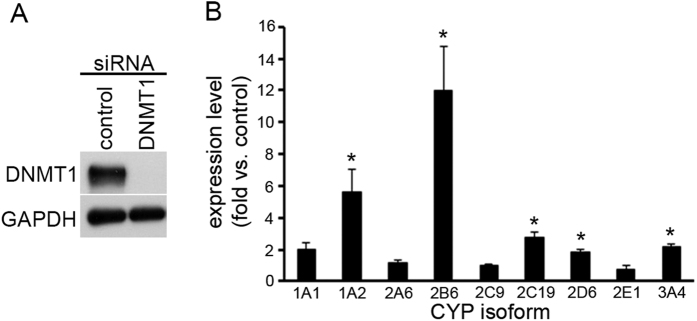
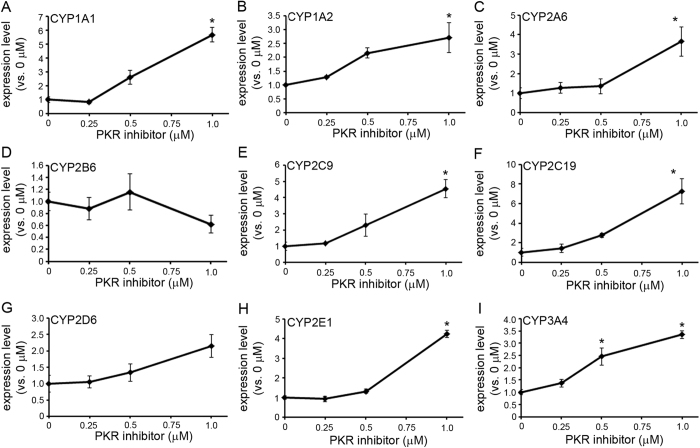
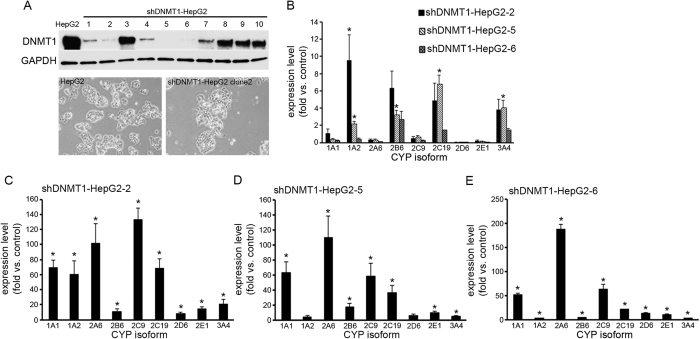
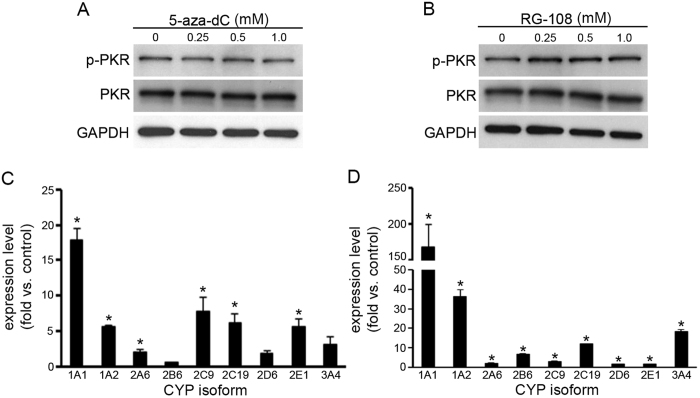
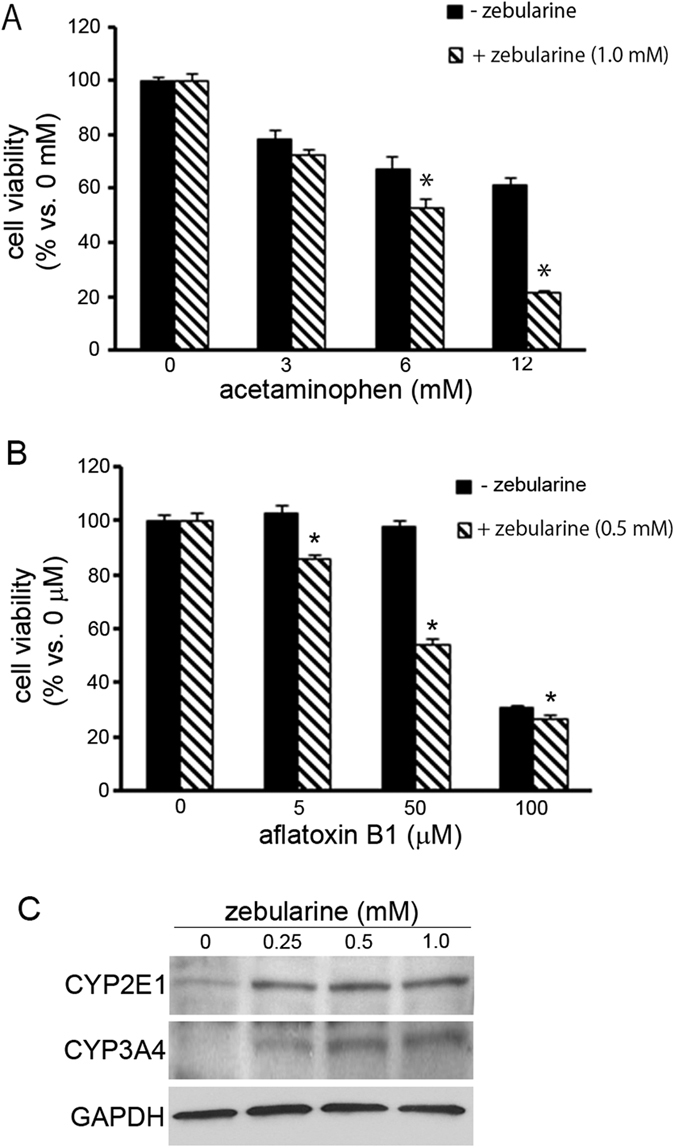
Drug-induced hepatotoxicity is one of the major reasons cited for drug withdrawal. Therefore, it is of extreme importance to detect human hepatotoxic candidates as early as possible during the drug development process. In this study, we aimed to enhance hepatocyte functions such as CYP gene expression in HepG2 cells, one of the most extensively used cell lines in evaluating hepatotoxicity of chemicals and drugs. We found that zebularine, a potent inhibitor of DNA methylation, remarkably upregulates the expression of CYP genes in HepG2 cells. In addition, we revealed that the upregulation of CYP gene expression by zebularine was mediated through the inhibition of both DNA methyltransferase 1 (DNMT1) and double-stranded RNA-dependent protein kinase (PKR). Furthermore, HepG2 cells treated with zebularine were more sensitive than control cells to drug toxicity. Taken together, our results show that zebularine may make HepG2 cells high-functioning and thus could be useful for evaluating the hepatotoxicity of chemicals and drugs speedily and accurately in in-vitro systems. The finding that zebularine upregulates CYP gene expression through DNMT1 and PKR modulation sheds light on the mechanisms controlling hepatocyte function and thus may aid in the development of new in-vitro systems using high-functioning hepatocytes.
Figures
Similar articles
-
DNA methyltransferase inhibitor zebularine inhibits human hepatic carcinoma cells proliferation and induces apoptosis.PLoS One. 2013;8(1):e54036. doi: 10.1371/journal.pone.0054036. Epub 2013 Jan 8. PLoS One. 2013. PMID: 23320119 Free PMC article.
-
DNA methyltransferase inhibitor zebularine induces human cholangiocarcinoma cell death through alteration of DNA methylation status.PLoS One. 2015 Mar 23;10(3):e0120545. doi: 10.1371/journal.pone.0120545. eCollection 2015. PLoS One. 2015. PMID: 25799509 Free PMC article.
-
Zebularine enhances apoptosis of human osteosarcoma cells by suppressing methylation of ARHI.Cancer Sci. 2016 Dec;107(12):1851-1857. doi: 10.1111/cas.13088. Epub 2016 Dec 19. Cancer Sci. 2016. Retraction in: Cancer Sci. 2024 Dec;115(12):4080. doi: 10.1111/cas.16346. PMID: 27685841 Free PMC article. Retracted.
-
Zebularine: a unique molecule for an epigenetically based strategy in cancer chemotherapy.Ann N Y Acad Sci. 2005 Nov;1058:246-54. doi: 10.1196/annals.1359.037. Ann N Y Acad Sci. 2005. PMID: 16394141 Review.
-
Upgrading HepG2 cells with adenoviral vectors that encode drug-metabolizing enzymes: application for drug hepatotoxicity testing.Expert Opin Drug Metab Toxicol. 2017 Feb;13(2):137-148. doi: 10.1080/17425255.2017.1238459. Epub 2016 Sep 27. Expert Opin Drug Metab Toxicol. 2017. PMID: 27671376 Review.
Cited by
-
DNMT1/PKR double knockdowned HepG2 (HepG2-DP) cells have high hepatic function and differentiation ability.Sci Rep. 2022 Dec 7;12(1):21173. doi: 10.1038/s41598-022-25777-z. Sci Rep. 2022. PMID: 36476676 Free PMC article.
-
A Review on New Frontiers in Drug-Drug Interaction Predictions and Safety Evaluations with In Vitro Cellular Models.Pharmaceutics. 2025 Jun 6;17(6):747. doi: 10.3390/pharmaceutics17060747. Pharmaceutics. 2025. PMID: 40574059 Free PMC article. Review.
-
Differentiation Therapy by Epigenetic Reconditioning Exerts Antitumor Effects on Liver Cancer Cells.Mol Ther. 2018 Jul 5;26(7):1840-1854. doi: 10.1016/j.ymthe.2018.04.018. Epub 2018 Apr 26. Mol Ther. 2018. PMID: 29759938 Free PMC article.
-
Eukaryotic translation initiation factor 2α kinase 2 in pancreatic cancer: An approach towards managing clinical prognosis and molecular immunological characterization.Oncol Lett. 2023 Sep 21;26(5):478. doi: 10.3892/ol.2023.14066. eCollection 2023 Nov. Oncol Lett. 2023. PMID: 37818134 Free PMC article.
-
The Relevance of Gender in Tumor-Influencing Epigenetic Traits.Epigenomes. 2019 Jan 28;3(1):6. doi: 10.3390/epigenomes3010006. Epigenomes. 2019. PMID: 34991275 Free PMC article. Review.
References
-
- Hirode M. et al.. Gene expression profiling in rat liver treated with various hepatotoxic-compounds inducing coagulopathy. J Toxicol Sci 34, 281–293, doi: JST.JSTAGE/jts/34.281 [pii] (2009). - PubMed
-
- Kawai H., Kudo N., Kawashima Y. & Mitsumoto A. Efficacy of urine bile acid as a non-invasive indicator of liver damage in rats. J Toxicol Sci 34, 27–38, doi: JST.JSTAGE/jts/34.27 [pii] (2009). - PubMed
-
- Knowles B. B., Howe C. C. & Aden D. P. Human hepatocellular carcinoma cell lines secrete the major plasma proteins and hepatitis B surface antigen. Science 209, 497–499 (1980). - PubMed
Publication types
MeSH terms
Substances
LinkOut - more resources
Full Text Sources
Other Literature Sources
Molecular Biology Databases
