

Development of a facile droplet-based single-cell isolation platform for cultivation and genomic analysis in microorganisms
- PMID: 28112223
- PMCID: PMC5253770
- DOI: 10.1038/srep41192
Development of a facile droplet-based single-cell isolation platform for cultivation and genomic analysis in microorganisms
Abstract
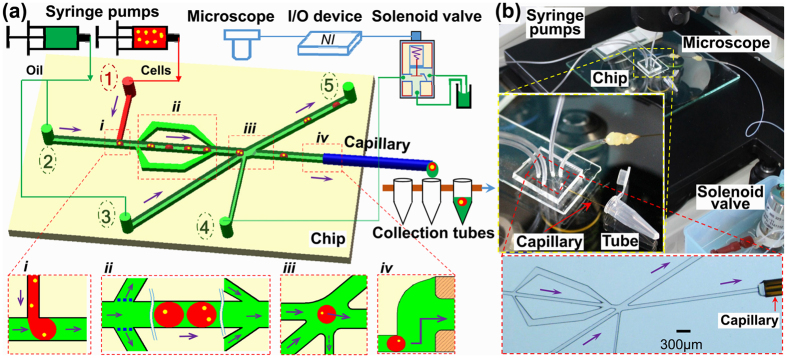
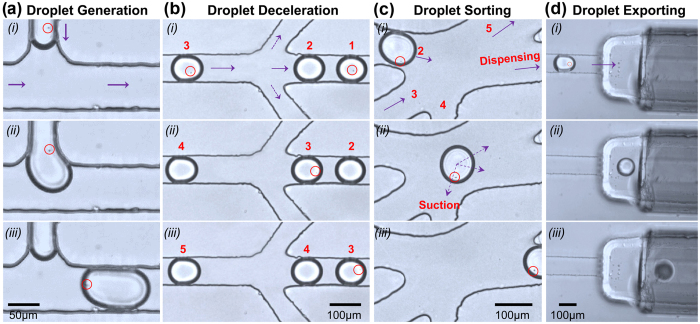
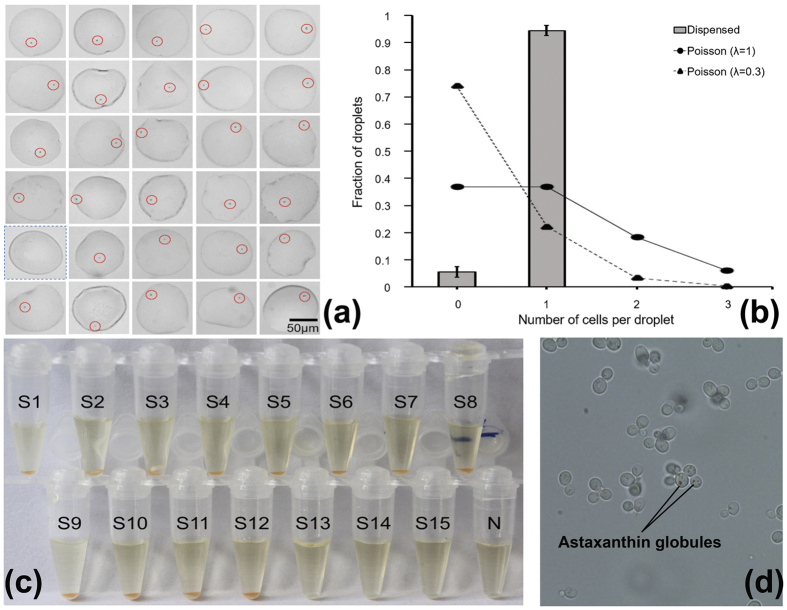
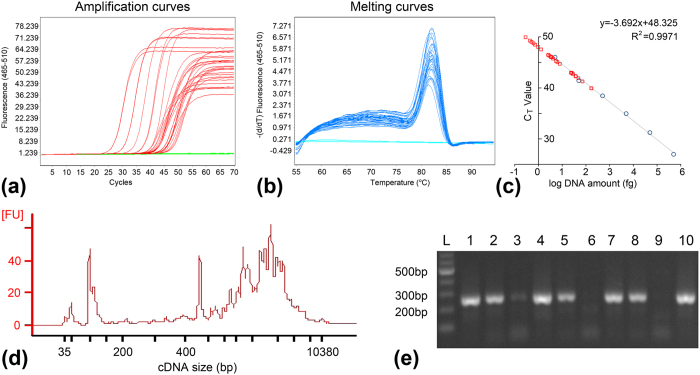
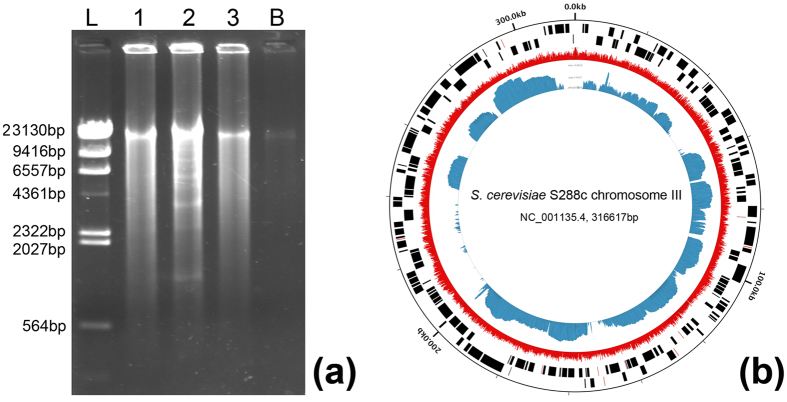
Wider application of single-cell analysis has been limited by the lack of an easy-to-use and low-cost strategy for single-cell isolation that can be directly coupled to single-cell sequencing and single-cell cultivation, especially for small-size microbes. Herein, a facile droplet microfluidic platform was developed to dispense individual microbial cells into conventional standard containers for downstream analysis. Functional parts for cell encapsulation, droplet inspection and sorting, as well as a chip-to-tube capillary interface were integrated on one single chip with simple architecture, and control of the droplet sorting was achieved by a low-cost solenoid microvalve. Using microalgal and yeast cells as models, single-cell isolation success rate of over 90% and single-cell cultivation success rate of 80% were demonstrated. We further showed that the individual cells isolated can be used in high-quality DNA and RNA analyses at both gene-specific and whole-genome levels (i.e. real-time quantitative PCR and genome sequencing). The simplicity and reliability of the method should improve accessibility of single-cell analysis and facilitate its wider application in microbiology researches.
Figures
Similar articles
-
A droplet-to-digital (D2D) microfluidic device for single cell assays.Lab Chip. 2015 Jan 7;15(1):225-36. doi: 10.1039/c4lc00794h. Lab Chip. 2015. PMID: 25354549
-
Live cell imaging compatible immobilization of Chlamydomonas reinhardtii in microfluidic platform for biodiesel research.Biotechnol Bioeng. 2015 Mar;112(3):494-501. doi: 10.1002/bit.25453. Epub 2014 Oct 21. Biotechnol Bioeng. 2015. PMID: 25220860
-
Cultivation and quantitative single-cell analysis of Saccharomyces cerevisiae on a multifunctional microfluidic device.Electrophoresis. 2018 Feb;39(3):540-547. doi: 10.1002/elps.201700253. Epub 2017 Oct 4. Electrophoresis. 2018. PMID: 28880404
-
[Application of Droplet-Based Microfluidics in Microbial Research].Sichuan Da Xue Xue Bao Yi Xue Ban. 2023 May;54(3):673-678. doi: 10.12182/20230560303. Sichuan Da Xue Xue Bao Yi Xue Ban. 2023. PMID: 37248604 Free PMC article. Review. Chinese.
-
Droplet microfluidics--a tool for single-cell analysis.Angew Chem Int Ed Engl. 2012 Dec 3;51(49):12176-92. doi: 10.1002/anie.201200460. Epub 2012 Nov 23. Angew Chem Int Ed Engl. 2012. PMID: 23180509 Review.
Cited by
-
Recent Advances in Droplet-based Microfluidic Technologies for Biochemistry and Molecular Biology.Micromachines (Basel). 2019 Jun 20;10(6):412. doi: 10.3390/mi10060412. Micromachines (Basel). 2019. PMID: 31226819 Free PMC article. Review.
-
'Small volume-big problem': culturing Yarrowia lipolytica in high-throughput micro-formats.Microb Cell Fact. 2024 Jun 24;23(1):184. doi: 10.1186/s12934-024-02465-3. Microb Cell Fact. 2024. PMID: 38915032 Free PMC article. Review.
-
Metagenome-guided culturomics for the targeted enrichment of gut microbes.Nat Commun. 2025 Jan 14;16(1):663. doi: 10.1038/s41467-024-55668-y. Nat Commun. 2025. PMID: 39809763 Free PMC article.
-
Graph-Theoretic Post-Processing of Segmentation With Application to Dense Biofilms.IEEE Trans Image Process. 2021;30:8580-8594. doi: 10.1109/TIP.2021.3116792. Epub 2021 Oct 15. IEEE Trans Image Process. 2021. PMID: 34613914 Free PMC article.
-
Recent advances in microfluidic platforms for single-cell analysis in cancer biology, diagnosis and therapy.Trends Analyt Chem. 2019 Aug;117:13-26. doi: 10.1016/j.trac.2019.05.010. Epub 2019 May 17. Trends Analyt Chem. 2019. PMID: 32831435 Free PMC article.
References
-
- Lidstrom M. E. & Konopka M. C. The role of physiological heterogeneity in microbial population behavior. Nat. Chem. Biol. 6, 705–712 (2010). - PubMed
-
- Kaminski T. S., Scheler O. & Garstecki P. Droplet microfluidics for microbiology: techniques, applications and challenges. Lab Chip 16, 2168–87 (2016). - PubMed
-
- Lasken R. S. Genomic sequencing of uncultured microorganisms from single cells. Nat. Rev. Microbiol. 10, 631–640 (2012). - PubMed
-
- Zhang K. et al.. Sequencing genomes from single cells by polymerase cloning. Nat. Biotechnol. 24, 680–686 (2006). - PubMed
Publication types
MeSH terms
Substances
LinkOut - more resources
Full Text Sources
Other Literature Sources
Molecular Biology Databases
