. 2017 Jan 23:7:41089.
doi: 10.1038/srep41089.

Multi-omics analyses reveal metabolic alterations regulated by hepatitis B virus core protein in hepatocellular carcinoma cells

Affiliations

Multi-omics analyses reveal metabolic alterations regulated by hepatitis B virus core protein in hepatocellular carcinoma cells

Qi Xie et al. Sci Rep. .

Abstract

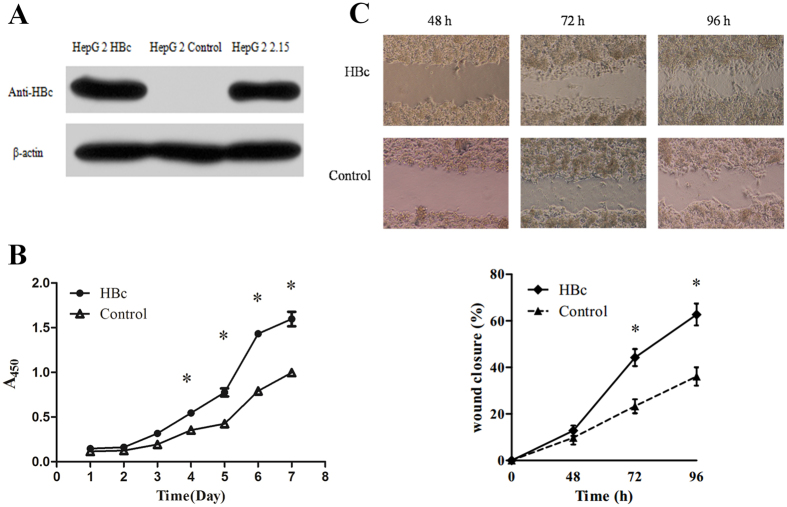
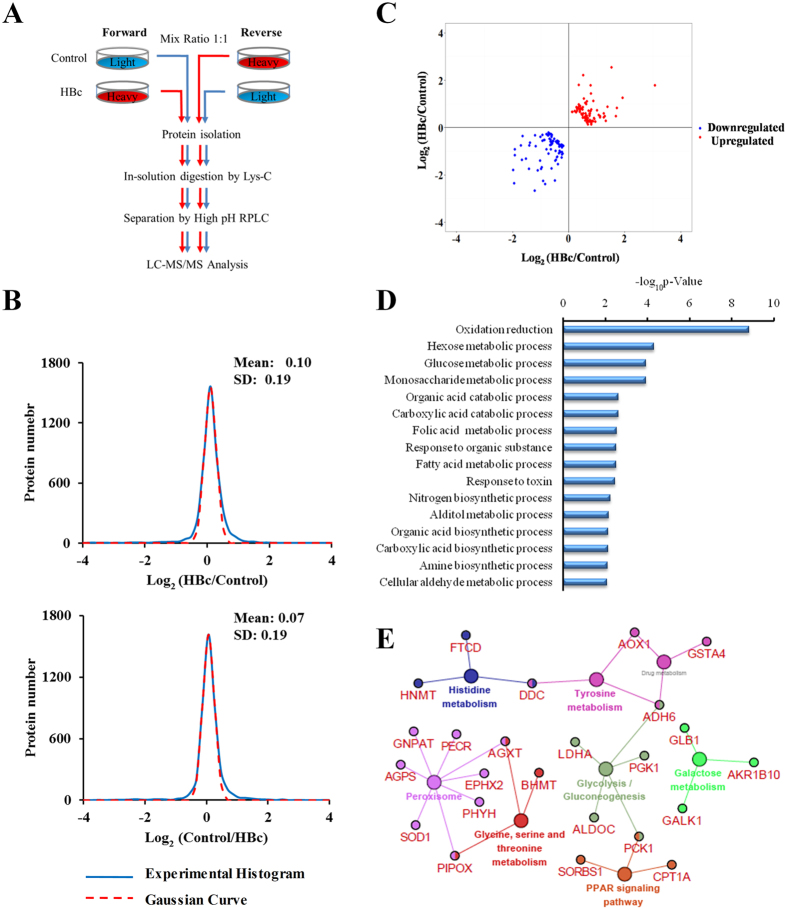
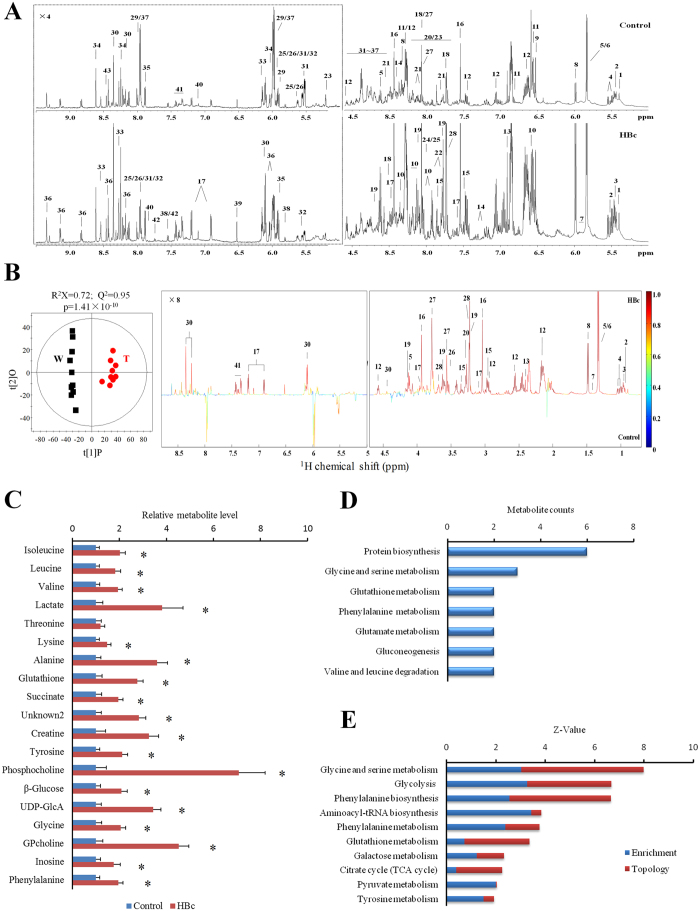
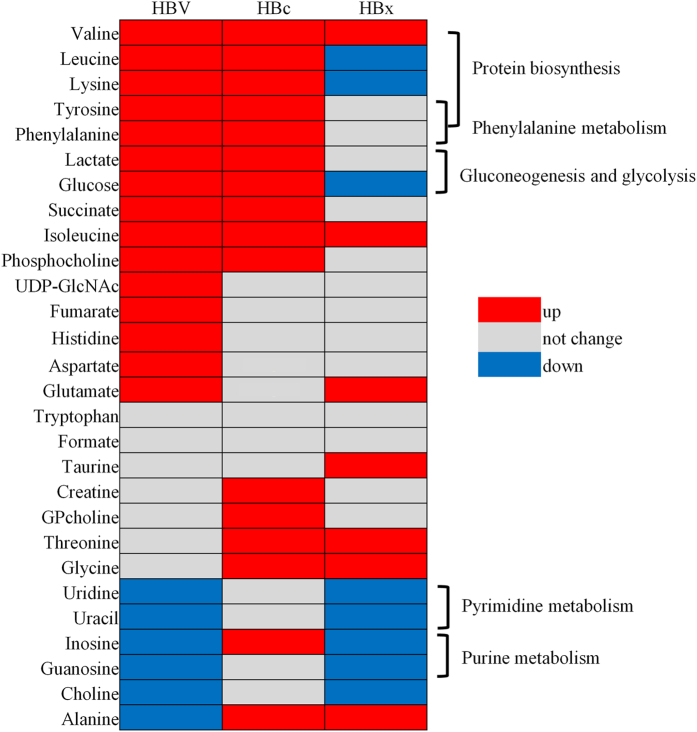
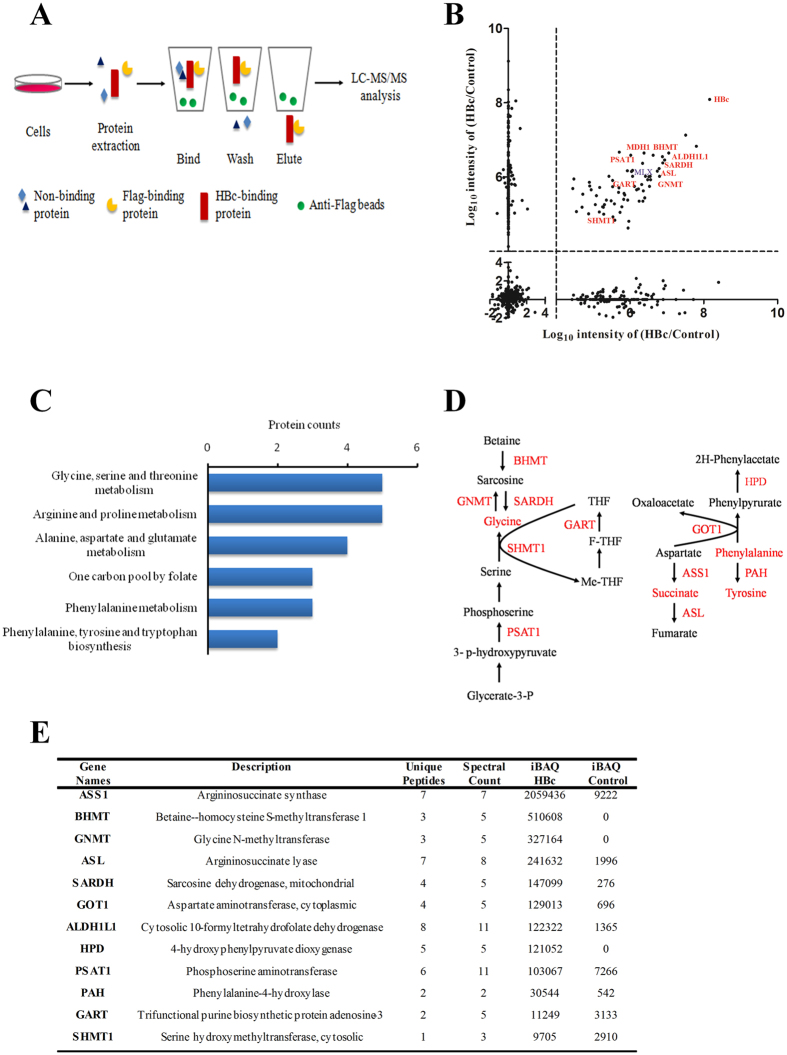
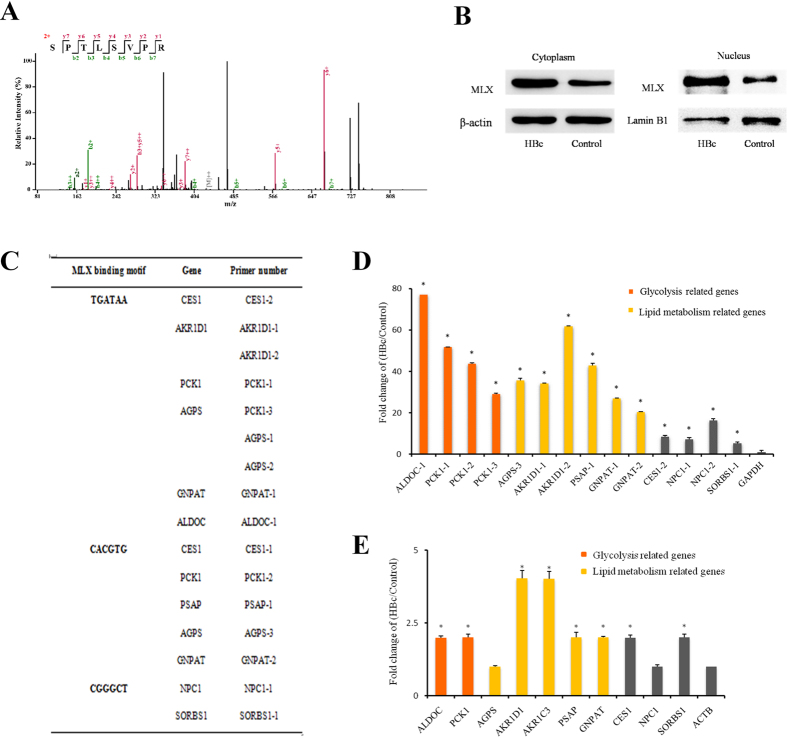
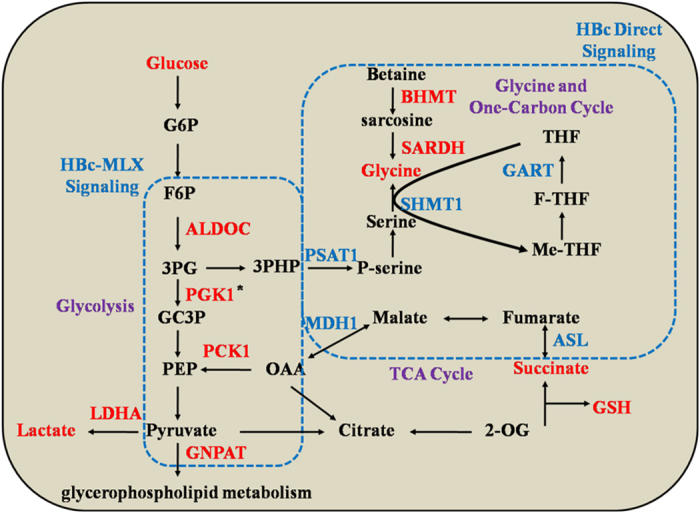
Chronic hepatitis B virus (HBV) infection is partly responsible for hepatitis, fatty liver disease and hepatocellular carcinoma (HCC). HBV core protein (HBc), encoded by the HBV genome, may play a significant role in HBV life cycle. However, the function of HBc in the occurrence and development of liver disease is still unclear. To investigate the underlying mechanisms, HBc-transfected HCC cells were characterized by multi-omics analyses. Combining proteomics and metabolomics analyses, our results showed that HBc promoted the expression of metabolic enzymes and the secretion of metabolites in HCC cells. In addition, glycolysis and amino acid metabolism were significantly up-regulated by HBc. Moreover, Max-like protein X (MLX) might be recruited and enriched by HBc in the nucleus to regulate glycolysis pathways. This study provides further insights into the function of HBc in the molecular pathogenesis of HBV-induced diseases and indicates that metabolic reprogramming appears to be a hallmark of HBc transfection.


Figures

Figure 1
Figure 1. HBc promotes cell proliferation and migration.
(A) HBc expression was detected by western blotting. (B) The effect of HBc on cell proliferation was measured using CCK-8 assay (*p < 0.05). (C) The effect of HBc on cell motility was measured using a wound-healing assay. Top: Representative photographs taken at 48 h, 72 h and 96 h post-wound (×100). Bottom: The wound closure was quantified by measuring the remaining unmigrated area using ImageJ.
Figure 2
Figure 2. Enzymes that significantly change between HBc and control cells.
(A) Workflow of the SILAC-based proteomic identification process with forward and reverse labelling experiments. (B) The quality of SILAC labelling was determined by observing the normalized log2 ratio distribution of the differentially expressed proteins from the forward and reverse datasets. (C) The scatter plot displays the regulated proteins based on the protein expression ratios of HBc and control cells. (D) Functional enrichment analysis of differentially expressed proteins. The y-axis presents the functional categories identified in the GO analysis in terms of biological processes. The x-axis demonstrates the significance (p < 0.05). (E) KEGG annotation revealed the networks up-regulated by HBc. Large nodes represent metabolites within core regulatory networks. Enzymes are represented by small nodes. The results only showed pathways with p < 0.05 and cluster protein number ≥ 3.
Figure 3
Figure 3. Metabolic characterization of HBc cells.
(A) Average 600 MHz 1H HRMAS NMR spectra of HBc and control cells. The region of δ5.0–9.5 was vertically expanded 4 times compared with δ0.5–4.5. The metabolite list is shown in Table S2. (B) Validated OPLS-DA scores and coefficient plots show the discriminations of the metabolic profiles of extracts of HBc cells (T) from control cells (W). The resonance peaks pointing upward indicate an increase of metabolites in HBc cells and vice versa. The colour of the peaks represents the correlation coefficient of a metabolite where the cut-off value of |r| was 0.847 (n = 10, p < 0.001). The detailed data are shown in Table S2. (C) Metabolites consumed by HBc and control cells. The data are shown as the mean ± standard deviation (SD), n = 1 0, t test, *p < 0.001. Notes: UDP-GlcA, UDP-glucose A; GPcholine, glycerophosphocholine. (D) The enrichment analysis displays the metabolic pathways regulated by HBc. (E) The integrated metabolic pathways were obtained from metabolomics and proteomics analyses.
Figure 4
Figure 4. Comparison of metabolic patterns between HBV and its encoded genes.
The metabolomics datasets were collected from our study and published papers. The metabolites jointly identified by these studies were selected and analysed here. The significantly up- or down-regulated metabolites (*p < 0.001) are indicated by red or blue, respectively.
Figure 5
Figure 5. Identification of the interacting proteins of HBc.
(A) A schematic diagram of the CoIP experiment for enriching the HBc interacting proteins. (B) The distribution of potential HBc interacting proteins is shown in the scatter plot with a cut-off transformed log10 intensity > 4. The highlighted dots represent some potential candidates in this study. (C) The KEGG annotation revealed the pathways regulated by HBc. (D) Graphical demonstration of the predominant enzymes that bind HBc and their involvement in the metabolic pathways. (E) MS information of the HBc interacting proteins.
Figure 6
Figure 6. Identification of the transcriptional regulation effect of MLX.
(A) The MLX relative abundance was represented by the monoisotopic m/z values of the detected peptide of MLX. (B) MLX expression was detected by western blotting. (C) Primers were designed according to MLX binding motifs. (D) ChIP-qPCR results showed that MLX regulated the expression of differentially expressed proteins (*p < 0.001). (E) The expression of MLX-regulated genes was detected by real-time PCR (*p < 0.05).
Figure 7
Figure 7. Summary of the variation of metabolic pathways induced by HBc.
Metabolites and enzymes shown in red indicate higher expression levels and direct interaction with HBc or MLX. Enzymes without significant changes are marked in blue. *PGK1 expression was significantly increased in the proteomics data, but the interaction between PGK1 and MLX is still unclear. Abbreviations: G6P, glucose-6-phosphate; F6P, fructose-6-phosphate; 3 PG, glyceraldehyde-3-phosphate; GC3P, 3-phosphoglyceric acid; PEP, phosphoenolpyruvate; OAA, oxaloacetate; 3PHP, 3-phosphohydroxypyruvate; P-serine, phosphatidylserine; 2-OG, 2-oxoglutarate; THF, tetrahydrofolate; me-THF; 5,10-methylene-THF; F-THF, 10-formyltetrahydrofolate; GSH, glutathione.

Similar articles

Cited by

References

    1. de Martel C. et al.. Global burden of cancers attributable to infections in 2008: a review and synthetic analysis. The Lancet. Oncology 13, 607–615, doi: 10.1016/S1470-2045(12)70137-7 (2012). - DOI - PubMed
    1. Hanahan D. & Weinberg R. A. The hallmarks of cancer. Cell 100, 57–70 (2000). - PubMed
    1. Hanahan D. & Weinberg R. A. Hallmarks of cancer: the next generation. Cell 144, 646–674, doi: 10.1016/j.cell.2011.02.013 (2011). - DOI - PubMed
    1. El-Serag H. B. Epidemiology of viral hepatitis and hepatocellular carcinoma. Gastroenterology 142(1264–1273), e1261, doi: 10.1053/j.gastro.2011.12.061 (2012). - DOI - PMC - PubMed
    1. Kim B. K., Han K. H. & Ahn S. H. Prevention of hepatocellular carcinoma in patients with chronic hepatitis B virus infection. Oncology 81 Suppl 1, 41–49, 10.1159/000333258 (2011). - DOI - PubMed

Publication types

MeSH terms

Substances