. 2017 Jan 23:7:41138.
doi: 10.1038/srep41138.

Progression-related loss of stromal Caveolin 1 levels fosters the growth of human PC3 xenografts and mediates radiation resistance

Affiliations

Progression-related loss of stromal Caveolin 1 levels fosters the growth of human PC3 xenografts and mediates radiation resistance

Andrej Panic et al. Sci Rep. .

Abstract

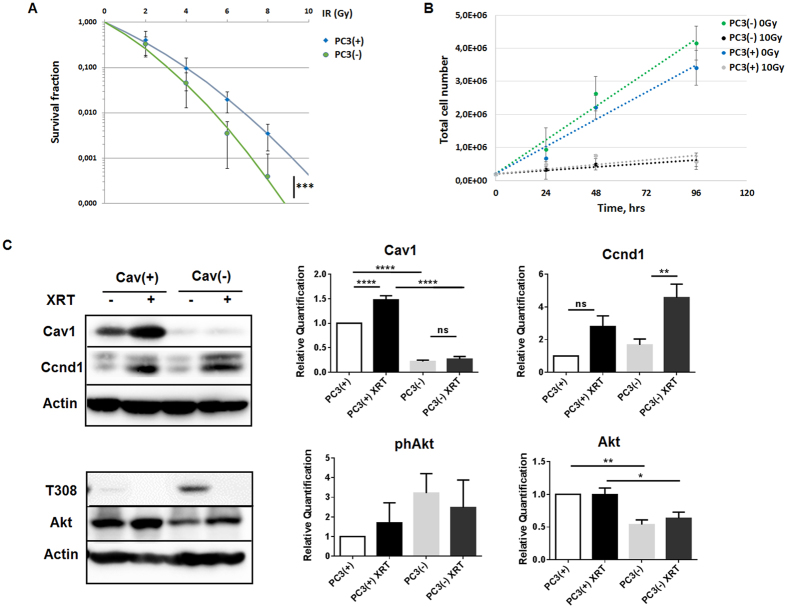
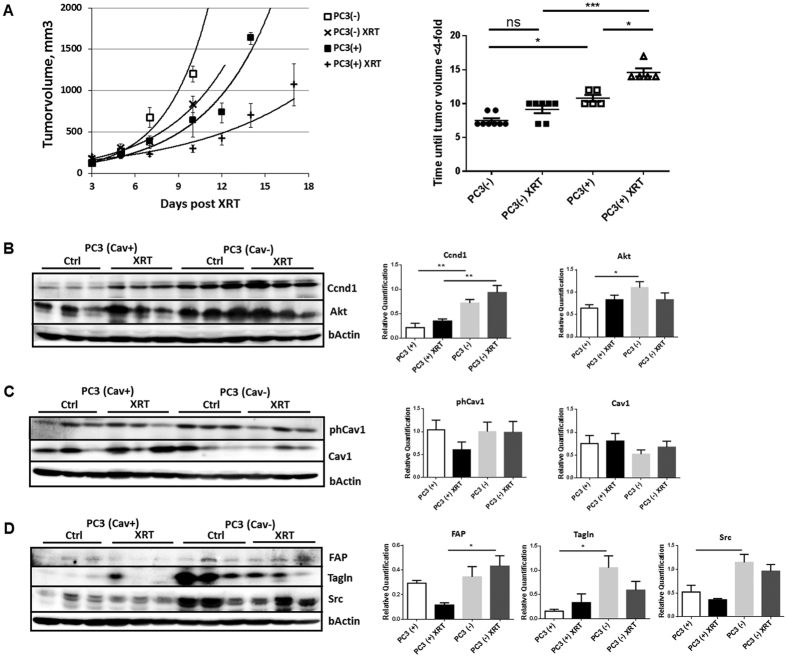
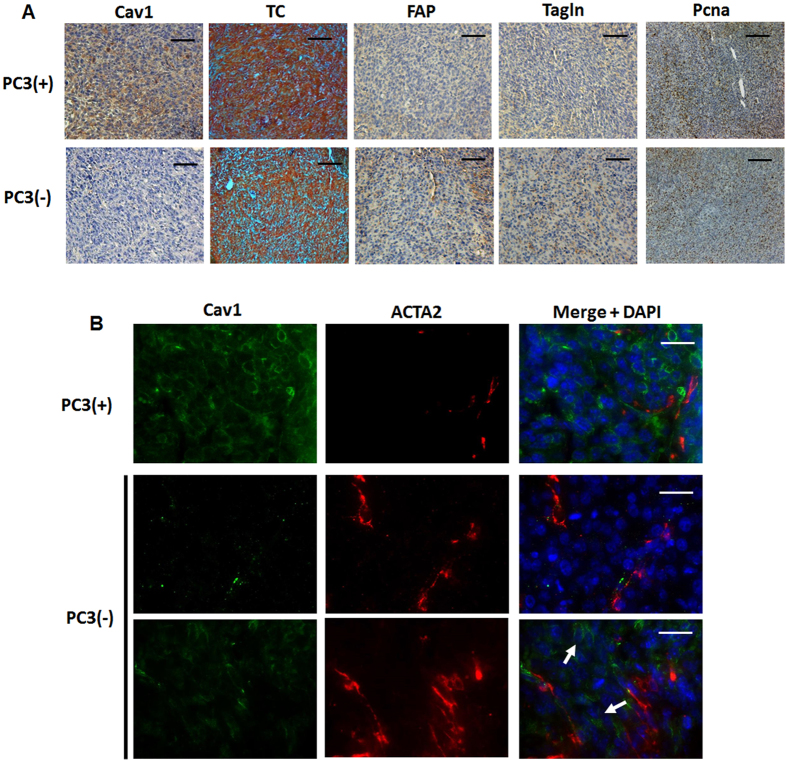
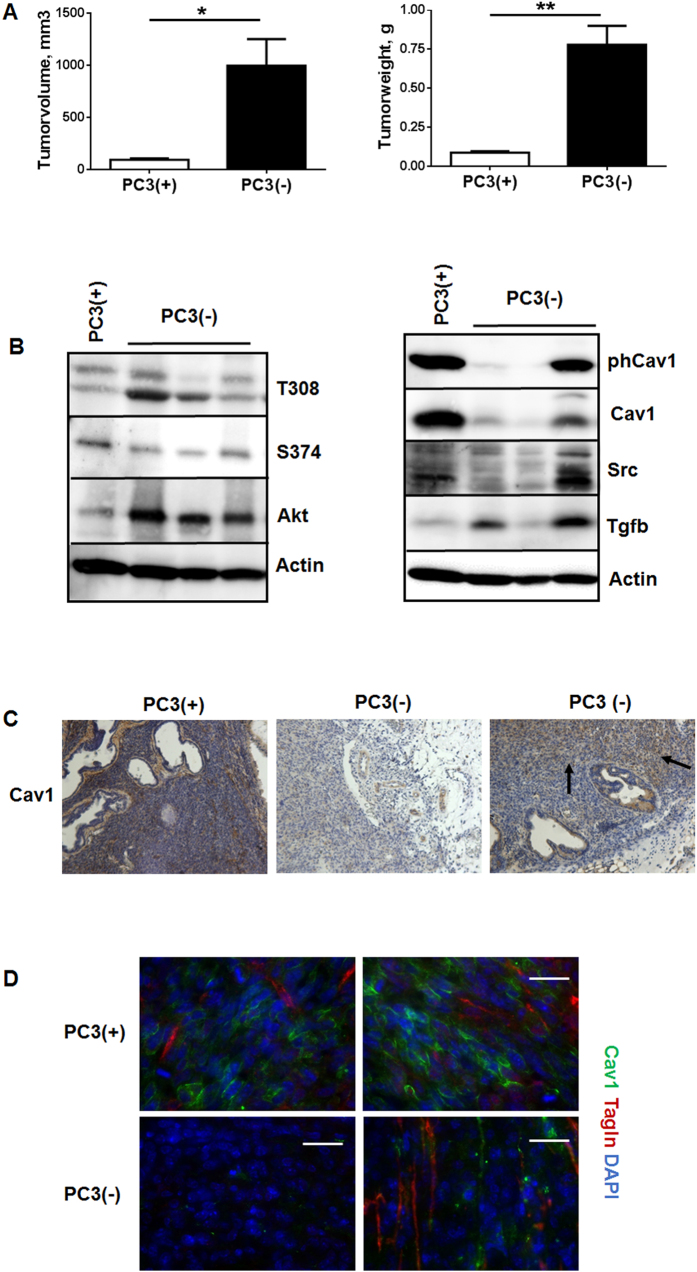
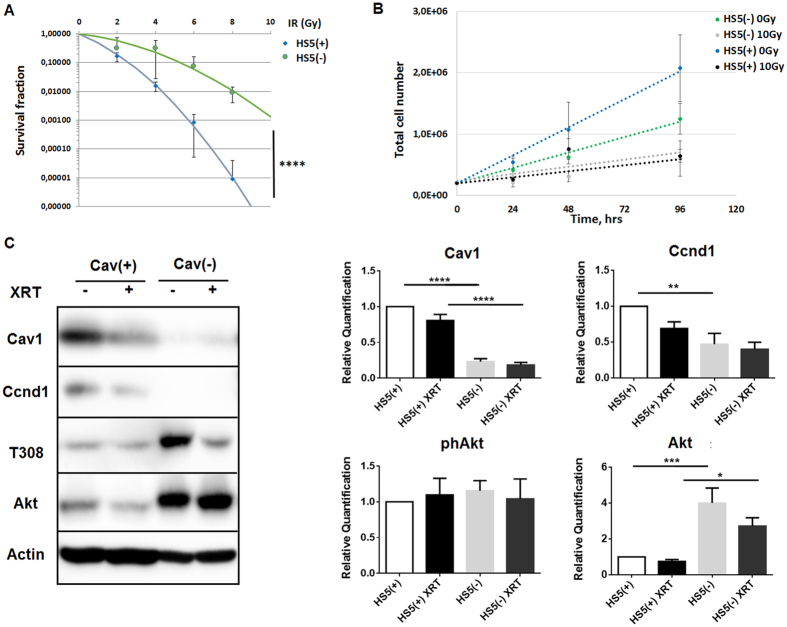
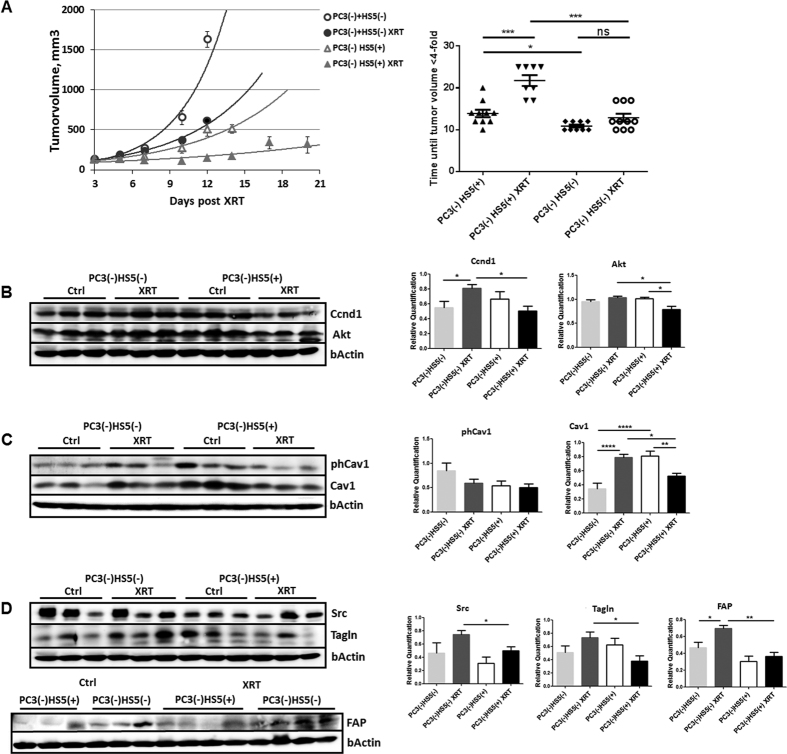
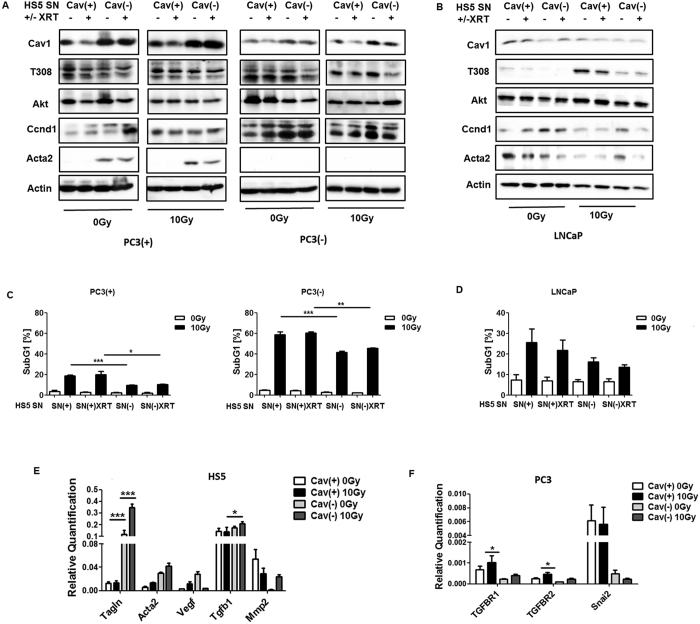
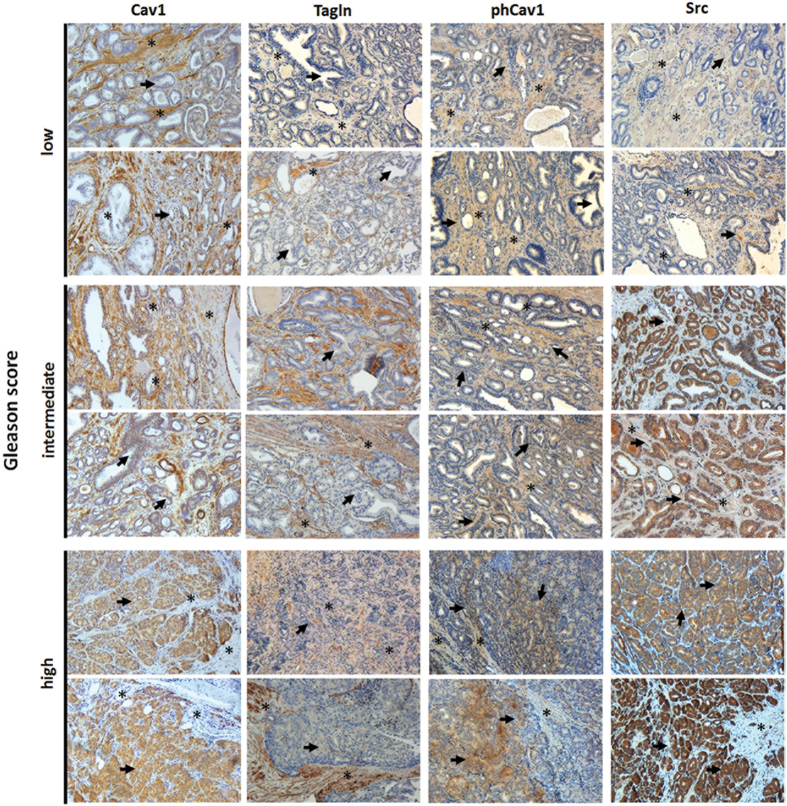
Despite good treatment results in localized prostate tumors, advanced disease stages usually have a pronounced resistance to chemotherapy and radiotherapy. The membrane protein caveolin-1 (Cav1) functions here as an important oncogene. Therefore we examined the impact of stromal Cav1 expression for tumor growth and sensitivity to ionizing radiation (IR). Silencing of Cav1 expression in PC3 cells resulted in increased tumor growth and a reduced growth delay after IR when compared to tumors generated by Cav1-expressing PC3 cells. The increased radiation resistance was associated with increasing amounts of reactive tumor stroma and a Cav1 re-expression in the malignant epithelial cells. Mimicking the human situation these results were confirmed using co-implantation of Cav1-silenced PC3 cells with Cav1-silenced or Cav1-expressing fibroblasts. Immunohistochemically analysis of irradiated tumors as well as human prostate tissue specimen confirmed that alterations in stromal-epithelial Cav1 expressions were accompanied by a more reactive Cav1-reduced tumor stroma after radiation and within advanced prostate cancer tissues which potentially mediates the resistance to radiation treatment. Conclusively, the radiation response of human prostate tumors is critically regulated by Cav1 expression in stromal fibroblasts. Loss of stromal Cav1 expression in advanced tumor stages may thus contribute to resistance of these tumors to radiotherapy.


Figures

Figure 1
Figure 1. Reduction of Cav1 levels decreased survival of clonogenic epithelial PC3 while proliferation was increased in vitro.
(A) PC3 (shCav1-transfected tumor cells [PC3(−)] as well as PC3 shCtrl control cells [PC3(+)] with normal Cav1 expression) cells were plated for colony formation assay, irradiated with indicated doses (0–8 Gy) and subsequently further incubated for additional 10 days. Data show the surviving fractions from three independent experiments measured in triplicates each (means ± SD). ***P ≤ 0.005 by two-tailed students T-test. (B) Cell proliferation was analyzed by cell counting in cultured shCav1-transfected PC3(−) and control-transfected PC3(+) epithelial cells at the indicated time points after irradiation with 10 Gy. Data are shown as means ± SEM of three independent experiments. (C) Expression levels of the indicated proteins were analyzed in whole protein lysates of cultured PC3 cells (+/−Cav1) with or without radiation (48 hours after XRT with 10 Gy) using Western blot analysis. Representative blots are shown. For quantification blots were analyzed by densitometry and the respective signal was related to beta-actin (n = 4–5 for each group). For determination of the Akt phosphorylation status the obtained phospho-specific signal was related to the signal of the total protein (phAkt/Akt). P-values were indicated: *P ≤ 0.05, **P ≤ 0.01, ****P ≤ 0.001, by one-way ANOVA followed by post-hoc Tukey test.
Figure 2
Figure 2. Single dose irradiation (10 Gy) decreased growth of PC3 xenograft tumors more efficiently in Cav1-expressing PC3 tumors which was accompanied by a less reactive tumor stroma.
(A) PC3 shCav1 tumor cells [PC3(−)] as well as PC3 shCtrl control cells [PC3(+)] with normal Cav1 expression (0.5*106 cells each) were subcutaneously transplanted onto the hind limb of NMRI nude mice. One set of animals from each group received a single radiation dose of 10 Gy to the tumor after manifestation of the tumor at day 3. Tumor volume was determined at indicated time points using a sliding caliper (left diagram). Data are presented as mean ± SEM from 3 independent experiments (25 mice in total: PC3(+) 0 Gy n = 5; PC3(+) 10 Gy n = 5; PC3(−) 0 Gy n = 8; PC3(−) 10 Gy n = 7). Tumor growth and respective computed median growth delay was determined as time (days) until a four-fold tumor volume was reached (right diagram). *p < 0.05, ***p < 0.005 by one-way ANOVA followed by post-hoc Tukey’s test. (BD) Expression levels of the indicated proteins were analyzed in whole protein lysates using Western blot analysis. Representative blots are shown. For quantification blots were analyzed by densitometry and the respective signal was related to beta-actin (at least n = 4 for each group). When the phosphorylation status was determined the obtained phospho-specific signal was related to the signal of the total protein (phCav1/Cav1). P-values were indicated: **P ≤ 0.01, ***P ≤ 0.01, by one-way ANOVA followed by post-hoc Tukey test.
Figure 3
Figure 3. Prostate tumors grown from Cav1-silenced PC3 cells were accompanied by a more reactive tumor stroma.
(A) Tumors derived from shCav1 PC3 cells [PC3(−)] as well as from PC3 shCtrl control cells [PC3(+)] with normal Cav1 expression were removed when tumor volumes reached a critical size (8–14 days after implantation) and were then subjected to immunohistochemistry with the indicated antibodies. Masson´s Goldner Trichrome (TC) was performed in order to visualize the collagenous stroma. Representative images are shown. Sections were counterstained using hematoxylin. Magnification Cav1, TC, FAP, Tagln 20x; Pcna 10x. (B) Subcutaneously grown tumors were further analyzed by immunofluorescence and confocal microscopy. Tumor stroma was stained for smooth muscle actin (ACTA2; red) and Cav1 (green). Arrows point towards Cav1-positive PC3(−) epithelial cells which were supposed to become immunoreactive for Cav1 upon tumor progression. Representative images from at least three independent experiments are shown. Magnification 63x (scale bar 50 μm).
Figure 4
Figure 4. Orthotopic tumors derived from Cav1-silenced PC3(−) cells showed a significantly increased tumor growth and epithelial Cav1 (re-) expressions.
(A) PC3 (+/−Cav1) cells were injected into the right and left dorsolateral lobe (0.5 × 105 cells per lobe) of the prostate of NMRI nude mice. Tumor weight and volume was determined 14 days after tumor cell implantation. Data are presented as mean ± SEM from 3 independent experiments (16 mice in total: PC3(+) n = 7; PC3(−) n = 9); *P ≤ 0.05, **P ≤ 0.01 by two-tailed t-tests with Welch’s correction. (B) Expression levels of the indicated proteins were analyzed in whole protein lysates using Western blot analysis. Representative blots are shown. (C) Tumors derived from shCav1 PC3 cells as well as from shCtrl control cells with normal Cav1 expression were subjected to immunohistochemistry with Cav1 antibody. Representative images are shown. Sections were counterstained using hematoxylin. Arrows point towards Cav1-positive epithelial cells within tumors derived from implanted PC3(−) cells. Magnification 20x. (D) Orthotopic grown tumors were further analysed by immunofluorescence and confocal microscopy. Tumor stroma was stained for Tagln (red) and Cav1 (green). Representative images from at least three independent experiments are shown. Magnification 63x (scale bar 50 μm).
Figure 5
Figure 5. Reduction of Cav1 levels increased survival of clonogenic epithelial PC3 and stromal HS5 cells while proliferation was decreased in vitro.
(A) Lentiviral expression of a Cav1-specific siRNA (shCav1) in stromal HS5 fibroblasts resulted in an efficient and sustained down-regulation of Cav1 expression compared to control-transduced (shCtrl) cells as shown by Western blot analysis. β-actin (bActin) was included as loading control. Representative blots of at least three different experiments are shown. (A) HS5 (shCav1-transfected fibroblasts [HS5(−)] as well as shCtrl control cells [HS5(+)] with normal Cav1 expression) cells were plated for colony formation assay, irradiated with indicated doses (0–8 Gy) and subsequently further incubated for additional 10 days. Data show the surviving fractions from three independent experiments measured in triplicates each (means ± SD). ****P ≤ 0.001 by two-tailed students T-test. (B) Cell proliferation was analyzed by cell counting in cultured shCav1-transfected HS5(−) and control-transfected HS5(+) fibroblasts cells at the indicated time points after irradiation with 10 Gy. Data are shown as means ± SEM of three independent experiments. (C) Expression levels of the indicated proteins were analyzed in whole protein lysates of cultured HS5 cells (+/−Cav1) with or without radiation (48 hours after XRT with 10 Gy) using Western blot analysis. Representative blots are shown. For quantification blots were analyzed by densitometry and the respective signal was related to beta-actin (n = 4–5 for each group). For determination of the Akt phosphorylation status the obtained phospho-specific signal was related to the signal of the total protein (phAkt/Akt). P-values were indicated: *P ≤ 0.05; **P ≤ 0.01; ***P ≤ 0.005 ****P ≤ 0.001; by one-way ANOVA followed by post-hoc Tukey test.
Figure 6
Figure 6. Cav1-deficient stromal fibroblasts mediated radiation resistance.
(A) Co-implantations of PC3 tumor cells (0.5*106 cells each) after Cav1 silencing [shCav1, PC3(−)] in combination HS5 Cav1-silenced fibroblasts [shCav1, HS5(−)] (0.5*106 cells each) or control fibroblasts [shCtrl, HS5(+)] were performed by subcutaneously transplanted onto the hind limb of NMRI nude mice. One set of animals from each group received a single radiation dose of 10 Gy to the tumor after manifestation of the tumor at day 3. Tumor volume was determined at indicated time points using a sliding caliper (left diagram). Data are presented as mean ± SEM from 3 independent experiments (37 mice in total: PC3(−)HS5(+) 0 Gy n = 10; PC3(−)HS5(+) 10 Gy n = 8; PC3(−)HS5(−) 0 Gy n = 9; PC3(−)HS5(−) 10 Gy n = 10). Tumor growth and respective computed median growth delay was determined as time (days) until a four-fold tumor volume was reached (right diagram). *p < 0.05, ***p < 0.005 by one-way ANOVA followed by post-hoc Tukey’s test. (BD) Expression levels of indicated proteins were analyzed in whole protein lysates using Western blot analysis. Representative blots are shown. For quantification blots were analyzed by densitometry and the respective signal was related to beta-actin (at least n = 4 for each group). When the Cav1 phosphorylation status was determined the obtained phospho-specific signal was related to the signal of the total Cav1 protein [phCav1/Cav1]. P-values were indicated: *p < 0.05, **p ≤ 0.01, ***p ≤ 0.005, ****P ≤ 0.001 by one-way ANOVA followed by post-hoc Tukey test.
Figure 7
Figure 7. Treatment of cultured PC3 (+/−Cav1) or Cav1-deficient LNCaP malignant epithelial cells with supernatants derived from Cav1-silenced HS5 fibroblasts fostered radiation resistance.
(A,B) PC3 (shCav1-transfected tumor cells [PC3(−)] as well as PC3 shCtrl control cells [PC3(+)] with normal Cav1 expression) and Cav1-deficient LNCaP cells were irradiated with 10 Gy and subsequently treated with supernatants (SN) derived from cultured Cav1-silenced HS5(−) or control transfected Cav1-expressing HS5(+) fibroblasts with or without radiation treatment (+/−XRT with 10 Gy). Western blot analysis of whole protein lysates was performed after 48 hours of treatment using the indicated antibodies. (C,D) The degree of apoptosis was quantified by measuring the SubG1 fraction 48 hours after radiation by flow cytometry analysis. Therefore, PC3cells (+/−Cav1) and Cav1-deficient LNCaP cells were left non-irradiated (white bars) or irradiated with 10 Gy (black bars) and subsequently treated with SN derived from cultured Cav1-silenced HS5(−) or Cav1-expressing HS5(+) fibroblasts with or without radiation treatment (+/−XRT with 10 Gy). (E) Quantitative Real Time RT-PCR (qRT-PCR) analysis of the reactive fibroblasts markers Acta2, Tagln as well as the tumor-promoting factors Vegf (vascular endothelial growth factor), Tgfb and Mmp2 (matrix metalloproteinase 2) were performed in total RNA isolates of Cav1-silenced HS5(−) or control transfected Cav1-expressing HS5(+) fibroblasts with or without radiation treatment (+/−XRT with 10 Gy) and were shown as relative expression to actin (set as 1) at 96 hours post irradiation. Shown are mean values ± SEM from 4 independent samples per group measured in duplicates each. *P ≤ 0.05, ***P ≤ 0.005, by one-way ANOVA followed by post-hoc Tukey’s test. (F) Expression levels of the Tgfb receptors TGFBR1 and TGFBR2 as well as the E-cadherin repressing EMT gene Snai2 were analyzed in whole RNA isolates of cultured PC3 cells (+/−Cav1) with or without radiation (48 hours after XRT with 10 Gy) using qRT-PCR analysis. Shown are mean values ± SEM from 4 independent samples per group measured in duplicates each. *P ≤ 0.05 by one-way ANOVA followed by post-hoc Tukey’s test.
Figure 8
Figure 8. Immunohistological analysis of Cav1 expressions in human prostate tumor tissues.
Paraffin-sections of human prostate tumors were stained for the indicated antibodies. Gleason grading scores used to evaluate prognosis of men with prostate cancer were divided into low (1 + 1, 2 + 2), intermediate (3 + 3, 4 + 3) and high scores (4 + 5) according to the sum of the primary and secondary Gleason patterns in whole resection specimens. The observed patterns of the tumor specimen were assigned based on current WHO and updated ISUP criteria: the primary grade - assigned to the dominant pattern of the tumor (has to be greater than 50% of the total pattern seen) as well as a secondary grade - assigned to the next-most frequent pattern (has to be less than 50%, but at least 5%, of the pattern of the total cancer observed). Asterisks mark stromal compartments and bold arrows point to epithelial structures. Sections were counterstained using hematoxylin. Representative images are shown. Magnification 20x.

Similar articles

Cited by

References

    1. Singh S. R., Rameshwar P. & Siegel P. Targeting tumor microenvironment in cancer therapy. Cancer letters, doi: 10.1016/j.canlet.2016.04.009 (2016). - DOI - PubMed
    1. Sun Y. Tumor microenvironment and cancer therapy resistance. Cancer letters, doi: 10.1016/j.canlet.2015.07.044 (2015). - DOI - PubMed
    1. Cheng C. J. et al.. MicroRNA silencing for cancer therapy targeted to the tumour microenvironment. Nature 518, 107–110, doi: 10.1038/nature13905 (2015). - DOI - PMC - PubMed
    1. Masuda S. & Izpisua Belmonte J. C. The microenvironment and resistance to personalized cancer therapy. Nature reviews. Clinical oncology 10, doi: 10.1038/nrclinonc.2012.127-c1 (2013). - DOI - PubMed
    1. Swartz M. A. et al.. Tumor microenvironment complexity: emerging roles in cancer therapy. Cancer research 72, 2473–2480, doi: 10.1158/0008-5472.CAN-12-0122 (2012). - DOI - PMC - PubMed

Publication types

LinkOut - more resources