Estimating organ doses from tube current modulated CT examinations using a generalized linear model
- PMID: 28112399
- PMCID: PMC6192538
- DOI: 10.1002/mp.12119
Estimating organ doses from tube current modulated CT examinations using a generalized linear model
Erratum in
-
Erratum: "Estimating organ doses from tube current modulated CT examinations using a generalized linear model" [Med. Phys. Vol 44 (4), 1500-1513 (2017)].Med Phys. 2017 Jul;44(7):3883. doi: 10.1002/mp.12324. Epub 2017 Jun 16. Med Phys. 2017. PMID: 28685929 Free PMC article. No abstract available.
Abstract
Purpose: Currently, available Computed Tomography dose metrics are mostly based on fixed tube current Monte Carlo (MC) simulations and/or physical measurements such as the size specific dose estimate (SSDE). In addition to not being able to account for Tube Current Modulation (TCM), these dose metrics do not represent actual patient dose. The purpose of this study was to generate and evaluate a dose estimation model based on the Generalized Linear Model (GLM), which extends the ability to estimate organ dose from tube current modulated examinations by incorporating regional descriptors of patient size, scanner output, and other scan-specific variables as needed.
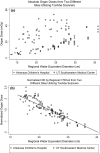
Methods: The collection of a total of 332 patient CT scans at four different institutions was approved by each institution's IRB and used to generate and test organ dose estimation models. The patient population consisted of pediatric and adult patients and included thoracic and abdomen/pelvis scans. The scans were performed on three different CT scanner systems. Manual segmentation of organs, depending on the examined anatomy, was performed on each patient's image series. In addition to the collected images, detailed TCM data were collected for all patients scanned on Siemens CT scanners, while for all GE and Toshiba patients, data representing z-axis-only TCM, extracted from the DICOM header of the images, were used for TCM simulations. A validated MC dosimetry package was used to perform detailed simulation of CT examinations on all 332 patient models to estimate dose to each segmented organ (lungs, breasts, liver, spleen, and kidneys), denoted as reference organ dose values. Approximately 60% of the data were used to train a dose estimation model, while the remaining 40% was used to evaluate performance. Two different methodologies were explored using GLM to generate a dose estimation model: (a) using the conventional exponential relationship between normalized organ dose and size with regional water equivalent diameter (WED) and regional CTDIvol as variables and (b) using the same exponential relationship with the addition of categorical variables such as scanner model and organ to provide a more complete estimate of factors that may affect organ dose. Finally, estimates from generated models were compared to those obtained from SSDE and ImPACT.
Results: The Generalized Linear Model yielded organ dose estimates that were significantly closer to the MC reference organ dose values than were organ doses estimated via SSDE or ImPACT. Moreover, the GLM estimates were better than those of SSDE or ImPACT irrespective of whether or not categorical variables were used in the model. While the improvement associated with a categorical variable was substantial in estimating breast dose, the improvement was minor for other organs.
Conclusions: The GLM approach extends the current CT dose estimation methods by allowing the use of additional variables to more accurately estimate organ dose from TCM scans. Thus, this approach may be able to overcome the limitations of current CT dose metrics to provide more accurate estimates of patient dose, in particular, dose to organs with considerable variability across the population.
Keywords: CT; Monte Carlo simulations; generalized linear model; organ dose estimation; tube current modulation.
© 2017 American Association of Physicists in Medicine.
Conflict of interest statement
Michael F. McNitt‐Gray has the following disclosures: Institutional research agreement, Siemens Healthcare, Paid Consultant — Toshiba America Medical Systems, Paid Consultant — Samsung Electronics. Other authors have no relevant conflicts of interest to disclose.
Figures


References
-
- McCollough CH, Bruesewitz MR, Kofler JM Jr. CT dose reduction and dose management tools: overview of available options. Radiographics. 2006;26:503–512. - PubMed
-
- Schlattl H, Zankl M, Becker J, Hoeschen C. Dose conversion coefficients for CT examinations of adults with automatic tube current modulation. Phys Med Biol. 2010;55:6243–6261. - PubMed
-
- Schlattl H, Zankl M, Becker J, Hoeschen C. Dose conversion coefficients for paediatric CT examinations with automatic tube current modulation. Phys Med Biol. 2012;57:6309–6326. - PubMed
-
- Gies M, Kalender WA, Wolf H, Suess C. Dose reduction in CT by anatomically adapted tube current modulation. I. Simulation studies. Med Phys. 1999;26:2235–2247. - PubMed
MeSH terms
Grants and funding
LinkOut - more resources
Full Text Sources
Other Literature Sources
Medical

