

Intrinsic dependencies of CT radiomic features on voxel size and number of gray levels
- PMID: 28112418
- PMCID: PMC5462462
- DOI: 10.1002/mp.12123
Intrinsic dependencies of CT radiomic features on voxel size and number of gray levels
Abstract
Purpose: Many radiomics features were originally developed for non-medical imaging applications and therefore original assumptions may need to be reexamined. In this study, we investigated the impact of slice thickness and pixel spacing (or pixel size) on radiomics features extracted from Computed Tomography (CT) phantom images acquired with different scanners as well as different acquisition and reconstruction parameters. The dependence of CT texture features on gray-level discretization was also evaluated.
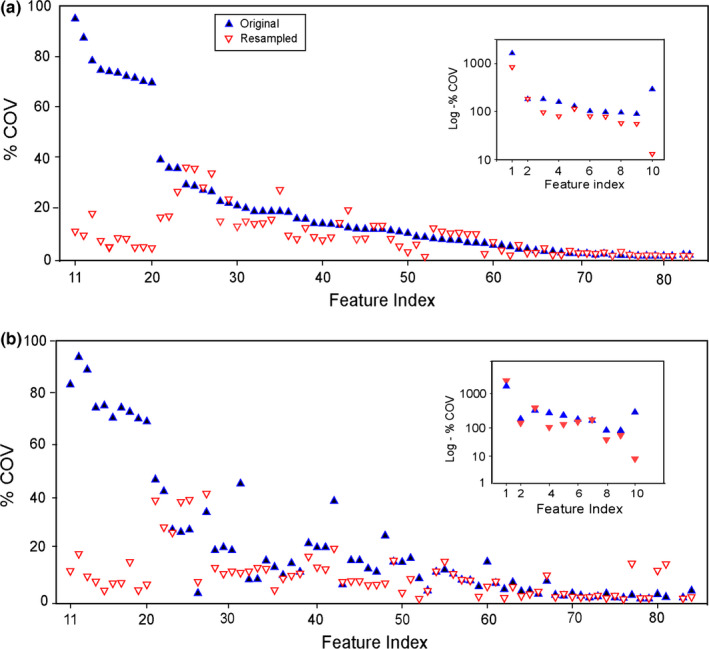
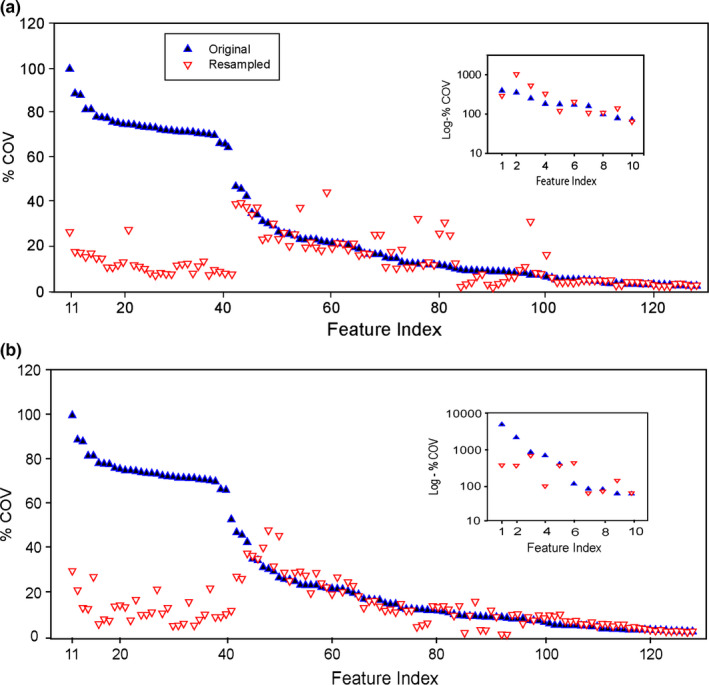
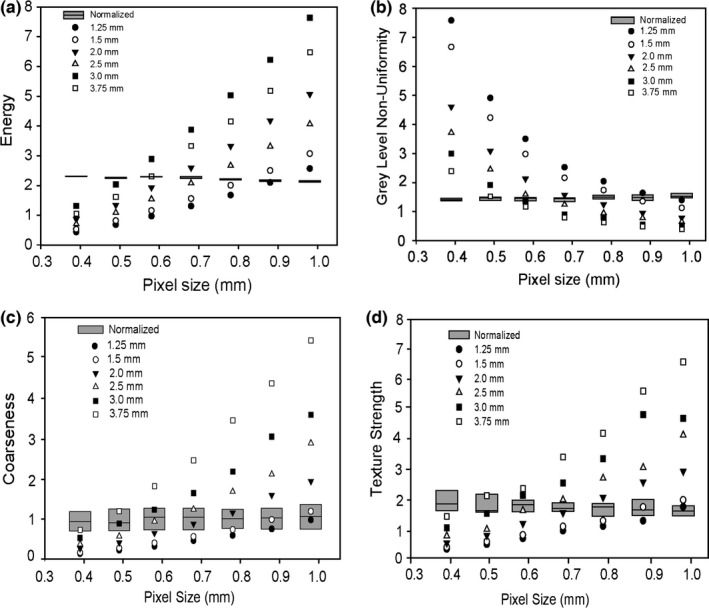
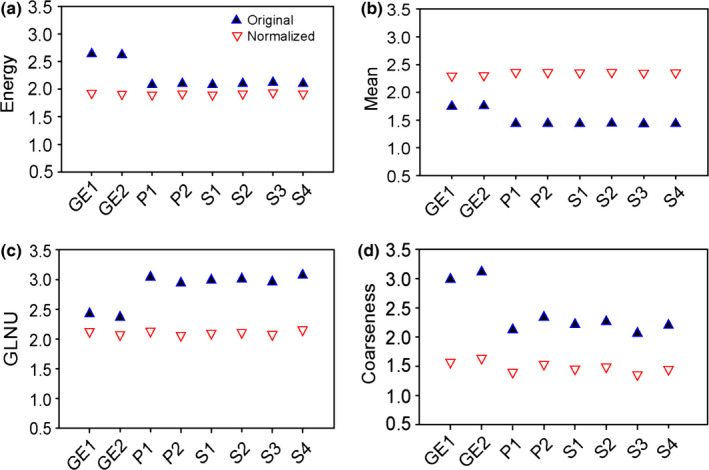
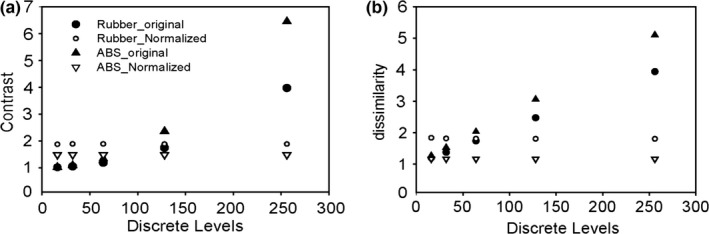
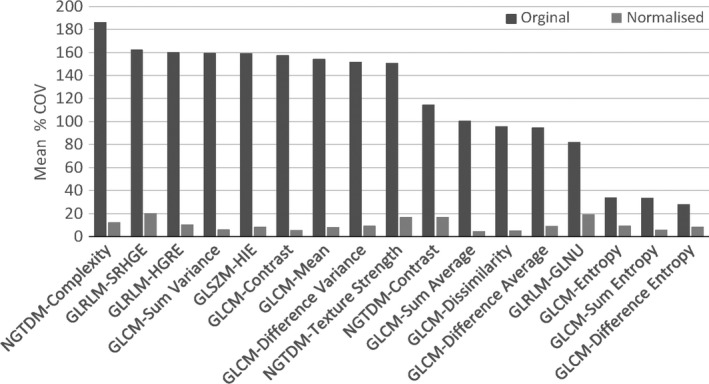
Methods and materials: A texture phantom composed of 10 different cartridges of different materials was scanned on eight different CT scanners from three different manufacturers. The images were reconstructed for various slice thicknesses. For each slice thickness, the reconstruction Field Of View (FOV) was varied to render pixel sizes ranging from 0.39 to 0.98 mm. A fixed spherical region of interest (ROI) was contoured on the images of the shredded rubber cartridge and the 3D printed, 20% fill, acrylonitrile butadiene styrene plastic cartridge (ABS20) for all phantom imaging sets. Radiomic features were extracted from the ROIs using an in-house program. Features categories were: shape (10), intensity (16), GLCM (24), GLZSM (11), GLRLM (11), and NGTDM (5), fractal dimensions (8) and first-order wavelets (128), for a total of 213 features. Voxel-size resampling was performed to investigate the usefulness of extracting features using a suitably chosen voxel size. Acquired phantom image sets were resampled to a voxel size of 1 × 1 × 2 mm3 using linear interpolation. Image features were therefore extracted from resampled and original datasets and the absolute value of the percent coefficient of variation (%COV) for each feature was calculated. Based on the %COV values, features were classified in 3 groups: (1) features with large variations before and after resampling (%COV >50); (2) features with diminished variation (%COV <30) after resampling; and (3) features that had originally moderate variation (%COV <50%) and were negligibly affected by resampling. Group 2 features were further studied by modifying feature definitions to include voxel size. Original and voxel-size normalized features were used for interscanner comparisons. A subsequent analysis investigated feature dependency on gray-level discretization by extracting 51 texture features from ROIs from each of the 10 different phantom cartridges using 16, 32, 64, 128, and 256 gray levels.
Results: Out of the 213 features extracted, 150 were reproducible across voxel sizes, 42 improved significantly (%COV <30, Group 2) after resampling, and 21 had large variations before and after resampling (Group 1). Ten features improved significantly after definition modification effectively removed their voxel-size dependency. Interscanner comparison indicated that feature variability among scanners nearly vanished for 8 of these 10 features. Furthermore, 17 out of 51 texture features were found to be dependent on the number of gray levels. These features were redefined to include the number of gray levels which greatly reduced this dependency.
Conclusion: Voxel-size resampling is an appropriate pre-processing step for image datasets acquired with variable voxel sizes to obtain more reproducible CT features. We found that some of the radiomics features were voxel size and gray-level discretization-dependent. The introduction of normalizing factors in their definitions greatly reduced or removed these dependencies.
Keywords: computed tomography; features; gray levels; phantom; radiomics; texture; voxel size.
© 2017 American Association of Physicists in Medicine.
Conflict of interest statement
None declared.
Figures
References
-
- Kuo MD, Gollub J, Sirlin CB, Ooi C, Chen X. Radiogenomic analysis to identify imaging phenotypes associated with drug response gene expression programs in hepatocellular carcinoma. J Vasc Interv Radiol. 2007;18:821–830. - PubMed
-
- Lee H‐J, Kim YT, Kang CH, et al. Epidermal growth factor receptor mutation in lung adenocarcinomas: Relationship with CT characteristics and histologic subtypes. Radiology. 2013;268:254–264. - PubMed
MeSH terms
Grants and funding
LinkOut - more resources
Full Text Sources
Other Literature Sources
Medical
