. 2017 Feb 1;127(2):720-734.
doi: 10.1172/JCI90132. Epub 2017 Jan 23.

Chemogenetic stimulation of striatal projection neurons modulates responses to Parkinson's disease therapy

Chemogenetic stimulation of striatal projection neurons modulates responses to Parkinson's disease therapy

Cristina Alcacer et al. J Clin Invest. .

Abstract

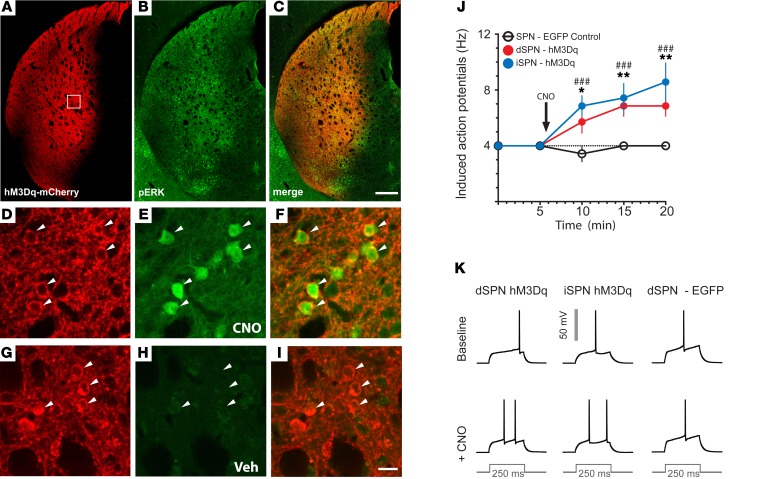
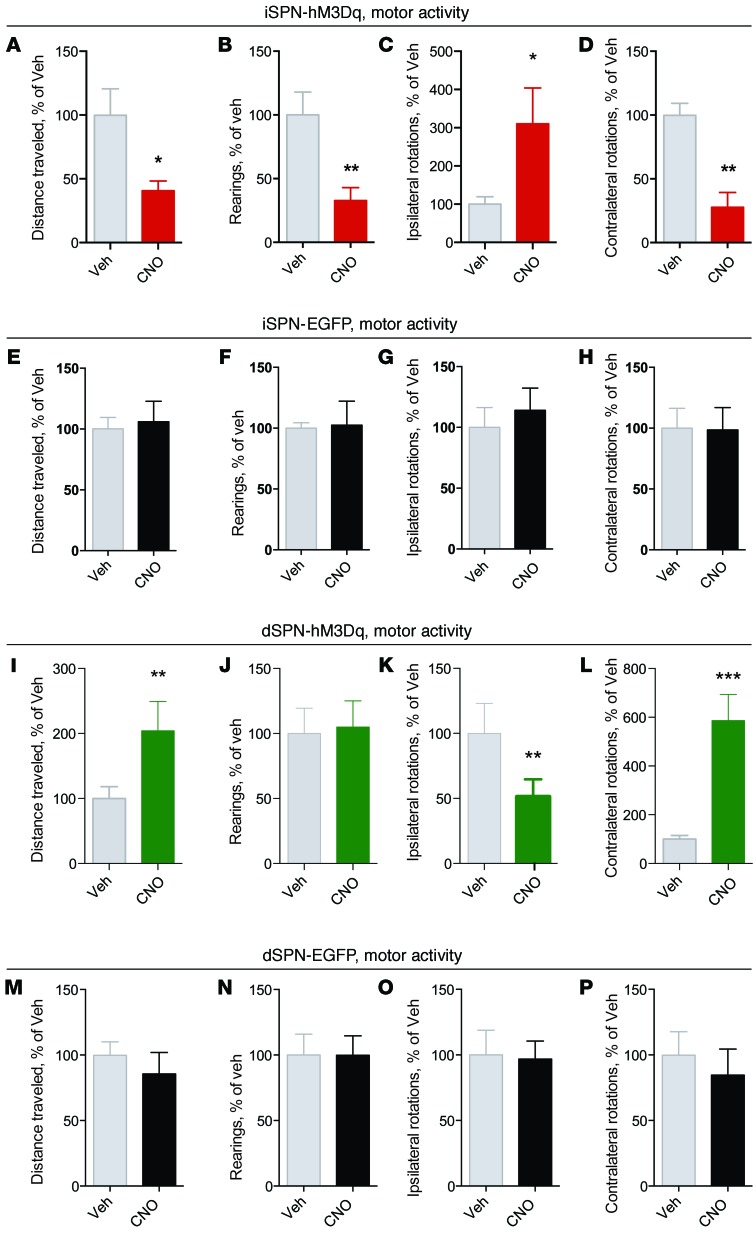
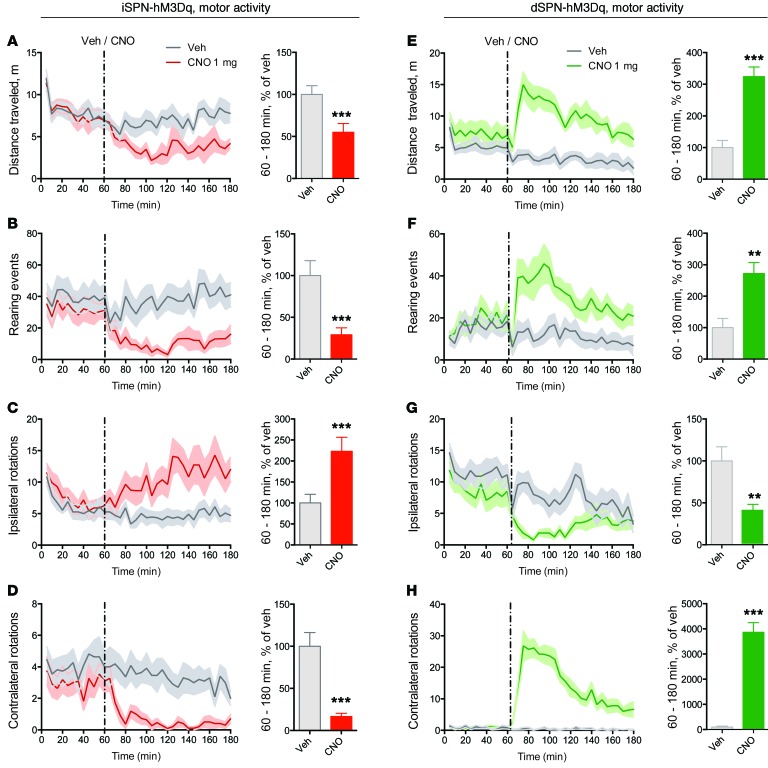
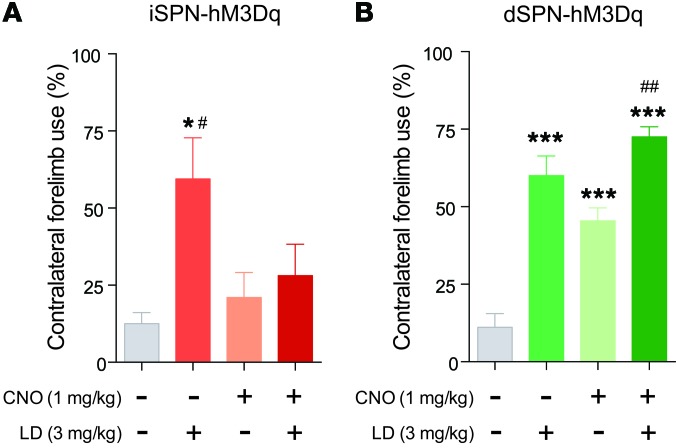
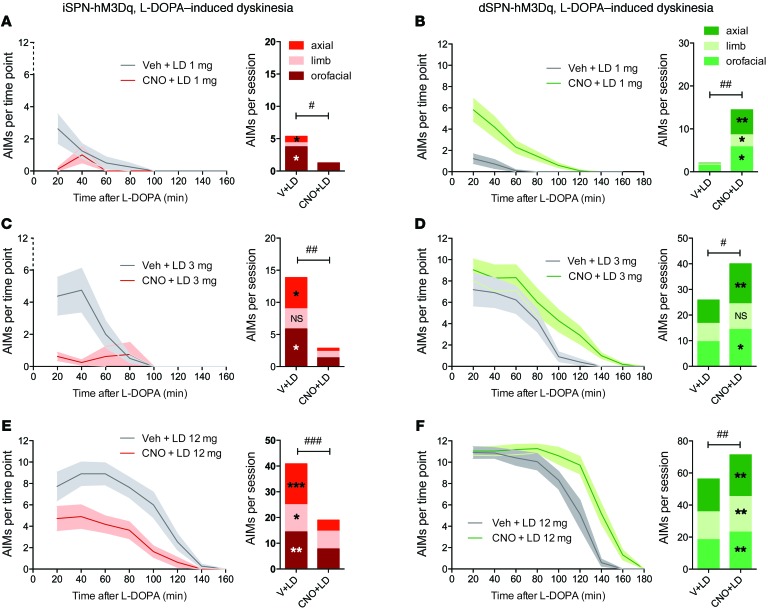
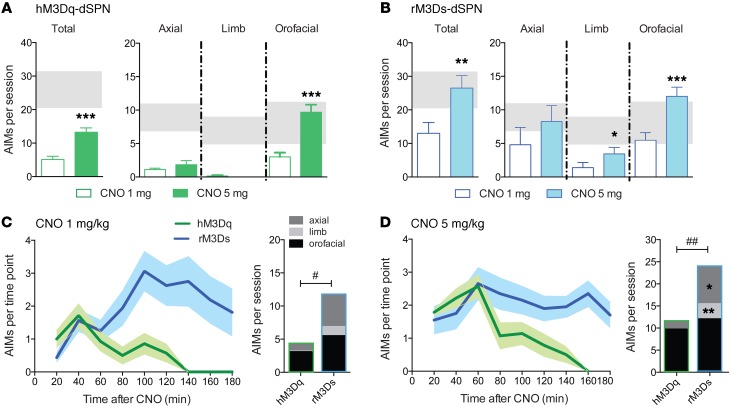
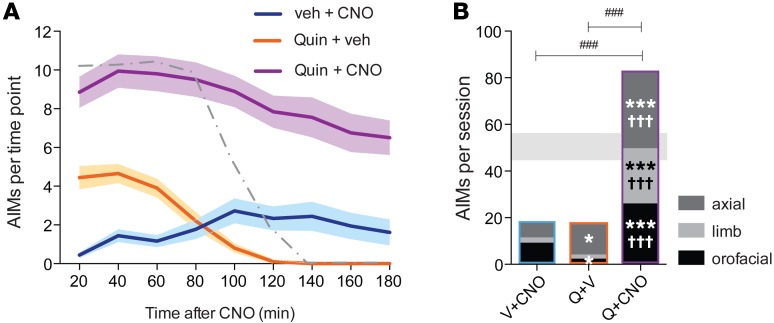
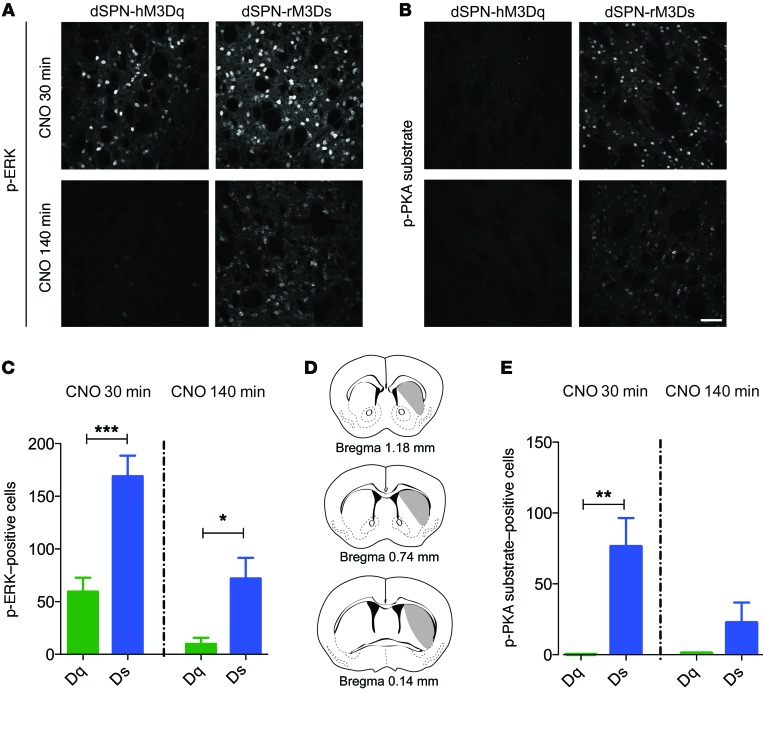
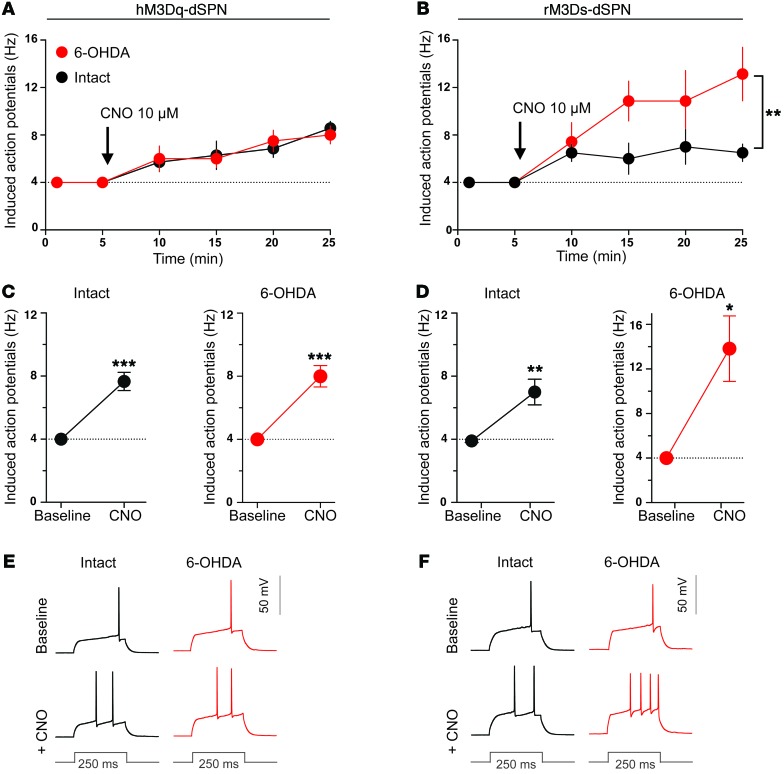
Parkinson's disease (PD) patients experience loss of normal motor function (hypokinesia), but can develop uncontrollable movements known as dyskinesia upon treatment with L-DOPA. Poverty or excess of movement in PD has been attributed to overactivity of striatal projection neurons forming either the indirect (iSPNs) or the direct (dSPNs) pathway, respectively. Here, we investigated the two pathways' contribution to different motor features using SPN type-specific chemogenetic stimulation in rodent models of PD (PD mice) and L-DOPA-induced dyskinesia (LID mice). Using the activatory Gq-coupled human M3 muscarinic receptor (hM3Dq), we found that chemogenetic stimulation of dSPNs mimicked, while stimulation of iSPNs abolished the therapeutic action of L-DOPA in PD mice. In LID mice, hM3Dq stimulation of dSPNs exacerbated dyskinetic responses to L-DOPA, while stimulation of iSPNs inhibited these responses. In the absence of L-DOPA, only chemogenetic stimulation of dSPNs mediated through the Gs-coupled modified rat muscarinic M3 receptor (rM3Ds) induced appreciable dyskinesia in PD mice. Combining D2 receptor agonist treatment with rM3Ds-dSPN stimulation reproduced all symptoms of LID. These results demonstrate that dSPNs and iSPNs oppositely modulate both therapeutic and dyskinetic responses to dopamine replacement therapy in PD. We also show that chemogenetic stimulation of different signaling pathways in dSPNs leads to markedly different motor outcomes. Our findings have important implications for the design of effective antiparkinsonian and antidyskinetic drug therapies.


Conflict of interest statement

The authors have declared that no conflict of interest exists.

Figures

Figure 1
Figure 1. Histomolecular and electrophysiological validation of hM3Dq.
(A-I) Photomicrographs were acquired from A2a-Cre transgenic mice injected intrastriatally with the AAV5-hSyn-DIO-hM3Dq-mCherry vector. (A) Low-magnification photograph shows mCherry expression (revealed with RFP antibody) throughout the caudate-putamen (dorsolateral striatum). (B) The transduced striatal region shows positive immunostaining for p-ERK after treatment with CNO (1 mg/kg). (C) Merged confocal photograph demonstrates regional colocalization of hM3Dq-mCherry and p-ERK. (D) High-magnification photomicrograph of a transduced area (cf. inset in A) reveals mCherry immunoreactivity in both neuropile and SPN somas (indicated by arrows). (E) p-ERK immunoreactivity in transduced SPNs after treatment with CNO. (F) Cellular colocalization of the 2 markers demonstrated by the merged confocal picture. (G-I) No p-ERK immunostaining was observed in transduced SPNs after vehicle treatment. Scale bars: 400 μm (AC); 20 μm (DI). (J and K) Electrophysiological response to CNO in hM3Dq- and EGFP-transduced dSPN and iSPN from D1-Cre and A2a-Cre intact mice. Whole-cell patch clamp recordings were made in ex vivo slices from SPNs transduced with hM3Dq or EGFP. (J) Bath application of CNO (10 μM) gradually increased the number of APs induced by brief somatic current pulses in both dSPNs and iSPNs transduced with hM3Dq, but no increase was observed in the control group. RM 2-way ANOVA (n = 7 cells per data set): effect of group, F(2, 18) = 15.80, P = 0.0001; time (effect of CNO), F(4, 72) = 11.29, P = 0.0001; interaction, F(8, 72) = 3.446, P = 0.0021. *P < 0.05; **P < 0.01 for the effect of CNO in dSPN-hM3Dq vs. dSPN-EGFP; ###P < 0.001 for the effect of CNO in iSPN-hM3Dq vs. dSPN-GFP. (K) Representative traces of AP responses to current injection, at baseline and after CNO application, in hM3Dq-transduced dSPNs and iSPNs and an EGFP-transduced dSPN.
Figure 2
Figure 2. Motor activity in an open field upon Gq-DREADD–mediated activation of iSPNs or dSPNs in intact mice.
Results from AAV-transduced A2a-Cre and D1-Cre mice are presented in AH and IP, respectively. (AD) iSPN-hM3Dq stimulation with CNO causes reductions in distance travelled (A) and rearing events (B) along with an ipsilateral rotational bias (C and D). Veh, vehicle. (EH) Treatment with CNO is without effect when iSPNs are transduced with a control vector (EGFP). (IL) dSPN-hM3Dq stimulation with CNO causes an increase in distance travelled (I), no significant change in vertical activity (J), and a contralateral rotational bias (K and L). (MP) Treatment with CNO does not affect any motor behavior when dSPNs are transduced with the control vector (EGFP). Data recorded after treatment with CNO (1 mg/kg) are expressed as a percentage of those measured after vehicle administration in the same mice. Values show mean + SEM from the following numbers of mice: n = 7 (iSPN-hM3Dq); n = 6 (iSPN-EGFP); n = 11 (dSPN-hM3Dq); n = 5 (dSPN-EGFP). Paired 2-tailed Student’s t test: *P < 0.05; **P < 0.01; ***P < 0.001 for CNO vs. vehicle. NS indicates P > 0.05.
Figure 3
Figure 3. Motor activity in an open field upon Gq-DREADD–mediated activation iSPNs or dSPNs in 6-OHDA–lesioned mice.
Data were acquired from A2a-Cre (AD) or D1-Cre mice (EH) transduced with the hM3Dq vector. Line diagrams show the time course of behavioral recordings, and hatched lines indicate the time point when mice were injected with either CNO or vehicle. Bar diagrams show recordings after treatment with CNO (1 mg/kg) expressed as a percentage of vehicle values. RM 2-way ANOVA: (A, E) distance travelled: (A) iSPN: treatment, F(1, 10) = 21.08, P < 0.01; time, F(35, 350) = 7.930, P < 0.001; interaction, F(35, 350) = 4.134, P < 0.001. (E) dSPN: treatment, F(1, 9) = 75.41, P < 0.001; time, F(35, 315) = 3.319, P < 0.001; interaction, F(35, 315) = 5.792, P < 0.001. (B, F) Rearing: (B) iSPN: treatment, F(1, 10) = 32.66, P < 0.001; time, F(35, 350) = 3.633, P < 0.001; interaction, F(35, 350) = 3.809, P < 0.001. (F) dSPN: treatment, F(1, 9) = 16.94, P < 0.01; time, F(35, 315) = 3.817, P < 0.001; interaction, F(35, 315) = 3.860, P < 0.001. (C, G) Ipsilateral rotations: (C) iSPN: treatment, F(1, 10) = 25.04, P < 0.001; time, F(35, 350) = 2.463, P < 0.001; interaction, F(35, 350) = 3.432, P < 0.001. (G) dSPN: treatment, F(1, 9) = 11.97, P < 0.01; time, F(35, 315) = 8.081, P < 0.001; interaction, F(35, 315) = 1.868, P < 0.01. (D, H) Contralateral rotations: (D) iSPN: treatment, F(1, 10) = 21.69, P < 0.001; time, F(35, 350) = 3.668, P < 0.001; interaction, F(35, 350) = 2.442, P < 0.001. (H) dSPN: treatment, F(1, 9) = 96.77, P < 0.001; time, F(35, 315) = 23.40, P < 0.001; interaction, F(35, 315) = 24.81, P < 0.001. Bar diagrams represent recordings made from 60 to 180 minutes. Data are expressed as mean + SEM from A2a-Cre mice (n = 11) and D1-Cre mice (n = 10). Paired 2-tailed Student’s t test: **P < 0.01; ***P < 0.001 for CNO vs. vehicle.
Figure 4
Figure 4. Gq-DREADD–mediated activation of iSPNs or dSPNs oppositely modulates therapeutic-like effects of L-DOPA in 6-OHDA–lesioned mice.
The beneficial effect of L-DOPA is represented by an increased use of the parkinsonian forelimb (percentage of contralateral forelimb use) in the cylinder test. Data were acquired 20 to 25 minutes after the administration of L-DOPA (LD) (3 mg/kg), CNO (1 mg/kg), or vehicle, as given alone or in combination. (A) Contralateral forelimb use in 6-OHDA–lesioned and hM3Dq-transduced A2a-Cre mice (n = 7). RM 1-way ANOVA: treatment, F(3, 18) = 7.219, P < 0.01. Post hoc Tukey’s test: *P < 0.05 vs. veh+veh; #P < 0.05 vs. CNO+veh. (B) Contralateral forelimb use in 6-OHDA–lesioned and hM3Dq-transduced D1-Cre mice (n = 11). RM 1-way ANOVA: treatment, F(3, 30) = 31.24, P < 0.001. Post hoc Tukey’s test: ***P < 0.001 vs. veh+veh; ##P < 0.01 vs. CNO+veh.
Figure 5
Figure 5. Modulation of LID behaviors in 6-OHDA–lesioned mice by Gq-DREADD–mediated activation of iSPNs or dSPNs.
AIMs of increasing severity were induced with escalating doses of L-DOPA, i.e., 1 mg/kg (A and B), 3 mg/kg (C and D), and 12 mg/kg (E and F). Data from 6-OHDA–lesioned and hM3Dq-transduced A2a-Cre mice (red line/bars) and D1-Cre mice (green line/bars) are presented in the left-hand column and right-hand column, respectively. Time courses of axial, limb, and orofacial AIM scores during the 180-minute test sessions are shown in A, C, and E (A2a-Cre mice) and B, D, and F (D1-Cre mice). RM 2-way ANOVA (n = 8–11 per group): (A and B) L-DOPA (1 mg/kg): (A) iSPN: treatment, F(1, 7) = 5.914, P < 0.05; time, F(7, 49) = 7.913, P < 0.001; interaction, F(7, 49) = 4.564, P < 0.001. (B) dSPN: treatment, F(1, 10) = 14.67, P < 0.01; time, F(7, 70) = 28.60, P < 0.001; interaction, F(8, 80) = 9.632, P < 0.001. (C and D) L-DOPA (3 mg/kg): (C) iSPN: treatment, F(1, 7) = 14.07, P < 0.01; time, F(7, 49) = 8.015, P < 0.001; interaction, F(7, 49) = 7.406, P < 0.001. (D) dSPN: treatment, F(1, 10) = 7.442, P < 0.05; time, F(8, 80) = 38.45, P < 0.001; interaction, F(8, 80) = 2.038, P = 0.052. (E and F) L-DOPA (12 mg/kg): (E) iSPN: treatment, F(1, 10) = 34.32, P < 0.001; time, F(7, 70) = 28.66, P < 0.001; interaction, F(7, 70) = 7.682, P < 0.001. (F) dSPN: treatment, F(1, 10) = 14.03, P < 0.01; time, F(8, 80) = 155.9, P < 0.001; interaction, F(8, 80) = 7.190, P < 0.001. Bar diagrams represent the sum of AIM scores per session, representing axial, limb and orofacial components using different colors. Paired 2-tailed Student’s t test: #P < 0.05; ##P < 0.01; ###P < 0.001 for CNO+LD vs. veh+LD on the total AIM score per session. *P < 0.05; **P < 0.01; ***P < 0.001 for CNO+LD vs. veh+LD on each individual AIM subtype.
Figure 6
Figure 6. Induction of dyskinetic behaviors by Gq- versus Gs-DREADD–dependent activation of dSPNs in L-DOPA–naive 6-OHDA–lesioned mice.
(A and B) Bar diagrams show the total AIM score per session and the separate axial, limb, and orofacial scores following treatment with the lowest and highest doses of CNO tested in this experiment (1 and 5 mg/kg, respectively; see horizontal captions). Gray-shaded areas represent the range (mean ± SEM) of AIM scores induced by a therapeutic dose of L-DOPA (3 mg/kg) in D1-Cre 6-OHDA–lesioned mice (cf. Figure 5D). Data are shown as mean + SEM from n = 7 mice transduced with hM3Dq and n = 8 mice transduced with rM3Ds. Paired 2-tailed Student’s t test: *P < 0.05; **P < 0.01; ***P < 0.001 for CNO 5 mg/kg vs. CNO 1 mg/kg. (C and D) Direct comparisons of CNO-induced AIMs in mice transduced with the 2 different types of DREADD. (C and D) Time course of AIMs after CNO injection (scored every 20 minutes until 180 minutes). Two-way RM ANOVA: (C) CNO (1 mg/kg): DREADD type, F(1, 13) = 6.737, P < 0.05; time, F(8, 104) = 3.557, P < 0.01; interaction, F(8, 104) = 3.557, P < 0.001. (D) CNO (5 mg/kg): DREADD type F(1, 15) = 4.352, P = 0.054; time, F(8, 120) = 7.903, P < 0.001; interaction, F(8, 120) = 6.549, P < 0.001. Bar diagrams show the sum of AIM scores per session, and scores accrued on each of axial, limb, and orofacial AIMs are represented using different shades of gray. Unpaired 2-tailed Student’s t test: total AIMs per session: #P < 0.05; ##P < 0.01 vs. hM3Dq. Individual AIM subtypes: *P < 0.05; **P < 0.01 vs. hM3Dq.
Figure 7
Figure 7. Combining chemogenetic dSPN-rM3Ds stimulation with D2 agonist treatment induces severe dyskinesias in 6-OHDA–lesioned mice.
Ratings of axial, limb, and orofacial AIMs were performed following treatment with CNO (1 mg/kg), quinpirole (Quin) (0.5 mg/kg), or a combination of both. (A) Time course of AIMs during the test sessions (scored every 20 minutes until 180 minutes after the injection of CNO). To compare dyskinesia time curves after different treatments, we introduced a dotted line representing AIMs induced by 12 mg/kg L-DOPA (which was tested in the same animals after completing the quinpirole/CNO sequence). RM 2-way ANOVA: (A) treatment, F(2, 26) = 46.87, P < 0.001; time, F(8, 208) = 25.14, P < 0.001; interaction, F(16, 208) = 17.41, P < 0.001. (B) Bar diagrams show the sum of AIM scores per session, where axial, limb, and orofacial AIMs are represented using different shades. The gray-shaded area represents the range (mean ± SEM) of AIM scores induced by 12 mg/kg L-DOPA. One-way ANOVA (n = 9): total AIMs: F(2, 23) = 13.2, P < 0.001; axial AIMS: F(2, 23) = 60.83, P < 0.001; limb AIMs: F(2, 23) = 68.80, P < 0.001; orofacial AIMs: F(2, 23) = 60.49, P < 0.001. Post hoc Tukey’s test: ###P < 0.001 for Q+CNO vs. the indicated treatments. Individual AIM subtypes: *P < 0.05; ***P < 0.001 vs. V+CNO; †††P < 0.001 vs. Q+V.
Figure 8
Figure 8. Activation of ERK and PKA signaling in the DA-denervated striatum upon chemogenetic stimulation of dSPNs via Gq- or Gs-DREADD.
D1-Cre mice sustained 6-OHDA lesions and were transduced with hM3Dq or rM3Ds constructs. Animals were perfusion fixed at 30 minutes or 140 minutes after an injection of CNO (1 mg/kg). (A and B) Confocal photographs of striatal sections immunostained for p-ERK or p-PKA substrate, respectively. Scale bar: 100 μm. (C and E) Average number of p-ERK– or p-PKA substrate–positive neurons, respectively, counted within DREADD-transduced regions (represented in D, further details in Methods). Two-factor ANOVA (n = 6–9 per group): (C) p-ERK: DREADD type, F(1, 24) = 33.82, P < 0.001; time point, F(1, 24) = 24.68, P < 0.001; interaction, F(1, 24) = 2.579, P = 0.121. Post hoc Tukey’s test: *P < 0.05; ***P < 0.001 vs. Gq-DREADD. (E) p-PKA substrate: DREADD type, F(1, 20) = 12.08, P < 0.01; time point, F(1, 20) = 3.541, P = 0.074; interaction, F(1, 20) = 3.824, P = 0.065. Post hoc Tukey’s test: **P < 0.01 vs. Gq-DREADD.
Figure 9
Figure 9. Electrophysiological response to CNO in DREADD-transduced dSPNs from intact and 6-OHDA–lesioned mice.
Whole-cell patch clamp recordings were made in ex vivo slices from dSPNs transduced with hM3Dq (A, C, and E) or rM3Ds (B, D, and F). (A and B) Bath application of CNO (10 μM) gradually increased the number of APs induced by brief somatic current pulses. No differences were observed between dSPNs of intact and 6-OHDA–lesioned mice transduced with the hM3Dq construct, while the effect of CNO stimulation was greater in the presence of a lesion in rM3Ds-transduced mice. RM 2-way ANOVA (n = 7–8 cells per data set): (A) hM3Dq: effect of lesion, F(1, 13) = 0.001, P = 0.980; time (effect of CNO), F(5, 65) = 12.11, P < 0.001; interaction, F(5, 65) = 0.1870, P = 0.966. (B) rM3Ds: effect of lesion, F(1, 13) = 12.39, P = 0.0038; time (effect of CNO), F(5, 65) = 8.125, P < 0.0001; interaction, F(5, 65) = 1.885, P = 0.109. **P < 0.01 for the effect of the lesion comparing intact vs. 6-OHDA–lesioned mice. (C and D) Frequency of induced APs between baseline and CNO in intact and 6-OHDA–lesioned mice transduced with hM3Dq (C) and rM3Ds (D). Baseline and CNO refer to the average frequency of induced APs (Hz) during the first 5 minutes and the last 5 minutes of CNO bath application, respectively. Paired 2-tailed Student’s t test: *P < 0.05; **P < 0.01; ***P < 0.001 for baseline vs. CNO. (E and F) Representative traces of AP responses to current injection, at baseline and after CNO application, in hM3Dq- and rM3Ds-transduced dSPNs, respectively.

Similar articles

Cited by

References

    1. Gerfen CR, Surmeier DJ. Modulation of striatal projection systems by dopamine. Annu Rev Neurosci. 2011;34:441–466. doi: 10.1146/annurev-neuro-061010-113641. - DOI - PMC - PubMed
    1. Cui G, et al. Concurrent activation of striatal direct and indirect pathways during action initiation. Nature. 2013;494(7436):238–242. doi: 10.1038/nature11846. - DOI - PMC - PubMed
    1. Jin X, Tecuapetla F, Costa RM. Basal ganglia subcircuits distinctively encode the parsing and concatenation of action sequences. Nat Neurosci. 2014;17(3):423–430. doi: 10.1038/nn.3632. - DOI - PMC - PubMed
    1. Surmeier DJ, Graves SM, Shen W. Dopaminergic modulation of striatal networks in health and Parkinson’s disease. Curr Opin Neurobiol. 2014;29:109–117. doi: 10.1016/j.conb.2014.07.008. - DOI - PMC - PubMed
    1. Wiecki TV, Frank MJ. Neurocomputational models of motor and cognitive deficits in Parkinson’s disease. Prog Brain Res. 2010;183:275–297. doi: 10.1016/S0079-6123(10)83014-6. - DOI - PubMed

MeSH terms