. 2017 Mar;23(3):314-326.
doi: 10.1038/nm.4272. Epub 2017 Jan 23.

Maturation of the infant microbiome community structure and function across multiple body sites and in relation to mode of delivery

Affiliations

Maturation of the infant microbiome community structure and function across multiple body sites and in relation to mode of delivery

Derrick M Chu et al. Nat Med. 2017 Mar.

Abstract

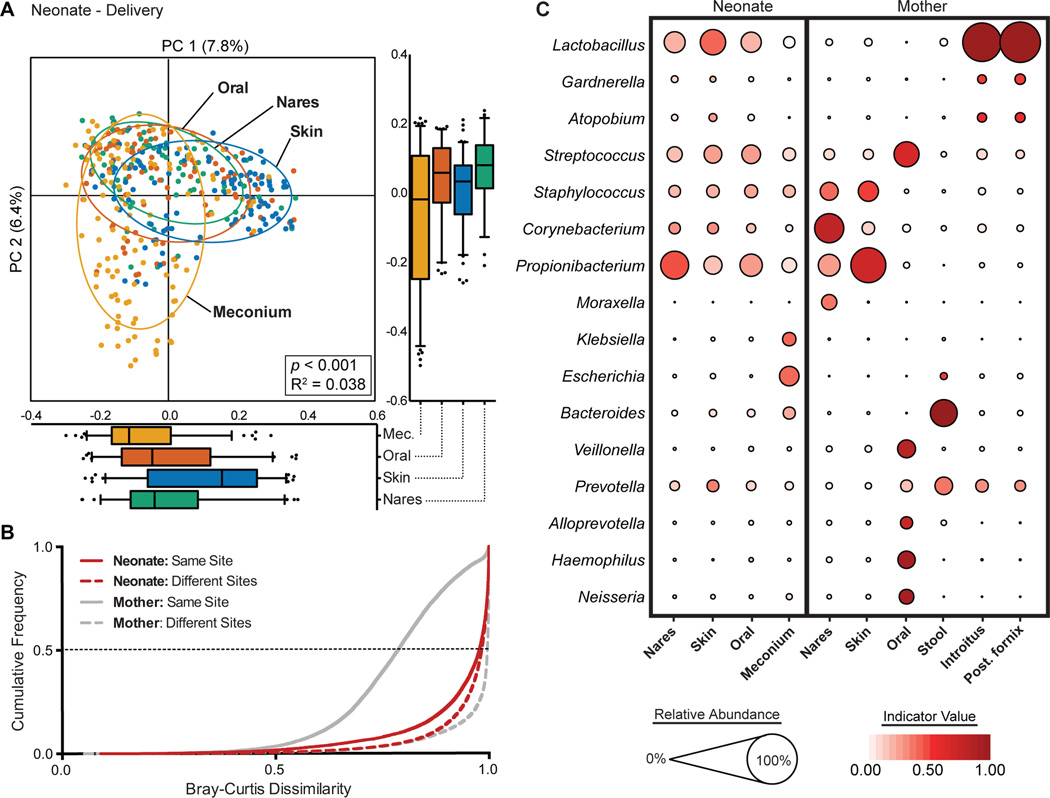
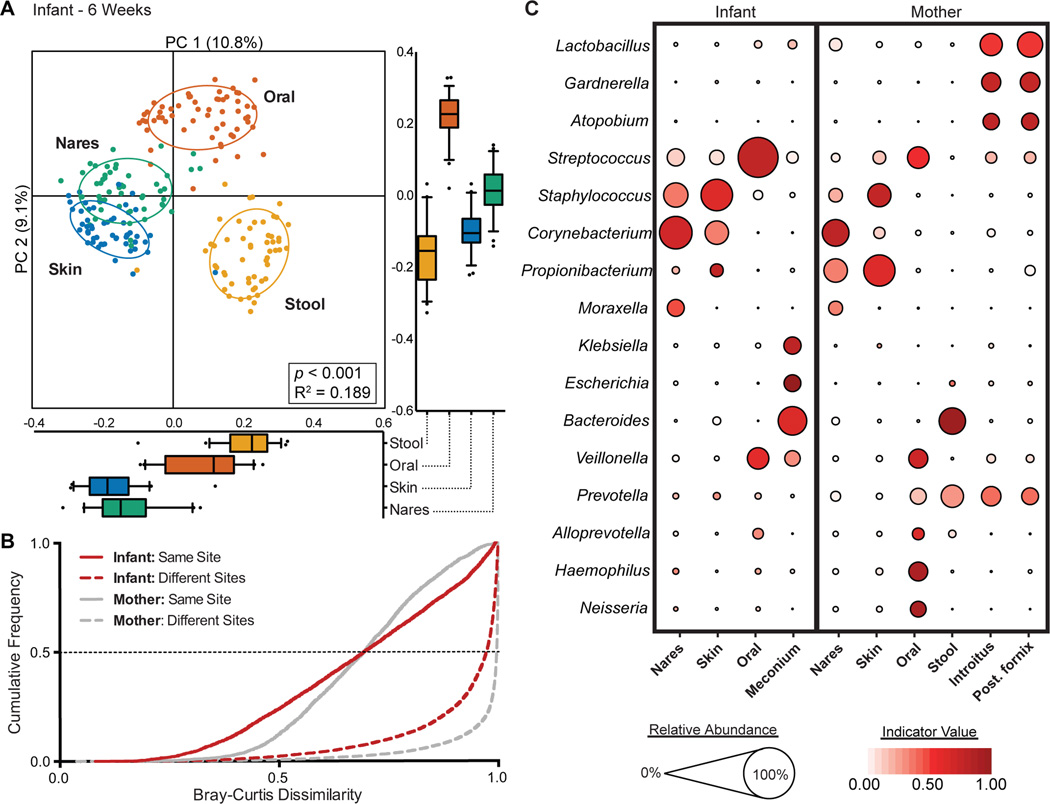
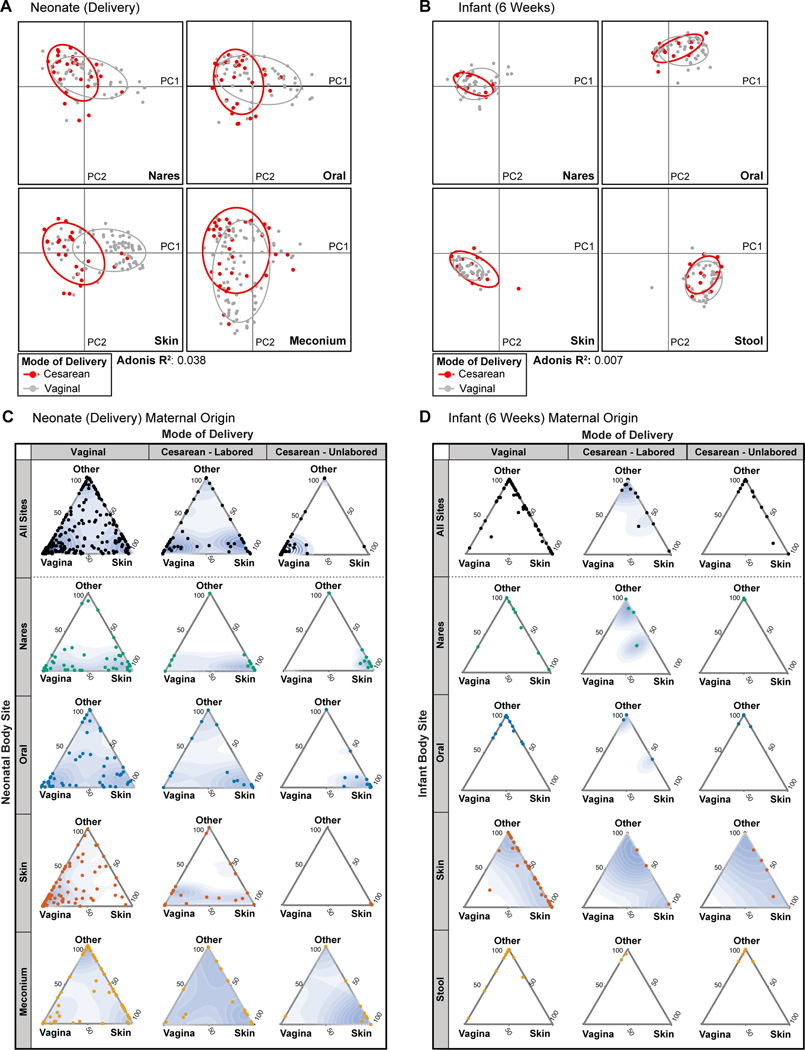
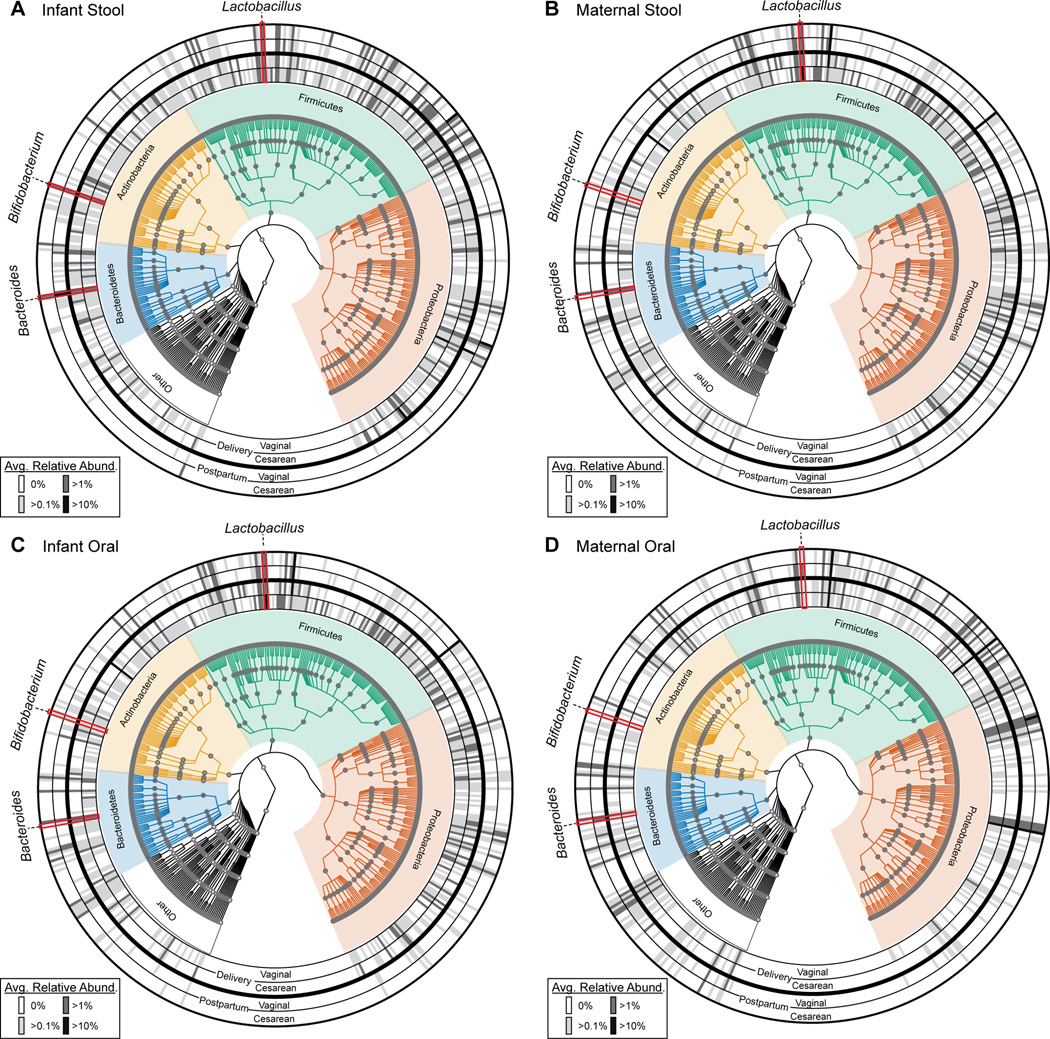
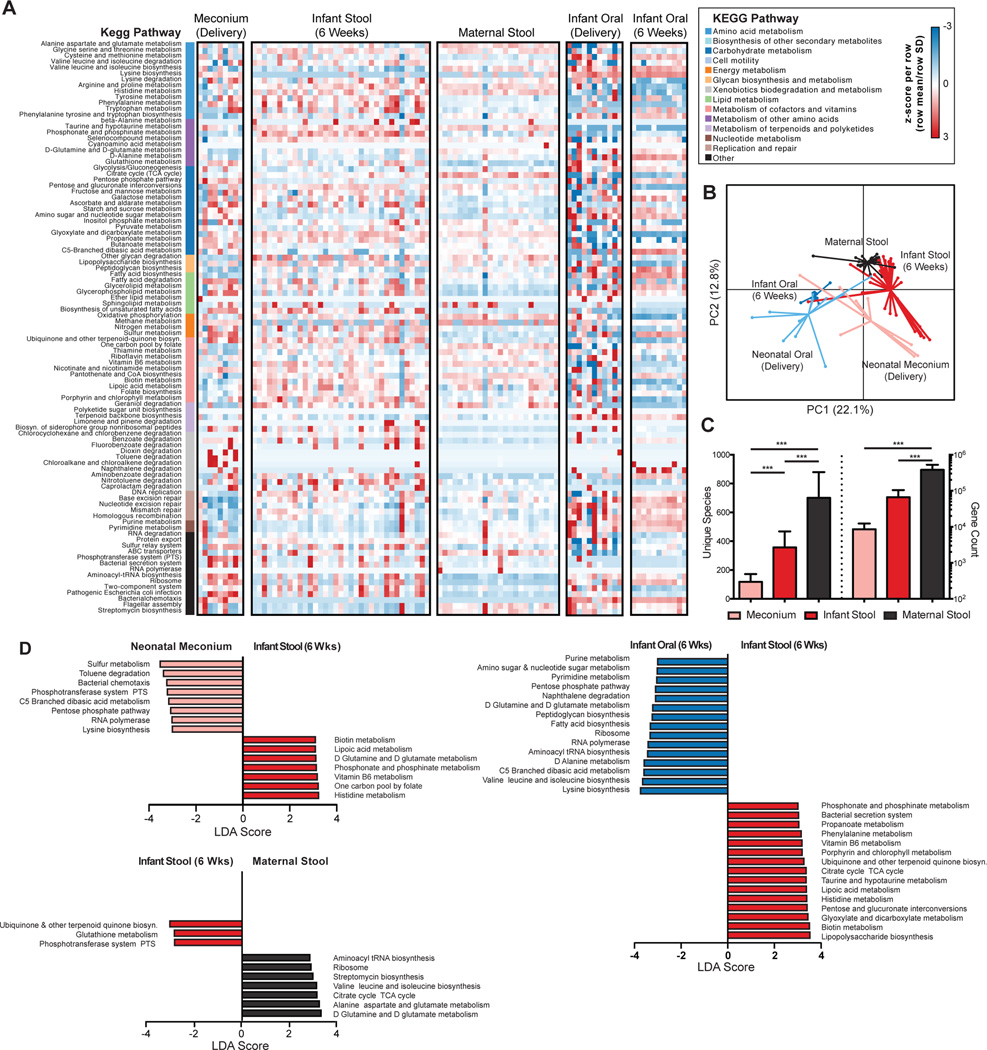
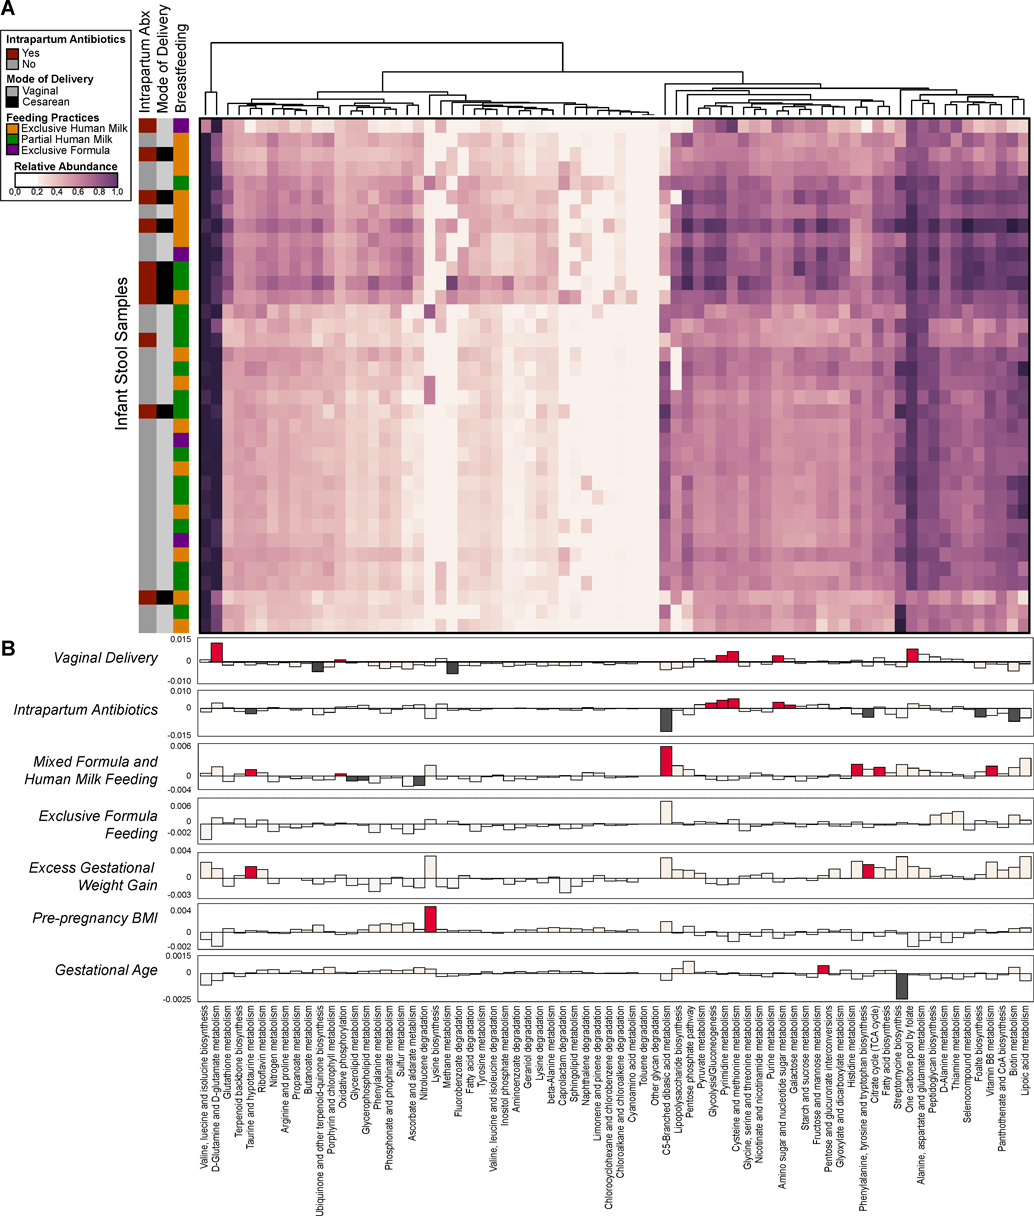
Human microbial communities are characterized by their taxonomic, metagenomic and metabolic diversity, which varies by distinct body sites and influences human physiology. However, when and how microbial communities within each body niche acquire unique taxonomical and functional signatures in early life remains underexplored. We thus sought to determine the taxonomic composition and potential metabolic function of the neonatal and early infant microbiota across multiple body sites and assess the effect of the mode of delivery and its potential confounders or modifiers. A cohort of pregnant women in their early third trimester (n = 81) were prospectively enrolled for longitudinal sampling through 6 weeks after delivery, and a second matched cross-sectional cohort (n = 81) was additionally recruited for sampling once at the time of delivery. Samples across multiple body sites, including stool, oral gingiva, nares, skin and vagina were collected for each maternal-infant dyad. Whole-genome shotgun sequencing and sequencing analysis of the gene encoding the 16S rRNA were performed to interrogate the composition and function of the neonatal and maternal microbiota. We found that the neonatal microbiota and its associated functional pathways were relatively homogeneous across all body sites at delivery, with the notable exception of the neonatal meconium. However, by 6 weeks after delivery, the infant microbiota structure and function had substantially expanded and diversified, with the body site serving as the primary determinant of the composition of the bacterial community and its functional capacity. Although minor variations in the neonatal (immediately at birth) microbiota community structure were associated with the cesarean mode of delivery in some body sites (oral gingiva, nares and skin; R2 = 0.038), this was not true for neonatal stool (meconium; Mann-Whitney P > 0.05), and there was no observable difference in community function regardless of delivery mode. For infants at 6 weeks of age, the microbiota structure and function had expanded and diversified with demonstrable body site specificity (P < 0.001, R2 = 0.189) but without discernable differences in community structure or function between infants delivered vaginally or by cesarean surgery (P = 0.057, R2 = 0.007). We conclude that within the first 6 weeks of life, the infant microbiota undergoes substantial reorganization, which is primarily driven by body site and not by mode of delivery.


Conflict of interest statement

Competing Financial Interest Statement

The authors declare no conflicts of interest.

Figures

Fig. 1
Fig. 1. Neonatal (at birth) microbial community structure
(A) Principal coordinate analysis (PCoA) on unweighted UniFrac distances between the neonatal microbiota is shown along the first two principal coordinate (PC) axes. Boxplots shown along each PC axis represents the distribution of samples along the given axis, representing the median and interquartile range with whiskers determined by Tukey’s method. Each point represents a single sample and is colored by body site: Meconium (Mec.), Orange; Skin, blue; Oral Cavity, red; Nares, green. Ellipses represent a 95% confidence interval around the cluster centroid. Clustering significance by virtue of body site was determined by Adonis (p<0.001). (B) Cumulative distribution of Bray-Curtis dissimilarity distances calculated pairwise between samples of the same body site (solid lines), and between different body sites (dashed lines). Distance comparisons for neonates and maternal samples are shown in red and gray, respectively. Smaller values indicate a greater similarity between samples. (C) The average relative abundance (circle size) of the most prevalent genera (y-axis) in each body site (x-axis) is plotted for neonates and mothers at delivery. The indicator value index (related to circle color shade darkness) represents the strength of association between a taxa and a given body site, with larger values indicating greater specificity.
Fig. 2
Fig. 2. The infant microbiota at 6 weeks demonstrates body site specificity
(A) PCoA on unweighted UniFrac distances between the infant microbiota is shown along the first two PC axes. Boxplots shown along each PC axis represents the distribution of samples along the given axis, representing the median and interquartile range with whiskers determined by Tukey’s method. Each point represents a single sample and is colored by body site: Stool, orange; Skin, blue; Oral cavity, red; Nares, green. Ellipses represent a 95% confidence interval around the cluster centroid. Clustering significance by virtue of body site was determined by Adonis (p<0.001). (B) Cumulative distribution of Bray-Curtis dissimilarity distances calculated pairwise between samples of the same body site (solid lines), and between different body sites (dashed lines). Distance comparisons for infant and maternal samples are shown in red and gray, respectively. Smaller values indicate a greater similarity between samples. (C) The average relative abundance (circle size) of the most prevalent genera (y-axis) in each body site (x-axis) is plotted for infants and mothers at 6 weeks. The indicator value index (related to circle shade darkness) represents the strength of association between a taxa and a given body site, with larger values indicating greater specificity.
Fig. 3
Fig. 3. Failure to demonstrate a significant impact of mode of delivery on the infant microbiota across body sites and time
(A and B) PCoA on unweighted UniFrac distances between the neonatal microbiota at delivery (A) and 6 weeks (B). Data are stratified by body site, with mode of delivery indicated by color (Cesarean, red; vaginal, gray). Ellipses represent the 95% confidence interval around the cluster centroid. Significance of clustering, which was seen among neonatal (A, delivery) nasal, oral, and skin communities, but not meconium (Mann-Whitney test of PC1 values: p>0.05), was determined by an Adonis test by virtue of mode of delivery, stratified by body site (R2=0.038). Conversely, among infants (B,6 weeks), significant clustering was not observed (Adonis p=0.057, R2=0.007). (C and D) Three axes ternary plots indicating the proportion of OTUs within a neonatal sample (each point) predicted to originate from a maternal body site (indicated by the triangle vertices). Each point represents a neonatal sample while its position indicates the predicted relative contribution from either the maternal vagina (posterior fornix or introitus), maternal skin (retroauricular crease or antecubital fossa) or from another maternal site (supragingival plaque, anterior nares, stool, unknown). Points closer to the vertices indicate that a greater proportion of the samples OTUs are predicted to originate from the microbiota of the indicated maternal body site. Data for samples obtained at delivery (C) and at 6 weeks (D) are stratified by body site and by mode of delivery (Vaginal, Cesarean-Labored, or Cesarean-Unlabored). A 2D point density topography map (blue shading) for each plot is given to indicate the point density.
Fig. 4
Fig. 4. Taxonomic profiles of infant and maternal stool and oral microbiomes according to mode of delivery and time
A phylogenetic representation of the taxonomic composition in the infant stool (A), maternal stool (B), infant oral (C), and maternal oral (D) samples at delivery (inner two rings) and 6 weeks postpartum (outer two rings). Each time point is further divided by mode of delivery (indicated by the label at the bottom of the rings. The average relative abundance of each genera are plotted within the concentric rings, represented by the shaded cells, with higher relative abundance indicated by a darker shade. The phyla to which each taxa belongs is indicated by the phylogenetic tree. Three notable taxa are indicated by the red outline, namely Bacteroides, Bifidobacterium and Lactobacillus.
Fig. 5
Fig. 5. Expansion and diversification of the infant microbial community structure and function by 6 weeks of age
(A) Heatmap showing distinct microbial gene (KEGG pathway) profiles of the infant stool and oral metagenome at delivery and 6 weeks of age. The microbial gene profile for maternal stool is shown as a comparison. The relative abundance of a pathway in a given sample is colored by its row z-score ((value – row mean)/row standard deviation). The vertical color bar represents the higher order KEGG module to which each pathway belongs. (B) PCoA of Bray-Curtis distances based on pathway relative abundances demonstrates primarily clustering by body site and time point (PERMANOVA, p<0.001). (C) Enumeration of the unique number of genes and species within the neonatal meconium (delivery), stool (6 weeks) and maternal stool (ANOVA, *** p<0.001 by post-hoc Tukey’s tests). (D) Results from Linear discriminate analysis Effect Size (LEfSe) analysis conducted to identify pathways that differentiated the infant stool metagenome at delivery and at 6 weeks (top left), the infant and maternal stool metagenomes at 6 weeks (top right) and the infant oral and stool metagenomes at 6 weeks (bottom). Only significant pathways with an LDA score >3.0 are shown.
Fig. 6
Fig. 6. Infant microbial community function with clinical metadata in a generalized linear model
(A) Heatmap of the relative abundances of KEGG pathways found in infant stool samples as determined by WGS sequencing. The vertical bar on the left indicates mode of delivery, breastfeeding practices and intrapartum antibiotic usage. Dendrograms represent hierarchical clustering on Euclidean distances using average linkage. (B) A generalized linear mixed model was fitted for each pathway to identify pathways whose abundances differed significantly between individuals by virtue of mode of delivery, antibiotic usage, breastfeeding, gestational weight gain, BMI and gestational age. The strength of the linear model predictions for each pathway is represented by bar height. Significant correlations are indicated by the darker color (dark red or dark gray). Labels correspond to the following comparisons: Vaginal Delivery - pathways enriched in infants born vaginally (red, up) or by Cesarean (gray, down); Intrapartum Antibiotics - pathways enriched in infants exposed to intrapartum antibiotic usage (red, up) as opposed to no antibiotics (gray, down); Mixed Formula and Human Milk Feeding - pathways increased in partially breast fed (human milk and formula) infants (red, up) as opposed to exclusive human milk only (gray, down); Exclusive Formula Feeding - pathways higher in exclusively formula fed infants (red, up), as opposed to human milk only (gray, down); Excess Gestational Weight Gain - pathways higher in cases of excess maternal gestational weight gain (red, up), as opposed to normal weight gain (gray, down); Pre-pregnancy BMI & Gestational age - pathways positively (up, red) or negatively (down, gray) correlated with pre-pregnancy BMI or gestational age.

Comment in

References

Main text References

    1. Human Microbiome Project Consortium. Structure, function and diversity of the healthy human microbiome. Nature. 2012;486:207–214. - PMC - PubMed
    1. Arumugam M, et al. Enterotypes of the human gut microbiome. Nature. 2011;473:174–180. - PMC - PubMed
    1. Aagaard K, et al. A metagenomic approach to characterization of the vaginal microbiome signature in pregnancy. PloS One. 2012;7:e36466. - PMC - PubMed
    1. Costello EK, et al. Bacterial community variation in human body habitats across space and time. Science. 2009;326:1694–1697. - PMC - PubMed
    1. Turnbaugh PJ, et al. An obesity-associated gut microbiome with increased capacity for energy harvest. Nature. 2006;444:1027–131. - PubMed

Methods-only References

    1. La Rosa PS, et al. Hypothesis Testing and Power Calculations for Taxonomic-Based Human Microbiome Data. PLoS One. 2012;7:e52078. - PMC - PubMed
    1. Aagaard K, et al. The Human Microbiome Project strategy for comprehensive sampling of the human microbiome and why it matters. FASEB J. Off. Publ. Fed. Am. Soc. Exp. Biol. 2013;27:1012–1022. - PMC - PubMed
    1. Caporaso JG, et al. QIIME allows analysis of high-throughput community sequencing data. Nat. Methods. 2010;7:335–336. - PMC - PubMed
    1. Schmieder R, Edwards R. Fast identification and removal of sequence contamination from genomic and metagenomic datasets. PloS One. 2011;6:e17288. - PMC - PubMed
    1. Edgar RC. Search and clustering orders of magnitude faster than BLAST. Bioinforma. Oxf. Engl. 2010;26:2460–2461. - PubMed

MeSH terms

Substances