. 2017 Jul;64(7):1492-1502.
doi: 10.1109/TBME.2016.2603119. Epub 2016 Sep 16.

Efficient Descriptor-Based Segmentation of Parotid Glands With Nonlocal Means

Efficient Descriptor-Based Segmentation of Parotid Glands With Nonlocal Means

Christian Wachinger et al. IEEE Trans Biomed Eng. 2017 Jul.

Abstract

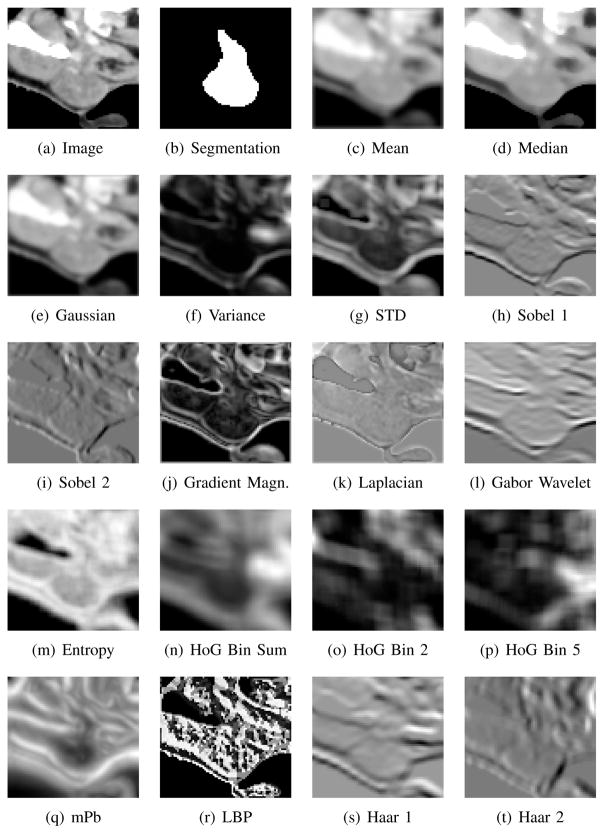
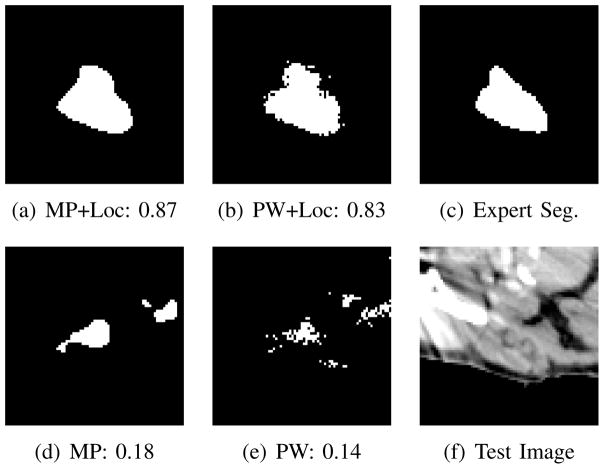
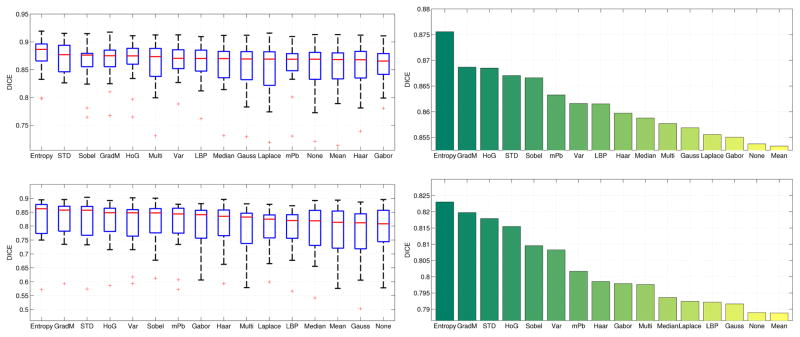
Objective: We introduce descriptor-based segmentation that extends existing patch-based methods by combining intensities, features, and location information. Since it is unclear which image features are best suited for patch selection, we perform a broad empirical study on a multitude of different features.

Methods: We extend nonlocal means segmentation by including image features and location information. We search larger windows with an efficient nearest neighbor search based on kd-trees. We compare a large number of image features.

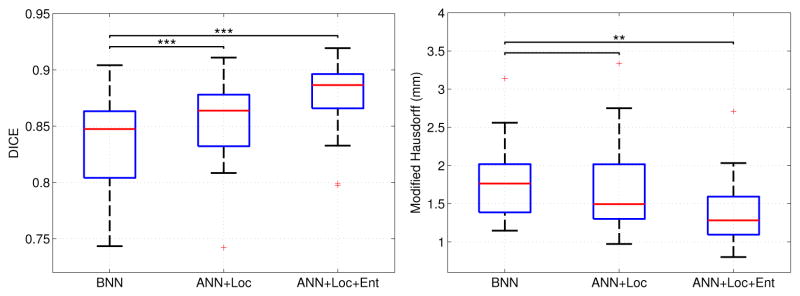
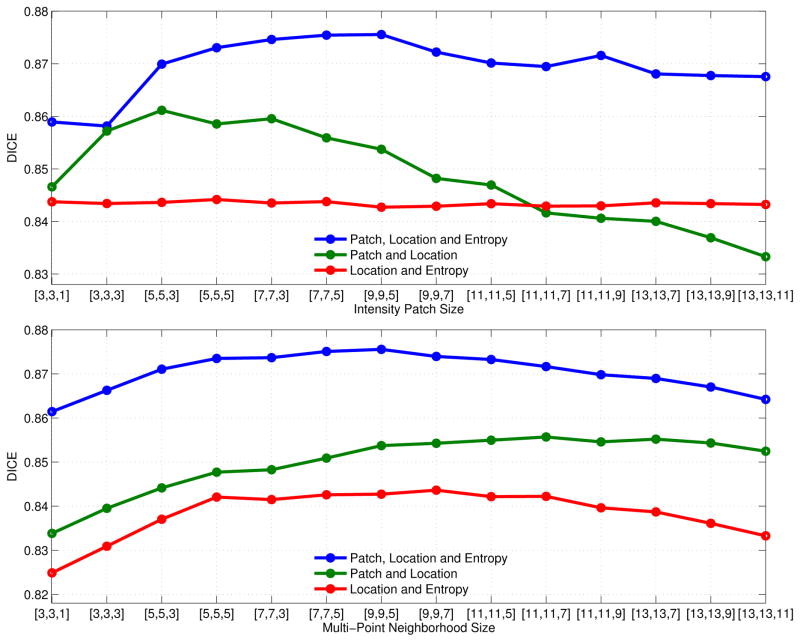
Results: The best results were obtained for entropy image features, which have not yet been used for patch-based segmentation. We further show that searching larger image regions with an approximate nearest neighbor search and location information yields a significant improvement over the bounded nearest neighbor search traditionally employed in patch-based segmentation methods.

Conclusion: Features and location information significantly increase the segmentation accuracy. The best features highlight boundaries in the image.

Significance: Our detailed analysis of several aspects of nonlocal means-based segmentation yields new insights about patch and neighborhood sizes together with the inclusion of location information. The presented approach advances the state-of-the-art in the segmentation of parotid glands for radiation therapy planning.


Figures

Fig. 1
Fig. 1
Overview of the descriptor-based segmentation algorithm: (1) descriptors consisting of patch intensity values, features and location information are extracted from the training and test images; labels are extracted from the training images; (2) a k-nearest neighbor (k-NN) search is performed over the descriptors from the training images for each descriptor from the test image; and (3) the labels of the nearest neighbors are used in label propagation to segment the test image. We compare the performance of a variety of features in (1), of bounded and approximate k-NN searches in (2), and of point-wise and multi-point label propagation methods in (3).
Fig. 2
Fig. 2
Feature images computed from the intensity image shown in (a) with the corresponding manual segmentation (b). Mean, median, Gaussian, variance and standard deviation (STD) images are computed using 5 × 5 × 3 windows. Entropy is computed over 5 × 5 × 5 patches. Two different filter orientations are shown for Sobel and Haar; one orientation is shown for the Gabor wavelet. Two of the eight bins of histogram of oriented gradients (HoG) are shown along with the sum of all eight bins. Feature images for Laplacian filter, gradient magnitude features, multi-scale probability of boundary (mPb), and local binary patterns (LBP) and are also shown.
Fig. 3
Fig. 3
Comparison of Dice volume overlap and modified Hausdorff distances for pointwise (PW), weighted multipoint (W-MP), unweighted multipoint (U-MP) and the inclusion of location information (+Loc) for the left parotid gland. The red line indicates the median, the boxes extend to the 25th and 75th percentiles, and the whiskers reach the most extreme values not considered outliers (red crosses). *, ** and *** indicate statistical significance levels of 0.05, 0.01 and 0.001, respectively.
Fig. 4
Fig. 4
Comparison of segmentation results for left parotid gland in a patient with dental artifacts and corresponding Dice scores. We evaluated (a) multi-point with location (MP+Loc), (b) point-wise with location (PW+Loc), (d) multi-point (MP) and (e) point-wise (PW). The expert segmentation is shown in (c). The CT slice in (f) illustrates the strong impact of the dental artifact.
Fig. 5
Fig. 5
Comparison of Dice volume overlap and modified Hausdorff distances on the left parotid when using bounded nearest neighbor (BNN), approximate nearest neighbor with location information (ANN+Loc) and approximate nearest neighbor with location information and entropy image features (ANN+Loc+Ent). The red line indicates the median, the boxes extend to the 25th and 75th percentiles, and the whiskers reach the most extreme values not considered outliers (red crosses). *, ** and *** indicate significance levels at 0.05, 0.01 and 0.001, respectively.
Fig. 6
Fig. 6
Mean Dice volume overlap for segmentations of the left parotid such that the descriptor contains: (1) patch intensity values, location information and entropy image features; (2) patch intensity values and location information; and (3) location information and entropy image features. The first sub-figure plots the mean Dice scores for each of these three compositions against different sizes of the intensity patch P(x). The second sub-figure plots these Dice scores against different sizes of the multi-point label propagation neighborhood 𝒩x. The size that is not varied is set to 9 × 9 × 5. Note that the intensity patch size has no influence on the entropy features, yielding a constant curve with slight variations only to the randomness of the ANN search.
Fig. 7
Fig. 7
Comparison of Dice scores for the left and right parotid glands by feature. The top two plots show results for the left parotid gland; the bottom two plots show results for the right parotid gland. In the box-and-whisker diagrams, the red line indicates the median, the boxes extend to the 25th and 75th percentiles, and the whiskers reach the most extreme values not considered outliers (red crosses). The bar plots show the mean Dice scores obtained by each feature. Features in the plots are ordered by median Dice and mean Dice, respectively. Note that different scales on the y-axis are used in these plots.
Fig. 8
Fig. 8
Comparison of mean Dice overlap scores for segmentations of the left parotid such that the descriptor contains: (1) multi-scale patch intensity values and location information; and (2) patch intensity values and location information. The differences are not statistically significant. The multi-point neighborhood size is set equal to the total extent of the multi-scale patch, which is three times the intensity patch size along each dimension, in (1). The multi-point neighborhood size is set equal to the patch size in (2).

References

    1. Heckemann R, et al. Automatic anatomical brain MRI segmentation combining label propagation and decision fusion. Neuro Image. 2006;33(1):115–126. - PubMed
    1. Rohlfing T, et al. Quo vadis, atlas-based segmentation? Handbook of Biomedical Image Analysis. 2005:435–486.
    1. Wachinger C, Golland P. Spectral label fusion. In: Ayache N, et al., editors. MICCAI 2012. Vol. 7512. Springer; Heidelberg: 2012. pp. 410–417. ser. LNCS. - PMC - PubMed
    1. Wang H, et al. Multi-atlas segmentation with joint label fusion. Pattern Analysis and Machine Intelligence, IEEE Transactions on. 2013;35(3):611–623. - PMC - PubMed
    1. Wachinger C, Golland P. Atlas-based under-segmentation. MICCAI. 2014:315–322. - PMC - PubMed

MeSH terms