. 2017 Mar;14(3):309-315.
doi: 10.1038/nmeth.4150. Epub 2017 Jan 23.

Single-cell mRNA quantification and differential analysis with Census

Affiliations

Single-cell mRNA quantification and differential analysis with Census

Xiaojie Qiu et al. Nat Methods. 2017 Mar.

Abstract

Single-cell gene expression studies promise to reveal rare cell types and cryptic states, but the high variability of single-cell RNA-seq measurements frustrates efforts to assay transcriptional differences between cells. We introduce the Census algorithm to convert relative RNA-seq expression levels into relative transcript counts without the need for experimental spike-in controls. Analyzing changes in relative transcript counts led to dramatic improvements in accuracy compared to normalized read counts and enabled new statistical tests for identifying developmentally regulated genes. Census counts can be analyzed with widely used regression techniques to reveal changes in cell-fate-dependent gene expression, splicing patterns and allelic imbalances. We reanalyzed single-cell data from several developmental and disease studies, and demonstrate that Census enabled robust analysis at multiple layers of gene regulation. Census is freely available through our updated single-cell analysis toolkit, Monocle 2.


Conflict of interest statement

Competing Financial Interest Statement

The authors declare no relevant financial interests.

Figures

Figure 1
Figure 1. Census approximates relative transcript counts in single cells without external RNA standards
(a) The typical procedure for estimating lysate mRNA abundances via spike-in standards in single-cell RNA-Seq. Losses at various stages alter the distribution of relative gene expression levels within a single cell. (b) Distribution of the transcript counts corresponding to each cell’s most frequently observed relative abundance (i.e. TPM) in cDNA or lysate RNA space in the lung epithelial data from Treutlein et al. Modes are obtained by log-transforming the data, performing a Gaussian kernel density estimation, and then exponentiating back to the original scale. (c) Total transcripts per lung epithelial cell estimated via spike-in controls versus counts from the spike-free algorithm in Census. Blue line indicates linear regression. Black line indicates perfect concordance. (d) MA plot for expressed genes based on contrasts between cells from E14.5 and cells from all other time points. The top panels show Census transcript counts while the bottom panels show transcript counts derived by spike-in regression. (e) Fold changes for expressed genes based on data from Census transcripts or transcripts with spike-in regression of contrasts between cells from E14.5 and cells from all other time points.
Figure 2
Figure 2. Use of Census counts improves accuracy of differential expression analysis and can be performed on libraries with or without spike controls
(a) Receiver-operating characteristic (ROC) curves showing differential expression (DE) analysis accuracy from various tools provided with relative expression levels, normalized read counts, and transcript counts estimated with spike-ins or Census. Cells from E14.5 and E18.5 from Treutlein et al. were provided to each tool. A permutation-based test was applied to the spike-in-based expression levels to determine a ground truth set of DE genes. In addition to Census and spike controls, we include transcript counts derived by scaling the TPM values by the correct per-cell total RNAs. This control shares Census’ inability to control for amplification bias, but begins with the same total per-cell transcript counts available through spike-ins. Comparing this control to spike-based regression reveals the impact of amplification bias on differential analysis in single cells. Comparing it to Census assesses how error in estimating total transcript counts translates into error in differential analysis. (b) Consensus in differential analysis results between Monocle, DESeq2, edgeR, and permutation tests using different measures of expression. The total height of each bar reflects the size of the union of DE genes reported by any of the four tests. The smaller bar reports the number of DE genes identified by all tests.
Figure 3
Figure 3. BEAM identifies genes with branch-dependent expression and potential drivers during lung epithelial fate specification
(a) Monocle 2 recovers a branched single-cell trajectory beginning with bronchoalveolar progenitors (BP) and terminating at type I (AT1) and type II (AT2) pneumocytes. High expression of known markers of proliferation (Ccnb2, Cdk2) is restricted to progenitor cells, whereas high expression of known AT1 (Pdpn) and AT2 (Sftpb) markers is restricted to their corresponding lineages. Size of circles denotes level of expression. (b) Branching Expression Analysis Modeling (BEAM) is a statistical framework for identifying genes with expression that changes over a single-cell trajectory in a branch-dependent manner. BEAM first uses generalized linear models with natural splines to perform a regression on the data in which the branch assignments of the cells are known (alternative model), fitting a separate curve for each branch. It also performs another regression in which the branch assignments are not known (null model), fitting a single curve for all the data, and then compares these models via a likelihood ratio test. (c) Null and alternative model fits for the AT1/2 markers (Ager / Sftpb) and housekeeping genes (Hprt and Pgk1). Solid lines indicate the smoothed expression curves for each branch in the alternative model while dashed line corresponding to the fitted curve in the null model used in the BEAM test.
Figure 4
Figure 4. Loss of interferon signaling generates a branch in the trajectory followed by immune-stimulated dendritic cells
(a) Experimental design used by Shalek et al. to compare BMDCs from Ifnar1-/- and Stat1-/- knockout mice against the wild type as they respond to LPS. (b) Single-cell trajectory recovered by Monocle 2. (c) Kinetic clusters of branch-dependent genes identified by BEAM are functionally enriched for interferon signaling and other immune-related processes. (d) Branch time point for the significant branching antiviral regulators and their significant branching targets collected from Fig. 4 of. ) (e) Branch time points for the TFs with motifs enriched in nearby DHS site from significant branch genes from cluster 5 and their potential target genes in cluster 5 (panel c). For all boxplots in this study, the upper and lower “hinges” correspond to the first and third quartiles (the 25th and 75th percentiles). The whiskers extend from the upper (or lower) hinge to the highest (or lowest) value that is within 1.5 * IQR of the hinge, where IQR is the inter-quartile range, or distance between the first and third quartiles. Data beyond the end of the whiskers are outliers and plotted as points. The center line corresponds to the median.
Figure 5
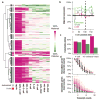
Figure 5. Census enables robust analysis of differential splicing during cell differentiation
(a) Splicing structure of TPM1, with the three alternatively spliced sets of exons highlighted. (b) Percent-spliced-in (PSI) values for TPM1 alternative exons. PSI values were computed by summing Census counts for isoforms including each exon and dividing by the total TPM1 transcript count in each cell. Black lines indicate loess smoothing of the PSI values as a function of pseudotime.
Figure 6
Figure 6. Census detects shifts in allelic balance in single cells during embryogenesis
(a) A quasibinomial regression model detects changes in allelic balance in single cells as a function of embryo stage. (b) Spread of X chromosome inactivation as measured by Census for female embryos at the 4-cell, 16-cell, and early blastocyst stage. Compare with Fig 2B from Deng et a l. (c) Number of genes with at least 10% contribution from the maternal and paternal copies of X chromosome. (d) Observed monoallelic expression in single cells from late stage embryos as measured by Census transcript counts (top) or normalized read counts (bottom). Red line indicates median fraction of monoallelic calls as a function of average transcript count across cells. Only autosomal genes are shown. Black bars indicate 95% prediction interval generated by a quasibinomial regression model fit to each gene, with the median of the gene intervals indicated by the blue line. Light red points indicate individual genes that fall outside the prediction interval.

References

    1. Macosko EZ, Basu A, Satija R, Nemesh J, Shekhar K. Highly Parallel Genome-wide Expression Profiling of Individual Cells Using Nanoliter Droplets. 2015 doi: 10.1016/j.cell.2015.05.002. - DOI - PMC - PubMed
    1. Klein AM, et al. Droplet barcoding for single-cell transcriptomics applied to embryonic stem cells. Cell. 2015;161:1187–1201. - PMC - PubMed
    1. Shalek AK, et al. Single-cell transcriptomics reveals bimodality in expression and splicing in immune cells. Nature. 2013 doi: 10.1038/nature12172. - DOI - PMC - PubMed
    1. Grün D, Kester L, van Oudenaarden A. Validation of noise models for single-cell transcriptomics. Nature methods. 2014;11:637–640. - PubMed
    1. Finak G, et al. MAST: a flexible statistical framework for assessing transcriptional changes and characterizing heterogeneity in single-cell RNA sequencing data. Genome biology. 2015;16:278. - PMC - PubMed

Method-only Reference

    1. Katz Y, Wang ET, Airoldi EM, Burge CB. Analysis and design of RNA sequencing experiments for identifying isoform regulation. Nature methods. 2010;7:1009–1015. - PMC - PubMed
    1. Keane TM, et al. Mouse genomic variation and its effect on phenotypes and gene regulation. Nature. 2011;477:289–294. - PMC - PubMed
    1. Corbel C, Diabangouaya P, Gendrel AV, Chow JC, Heard E. Unusual chromatin status and organization of the inactive X chromosome in murine trophoblast giant cells. Development (Cambridge, England) 2013;140:861–872. - PubMed
    1. Yang F, Babak T, Shendure J, Disteche CM. Global survey of escape from X inactivation by RNA-sequencing in mouse. Genome Research. 2010;20:614–622. - PMC - PubMed

Publication types

MeSH terms