. 2017 Mar;20(3):459-469.
doi: 10.1038/nn.4481. Epub 2017 Jan 23.

An intra-amygdala circuit specifically regulates social fear learning

Affiliations

An intra-amygdala circuit specifically regulates social fear learning

Robert C Twining et al. Nat Neurosci. 2017 Mar.

Abstract

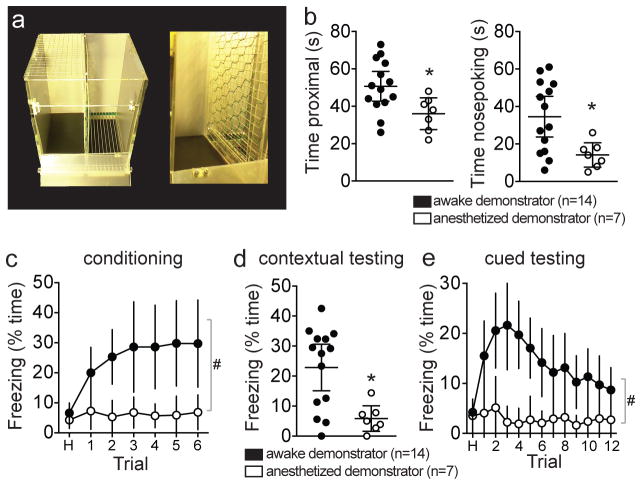
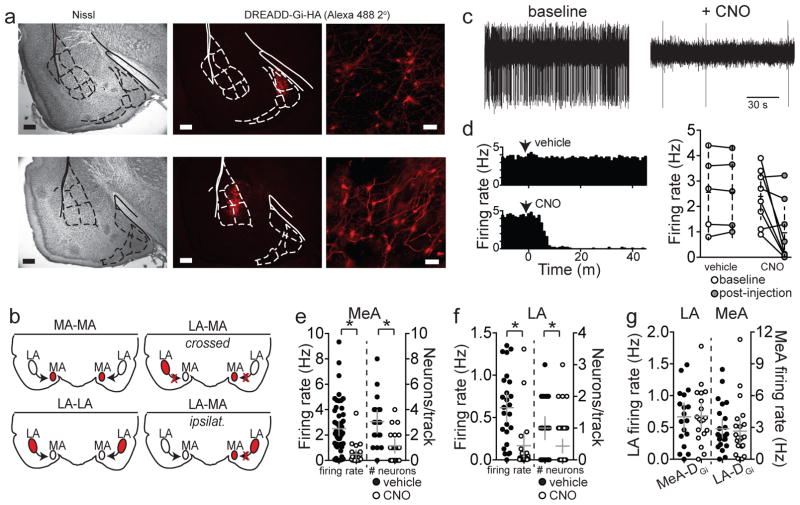
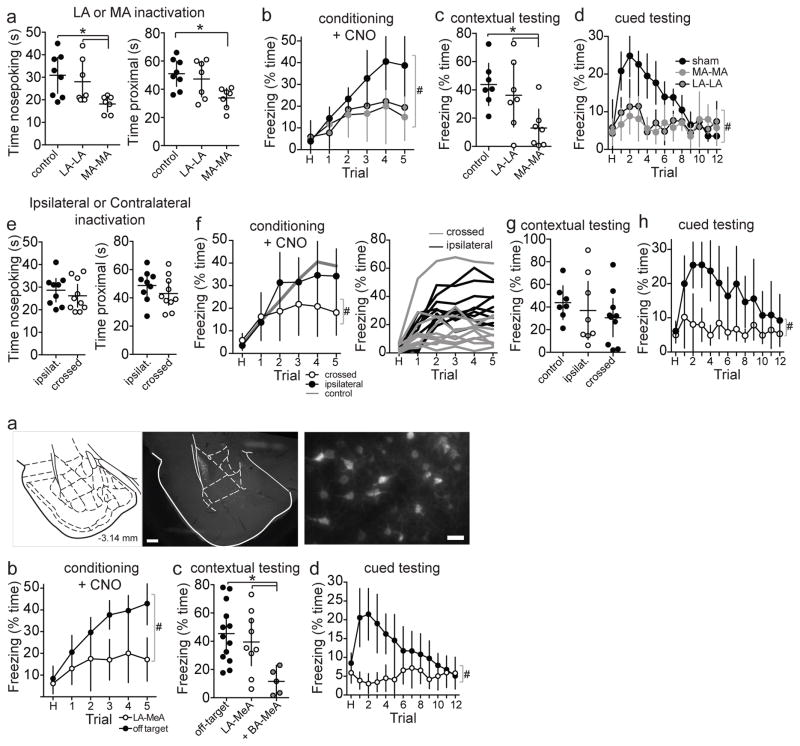
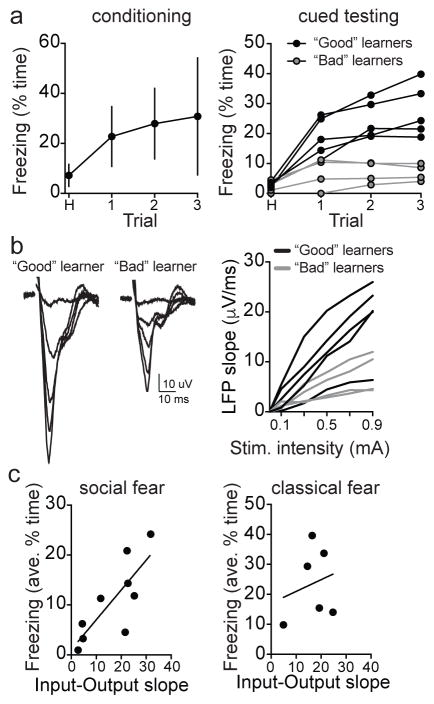
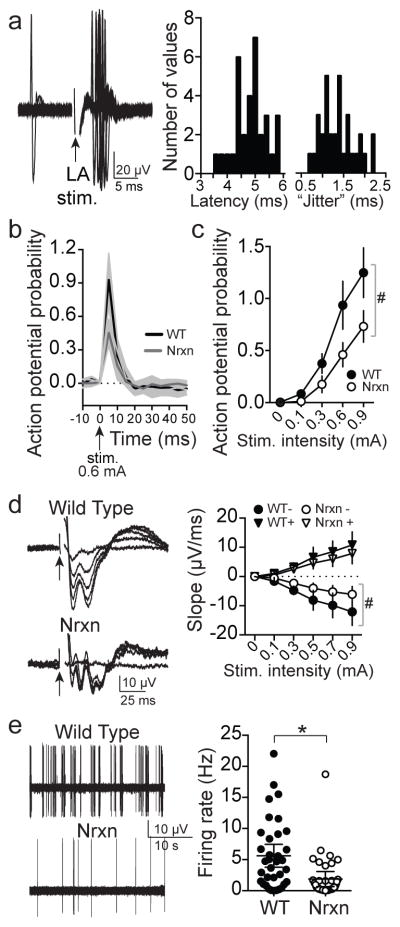
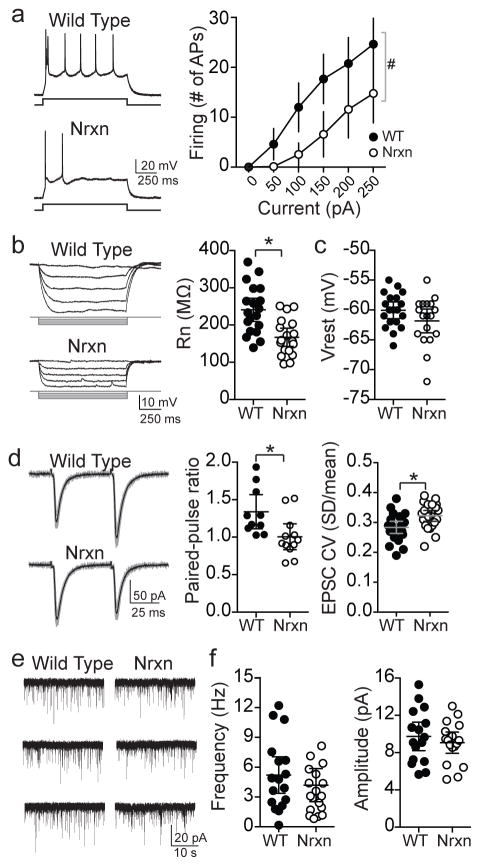
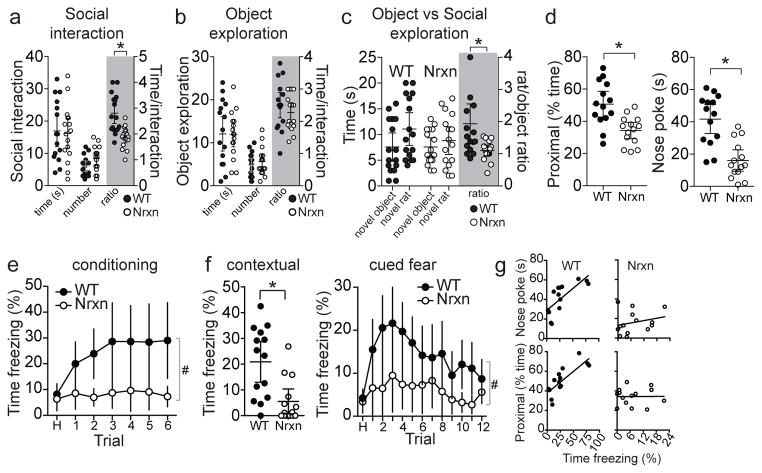
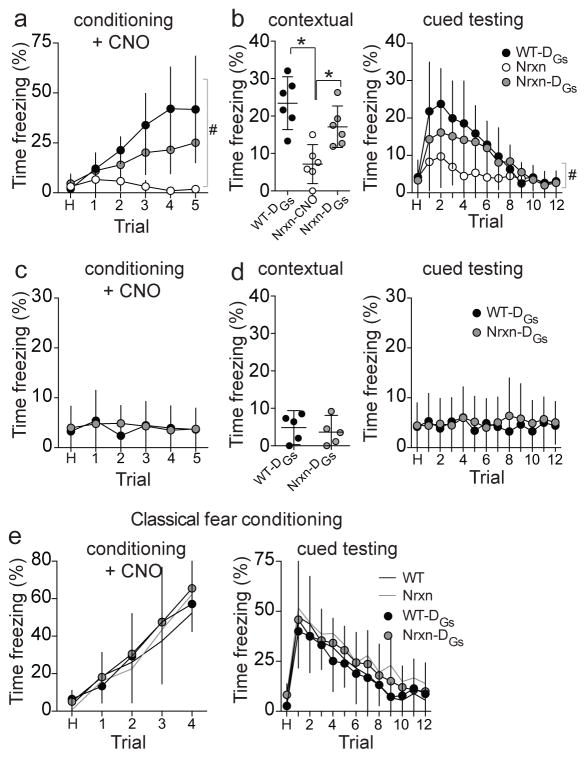
Adaptive social behavior requires transmission and reception of salient social information. Impairment of this reciprocity is a cardinal symptom of autism. The amygdala is a critical mediator of social behavior and is implicated in social symptoms of autism. Here we found that a specific amygdala circuit, from the lateral nucleus to the medial nucleus (LA-MeA), is required for using social cues to learn about environmental cues that signal imminent threats. Disruption of the LA-MeA circuit impaired valuation of these environmental cues and subsequent ability to use a cue to guide behavior. Rats with impaired social guidance of behavior due to knockout of Nrxn1, an analog of autism-associated gene NRXN, exhibited marked LA-MeA deficits. Chemogenetic activation of this circuit reversed these impaired social behaviors. These findings identify an amygdala circuit required to guide emotional responses to socially significant cues and identify an exploratory target for disorders associated with social impairments.


Conflict of interest statement

Competing Financial Interests Statement

The authors report no competing financial interests.

Figures

Figure 1
Figure 1. Fear learning through social transmission
a) The social fear conditioning apparatus (left) was divided down the middle to allow foot shock delivery paired with a tone to the animal on the right side (demonstrator), while the animal on the left received no foot shock (observer). The animals were separated by a mesh divider (right). b) Observer rats (n=14 rats) displayed exploratory behavior directed towards the demonstrator, measured as amount of time spent proximal to the divider that separated the rats (left) and amount of time spent with its nose in close proximity or poking into the divider (right). If the rat on the other side of the divider was anesthetized, the observer rat (n=7 rats) displayed significantly less time engaged in this social exploratory behavior (time proximal, p=0.0206, t=2.524, df=19, eta2=0.25, 95% C.I.=−26.8 to −2.5, two-tailed unpaired t-test; time nose poking, p=0.0128, t=2.749, df=19, eta2=0.29, 95% C.I.=−35.9 to −4.9, two-tailed unpaired t-test). c) Observer rats (n=14 rats) displayed increased freezing over the course of social fear learning (6 trials; p=0.0108, F(6,91)=5.423, eta2=0.29, one-way RM-ANOVA) if the demonstrator rat was awake, despite no physical contact with shock. However, if the demonstrator rat was anesthetized during the social fear conditioning, the observer rats (n=7 rats) displayed no significant freezing (p=0.5875, F(6,42)=0.6337, eta2=0.10, one-way RM-ANOVA), resulting in a significant difference in freezing between groups (i.e. difference in the effect of social fear conditioning; trial x anesthesia interaction, p=0.0446, F(6,114)=2.237, eta2=0.031, two-way RM-ANOVA; main effect of anesthesia p=0.0108, F(1,19)=7.988, eta2=0.19, two-way RM-ANOVA). d) When replaced in the same chamber after 48 hours, rats that were paired with an awake demonstrator (n=14 rats) displayed contextual freezing, while rats that were paired with an anesthetized demonstrator (n=7 rats) displayed significantly less contextual freezing (p=0.0045, t=3.219, df=19, eta2=0.35, 95% C.I.=5.9 to 28.0, two-tailed unpaired t-test). e) Similarly, when placed in a novel chamber, and presented with the conditioned tone (CS+; 12 trials), rats that were paired with an awake demonstrator displayed conditioned freezing to the CS+ (n=14 rats) while rats that were paired with an anesthetized demonstrator (n=7 rats) displayed significantly less freezing (main effect of treatment p=0.0038, F(1,19)=15.15, eta2=0.21; treatment x trial interaction p=0.0013, F(12,228)=2.810, eta2=0.043, two-way RM-ANOVA). Data shown here are mean ± 95% confidence intervals. #p<0.05, main effect of group in two-way RM-ANOVA; *p<0.05 two-tailed unpaired t-test.
Figure 2
Figure 2. Electrophysiological verification of DREADD-Gi effect on MeA and LA neuron firing in vivo
The tissue from all rats was sectioned and stained for HA tag. a) Example photomicrographs (2X and 20X magnification) of immunostain for the HA tag of DREADD-Gi expression in MeA (top) and LA (bottom) and corresponding Nissl stained sections (left) to facilitate accurate identification of region. Overlay adapted from Paxinos and Watson. b) Schematic representing the inactivation approaches including bilateral inactivation of MeA or LA, crossed inactivation of MeA and LA, or ipsilateral inactivation of MeA and LA. c) Neuronal firing rate and the number of spontaneously firing neurons per electrode track were quantified. This was followed by CNO or vehicle injection and the recording was repeated. All neuronal recording sites were verified histologically. Example of a MeA neuron firing under baseline conditions and another MeA neuron after CNO in the same rat. d) In some experiments a neuron was recorded during injection of vehicle or CNO, providing pre- and post-injection measures of the same neurons for with-in neuron comparisons. When recording site was verified to lie within DREADD expression area, 5/8 neurons displayed a >75% decrease in firing rate after CNO injection, but 0/5 displayed a decrease after vehicle. e) In the remaining recordings, firing of different neurons was sampled before and after CNO or vehicle injection, providing a between-neuron comparison. CNO injection in rats with DREADD-Gi in the MeA significantly decreased the overall firing rate (vehicle 2.50 ± 0.27 Hz, n=53 neurons from 4 rats, CNO 0.47 ± 0.17 Hz, n=23 neurons from 4 rats, p=0.001, t=3.41, df=74, eta2=0.23, 95% C.I.=−2.9 to −1.2, two-tailed unpaired t-test) and number of spontaneously firing posterior MeA neurons compared to vehicle (vehicle 3.05 ± 0.44 neurons/track, n=19 tracks, CNO 1.15 ± 0.26 neurons/track, n=20 tracks, p=0.0006, t=3.736, df=37, eta2=0.27, 95% C.I.=−2.93 to −0.87, two-tailed unpaired t-test). f) CNO injection in rats with DREADD-Gi in the LA decreased the overall firing rate (vehicle 0.62 ± 0.08 Hz, n=25 neurons from 3 rats, CNO 0.17 ± 0.08, n=20 neurons from 3 rats, p=0.0004, t=3.878, df=43, eta2=0.26, 95% C.I.=−0.69 to −0.22, two-tailed unpaired t-test) and number of spontaneously firing neurons in LA compared to vehicle (vehicle 1.00 ± 0.17 neurons/track, n=25 tracks, CNO 0.44 ± 0.11 neurons/track, n=46 tracks, p=0.0045, t=2.940, df=69, eta2=0.11, 95% C.I.=−0.95 to −0.18, two-tailed unpaired t-test). g) In contrast, CNO did not significantly impact the firing rate of MeA neurons recorded from rats with DREADD-Gi in LA (vehicle 2.88 ± 0.42 Hz, n=25 neurons from 4 rats, CNO 2.66 ± 0.57Hz, n=22 neurons from 4 rats, p=0.745, t=0.328, df=45, eta2=0.002, 95% C.I.=−1.2 to 1.6, two-tailed unpaired t-test), nor did it impact the firing rate of LA neurons from rats with DREADD-Gi in MeA (vehicle 0.67 ± 0.10 Hz, n=18 neurons from 4 rats, CNO 0.68 ± 0.10 Hz, n=19 neurons from 4 rats, p=0.934, t=0.084, df=35, eta2=0.0002, 95% C.I.=−0.30 to −0.28, two-tailed unpaired t-test). Data shown here are mean ± 95% confidence intervals. Scale bars at 2X=500 μm, 20X=100 μm.
Figure 3
Figure 3. Disruption of intra-amygdala path impairs social fear learning
Bilateral inactivation of MeA (MA-MA) or LA (LA-LA), or unilateral inactivation of LA and MeA in contralateral hemispheres (LA-MA/crossed) or in the same hemisphere (LA-MA/ipsilat) was induced by CNO administration (1 mg/kg) 40 minutes prior to social fear conditioning. a) Control rats (n=8 rats) displayed social approach during social fear conditioning, measureable as time spent close to and nose exploring through the mesh divider. Bilateral inactivation of MeA (n=7 rats), but not LA (n=7 rats), decreased nose poking (p=0.02, F(2,19)=4.74, eta2=0.33, one-way ANOVA; *p<0.05 Holm-Sidak’s multiple comparisons test). Similarly, bilateral inactivation of MeA (n=7 rats), but not LA (n=7 rats), decreased time proximal to the divider (p=0.0178, F(2,19)=5.015, eta2=0.35, one-way ANOVA; *p<0.05 Holm-Sidak’s multiple comparisons test). b) Inactivation of MeA or LA decreased freezing during social fear conditioning (main effect of inactivation p=0.047, F(2,19)=3.61, eta2=0.11; trial x inactivation interaction p=0.0034, F(10,95)=2.89, eta2=0.07, two-way RM-ANOVA; #p<0.05, main effect of group in two-way RM-ANOVA). c) Contextual freezing was measured after 48 hours in the same context as conditioning, without CNO. Bilateral inactivation of MeA (n=7 rats), but not LA (n=7 rats) during conditioning, decreased contextual freezing (p=0.018, F(2,19)=5.11, eta2=0.36, one-way ANOVA; *p<0.05 Holm-Sidak’s multiple comparisons test). d) Freezing to the CS+ tone was tested after 48 hours in a novel context, without CNO. Bilateral inactivation of MeA or LA during conditioning decreased freezing in response to the CS+ tone during testing (main effect of inactivation p<0.0001, F(2,19)=19.74, eta2=0.18; trial x inactivation interaction p<0.0001, F(24,228)=6.01, eta2=0.20, two-way RM-ANOVA; #p<0.05, main effect of group in two-way RM-ANOVA). e) Crossed functional disconnection of LA and MeA (n=10 rats) did not decrease social approach during social fear conditioning (p=0.447, t=0.778, df=17, eta2=0.035, 95% C.I.=−4.2 to 9.2, two-tailed unpaired t-test) compared to ipsilateral inactivation of LA and MeA (n=9 rats). f) However, crossed functional disconnection of LA and MeA did decrease freezing to the CS+ during social fear conditioning (trial x inactivation interaction p=0.0027, F(5,85)=3.974, eta2=0.047, two-way RM-ANOVA) shown in grouped data (left) and individual rats (right). g) Crossed functional disconnection of LA and MeA did not impair contextual fear (p=0.625, t=0.499, eta2=0.015, 95% C.I.=−20.7 to 33.5, df=17, two-tailed unpaired t-test). h) But crossed functional disconnection of LA and MeA did impair freezing in response to the CS+ tone when measured in a novel context after 48 hours (main effect of inactivation p=0.0023, F(1,17)=12.88, eta2=0.22; trial x inactivation interaction p=0.0003, F(12,204)=3.21, eta2=0.061, two-way RM-ANOVA). i) DREADD-Gi was transduced in LA neurons that project to MeA by infusion of CAV2-Cre into MeA with a Cre-dependent DREADD-Gi vector in the LA. j) CNO was injected 40 minutes prior to social fear conditioning. Rats that had DREADD-Gi expression in LA-MeA neurons (n=9 rats) displayed reduced freezing during social fear learning compared to rats whose vector infusion was off-target (n=13 rats; main effect of inactivation site p=0.0001, F(1,20)=23.18, eta2=0.15; trial x inactivation interaction p=0.0138, F(5,100)=3.026, eta2=0.054, two-way RM-ANOVA). k) Contextual conditioned social fear was compared between rats with DREADD-Gi expression in the LA, LA+BA, and off-target expression. Contextual conditioned social fear was not impaired in rats with DREADD-Gi expression limited to LA-MeA neurons (n=9 rats) compared to rats whose vector infusion was off-target (n=13 rats; p=0.0116, F(2,24)=5.397, eta2=0.31, one-way ANOVA; p>0.05 Holm-Sidak’s multiple comparisons test), but was impaired when DREADD transduction extended to include LA and BA neurons (n=5 rats; p<0.05 Holm-Sidak’s multiple comparisons test compared to off-target infusions and on-target infusions). l) Conditioned freezing to cue was significantly impaired in rats with DREADD-Gi expression in LA-MeA neurons (n=9 rats) compared to rats whose vector infusion was off-target (n=13 rats) measured in a novel context after 48 hours (main effect of inactivation site p<0.0001, F(1,20)=25.39, eta2=0.16; trial x inactivation interaction p<0.0001, F(12,240)=4.168, eta2=0.11, two-way RM-ANOVA). *p<0.05 Holm-Sidak’s multiple comparisons test, #p<0.05, main effect of group in two-way RM-ANOVA. Scale bars at 2X=500 μm, 20X=50 μm. Data shown here are mean ± 95% confidence intervals.
Figure 4
Figure 4. LA-MeA strength associated with social fear learning
a) A modified, weaker version of social fear conditioning (3 trial conditioning, left; n=9 rats) produces substantial variability between rats in conditioned freezing, with some rats displaying robust conditioned freezing (“Good” learners, n=5 rats) and others displaying minimal conditioned freezing (“Bad” learners, n=4 rats). b) Stimulation of LA caused a local field potential response in the posterior MeA, measured as the slope of the initial deflection. The slope was measured across a range of stimulation intensities to produce an input-output curve. “Good” learners tended to display a greater local field potential than “Bad” learners. c) The slope of the LA-MeA input-output curve was quantified as a measure of the strength of the LA-MeA local field potential. There was a significant correlation between the LA-MeA strength and social fear learning in individual rats (quantified as average percent time freezing during test; Pearson r = 0.78, R square = 0.64, p=0.01). In control experiments there was no correlation between LA-MeA strength and classical fear conditioning in individual rats (n=6 rats, Pearson r = 0.22, R square = 0.049, p=0.67). Data shown here are mean ± 95% confidence intervals except where noted.
Figure 5
Figure 5. Disruption of intra-amygdala path in neurexin knock-out rats
a) Stimulation of LA caused increased firing in posterior MeA neurons in vivo (n=16 neurons from 5 rats, defined as >3 times baseline firing rate in a 5 ms time window within 10 ms of LA stimulation). Responses were included in analysis only if they met criteria for monosynaptic connections (average latency 4.9 ms, range 3.7 – 5.8 ms, latency jitter average 1.37 ms, range 0.66 – 2.21 ms. Shown here are frequency histograms of the distribution of latency and latency jitter). b) The average response was significantly weaker in Nrxn rats at the same stimulation intensity (WT n=16 neurons from 5 rats, Nrxn n=11 neurons from 5 rats, 0.6 mA, mean ± 95% confidence interval; genotype x time interaction p<0.0001, F(78,1950)=2.744, eta2=0.053, two-way RM-ANOVA). c) The response of these same MeA neurons was significantly weaker in Nrxn rats over a range of LA stimulation intensities (main effect of genotype p<0.0001, F(1,125)=35.94, eta2=0.070; genotype x stimulation interaction p=0.0002, F(4,125)=6.05, eta2=0.047, two-way RM-ANOVA). d) The field potential in posterior MeA evoked by LA stimulation was significantly reduced in Nrxn rats (n=16 rats) compared to WT (n=11 rats; slope of the 1st negative peak; main effect of genotype on negative peak p=0.011, F(1,25)=7.50, eta2=0.087; genotype by stimulation intensity interaction p=0.0043, F(4,100)=4.06, eta2=0.041, two-way RM-ANOVA). e) The firing rate of posterior MeA neurons in vivo was significantly decreased in Nrxn compared to WT rats (WT 5.6 ± 0.9 Hz, n=36 neurons from 8 rats, Nrxn 1.9 ± 0.6 neurons, n=59 neurons from 9 rats, p=0.0005, t=3.583, df=93, eta2=0.12, 95% C.I.=−5.82 to −1.67, two-tailed unpaired t-test). Data shown here are mean ± 95% confidence intervals except where noted.
Figure 6
Figure 6. Intrinsic and synaptic properties of MeA neurons
Properties of MeA (posterior) neurons were measured in vitro using whole cell recordings. a) Posterior MeA neurons (Type I neurons based on firing pattern, ) recorded in vitro from Nrxn rats had significantly lower membrane excitability compared to WT (WT n=11 neurons from 11 slices, Nrxn n=12 neurons from 12 slices, main effect of genotype, p=0.0004, F(1,21) = 17.6, eta2=0.21; genotype x current interaction p<0.001, F(4,84)=18.8, eta2=0.15, two-way RM ANOVA). b) MeA neurons from Nrxn rats displayed significantly lower input resistance than WT (p=0.0004, t=3.875, df=35, eta2=0.30, 95% C.I.=−112.2 to −35.1, two-tailed unpaired t-test, WT n=19 neurons from 14 slices, Nrxn n=18 neurons from 13 slices). c) The resting membrane potential of these same MeA neurons was not significantly different between WT and Nrxn rats (p=0.129, t=1.556, df=35, eta2=0.065, 95% C.I.=−4.10 to 0.54, two-tailed unpaired t-test, WT n=19 neurons, Nrxn n=18 neurons). d) Paired-pulse facilitation and coefficient of variance (CV) of EPSCs evoked by local stimulation was measured to assess synaptic function. The paired-pulse ratio of EPSCs in MeA neurons was significantly less in Nrxn rats (WT=10 neurons from 10 slices, Nrxn=12 neurons from 12 slices, p=0.015, t=2.66, df=20, eta2=0.26, 95% C.I.=−0.60 to −0.07, two-tailed unpaired t-test). CV of EPSCs in MeA neurons was significantly higher in Nrxn rats (WT=22 neurons, Nrxn=23 neurons, p=0.0049, t=2.965, df=43, eta2=0.17, 95% C.I.=0.012 to 0.065, two-tailed unpaired t-test). e) Miniature EPSCs (mEPSCs) were recorded from MeA neurons (WT n=17 neurons from 14 slices, Nrxn n=19 neurons from 14 slices). f) The mEPSC frequency (left; p=0.397, t=0.859, df=34, two-tailed unpaired t-test) and amplitude (right; p=0.457, t=0.753, eta2=0.021, 95% C.I.=−3.39 to 1.38, two-tailed unpaired t-test) were not significantly different between WT and Nrxn rats. *p<0.05 two-tailed unpaired t-test, #p<0.05, main effect of group in two-way RM-ANOVA. Data shown here are mean ± 95% confidence intervals.
Figure 7
Figure 7. Social learning is impaired in neurexin rats
a) Social interaction with a novel rat in the open field was measured from WT and Nrxn rats (n=16 rats/group). There was no significant difference in the total time of interaction (p=0.814, t=0.238, df=30, eta2=0.002, 95% C.I.=−7.19 to 5.69, two-tailed unpaired t-test) or the number of interaction events (p=0.066, t=1.908, df=30, eta2=0.11, 95% C.I.=−0.17 to 4.92, two-tailed unpaired t-test). However, the duration of individual interaction events was significantly lower in Nrxn rats (p=0.0001, t=4.382, df=30, eta2=0.39, 95% C.I.=−1.36 to −0.50, two-tailed unpaired t-test). b) Novel object exploration was measured in the open field (n=16 rats/group). There was no significant difference between WT and Nrxn rats in the total time of object exploration (p=0.936, t=0.082, df=30, eta2=0.0002, 95% C.I.=−4.88 to 4.51, two-tailed unpaired t-test), the number of exploration events (p=0.428, t=0.803, df=30, eta2=0.021, 95% C.I.=−1.35 to 3.10, two-tailed unpaired t-test), nor the duration of each object exploration event (p=0.330, t=0.990, df=30, eta2=0.032, 95% C.I.=−0.35 to 0.12, two-tailed unpaired t-test). c) WT and Nrxn rats both display a preference for a novel rat when novel rat and novel object are presented together (n=16/group; object vs novel rat stimulus main effect, p<0.0001, F(1,30)=32.82, eta2=0.056, two-way RM-ANOVA). However, WT rats display a significantly greater preference for a novel rat than Nrxn rats display (stimulus x genotype interaction, p=0.011, F(1,30)=7.364, eta2=0.013; novel rat/object preference ratio, p=0.009, t=2.774, df=30, eta2=0.20, 95% C.I.=−1.44 to −0.22, two-tailed unpaired t-test). d) Social fear conditioning was measured in WT and Nrxn rats (n=14 rats/group). Nrxn rats displayed significantly less time proximal to the divider (left; time proximal to divider p=0.0001, t=3.78, df=26, eta2=0.35, 95% C.I.=−25.4 to −7.4, two-tailed unpaired t-test) and less time nose exploring through the divider (right; p<0.0001, t=5.00, df=26, eta2=0.49, 95% C.I.=−36.3 to −15.1, two-tailed unpaired t-test). e) These same Nrxn rats displayed significantly less freezing during social fear conditioning (main effect of genotype, p=0.0043, F(1,26)=9.790, eta2=0.18; genotype x trial interaction, p=0.0081, F(6,156)=3.015, eta2=0.030, two-way RM-ANOVA, n=14 rats/group). f) When tested after 48 hours, these Nrxn rats displayed significantly less contextual freezing in the conditioning context (left; p=0.0014, t=3.579, df=26, eta2=0.33, 95% C.I.=−24.2 to −6.5, two-tailed unpaired t-test) and cued freezing in a novel context (right; main effect of genotype, p=0.0088, F(1,26)=8.022, eta2=0.126, two-way RM-ANOVA, n=14 rats/group). g) Freezing behavior on the testing day was correlated with social approach behaviors on conditioning day in WT rats, but not in Nrxn rats (shown here are individual values, n=14 rats/group). WT rats that spent more time close to the mesh divider during social fear conditioning, and spent more time nose exploring through the divider displayed greater conditioned social fear (proximal to divider r2=0.65, p<0.01; nose poking r2=0.54, p<0.01). The correlation between these pro-social behavioral measures and fear learning were absent in Nrxn rats (proximal to divider r2=0.01, p>0.05; nose poking r2=0.10, p>0.05). Data shown here are mean ± 95% confidence intervals except where noted noted. *p<0.05 two-tailed unpaired t-test, #p<0.05, main effect of group in two-way RM-ANOVA.
Figure 8
Figure 8. DREADD-Gs activation of MeA partially rescues social learning deficits in neurexin rats
DREADD-Gs expression was transduced to activate posterior MeA. Control rats had reported only transduced. CNO (1 mg/kg i.p.) was administered 40 minutes prior to social fear conditioning. a) Activation of MeA partially restored freezing during social fear conditioning in Nrxn rats (n=6 rats) to WT levels (n=5 rats), and better than control Nrxn rats without MeA activation (n=6 rats; main effect of treatment, p<0.0001, F(2,14)=19.90, eta2=0.344; treatment x trial interaction, p<0.0001, F(10,70)=8.11, eta2=0.190 two-way RM-ANOVA). b) When tested after 48 hours, control Nrxn rats displayed impaired freezing to the context compared to WT rats (p=0.0007, F(2,15)=12.44. eta2=0.624, one-way ANOVA between WT-DREADD-Gs, control Nrxn and Nrxn-DREADD-Gs, p<0.05 Holm-Sidak’s multiple comparisons test) while Nrxn rats that had MeA activation (DREADD-Gs) during social fear conditioning displayed significantly enhanced contextual freezing to the conditioned context compared to control Nrxn rats (p<0.05 Holm-Sidak’s multiple comparisons test). These same Nrxn DREADD-Gs rats also displayed significantly enhanced conditioned freezing to the CS+ in a novel context, compared to control Nrxn rats (main effect of treatment, p<0.0097, F(2,14)=6.58, eta2=0.117; treatment x trial interaction, p<0.0001, F(24,168)=3.098, eta2=0.116, two-way RM-ANOVA). c) To verify that DREADD-Gs activation of the MeA did not induce spurious freezing unrelated to social learning, social fear conditioning experiments were repeated with MeA activation (CNO, 1 mg/kg, i.p.) using a demonstrator that was anesthetized (as above). Neither WT-DREADD-Gs rats (n=5 rats) nor Nrxn-DREADD-Gs rats (n=5 rats) displayed freezing during conditioning if the demonstrator was anesthetized (main effect of trial, p=0.861, F(5,40)=0.379, eta2=0.027; main effect of genotype, p=0.816, F(1,8)=0.0577, eta2=0.0027; genotype x trial interaction, p=0.881, F(5,40)=0.347, eta2=0.025, two-way RM-ANOVA). d) There was also no conditioned freezing displayed by these rats in response to the context (p=0.620, t=0.516, df=8, eta2=0.032, 95% C.I.=−6.46 to 4.10, two-tailed unpaired t-test) or tone (in a novel context; main effect of trial, p=0.996, F(12,96)=0.235, eta2=0.019; main effect of genotype, p=0.661, F(1,8)=0.207, eta2=0.0078; genotype x trial interaction, p=0.991, F(12,96)=0.285, eta2=0.023) measured after 48 hours. e) Activation of MeA during classical fear conditioning (WT n=7, Nrxn n=6, WT-DREADD-Gs n=6, Nrxn-DREADD-Gs n=6) did not significantly impact freezing during conditioning (main effect of group, p=0.315, F(3,21)=0.641, eta2=0.0082; group x trial interaction, p=0.929, F(12,84)=0.465, eta2=0.014, two-way RM-ANOVA), nor conditioned freezing during testing after 48 hours (main effect of group, p=0.315, F(3,21)=1.255, eta2=0.033; group x trial interaction, p=0.999, F(36, 252)=0.369, eta2=0.013, two-way RM-ANOVA). Data shown here are mean ± 95% confidence intervals. p<0.05 post-hoc Holm-Sidak comparison after ANOVA, #p<0.05, main effect of group in two-way RM-ANOVA.

Comment in

  • Rodent see, rodent fear.
    Kfir Y, Paz R. Kfir Y, et al. Nat Neurosci. 2017 Feb 23;20(3):381-382. doi: 10.1038/nn.4512. Nat Neurosci. 2017. PMID: 28230840 No abstract available.

References

    1. Adolphs R, Tranel D, Damasio H, Damasio A. Impaired recognition of emotion in facial expressions following bilateral damage to the human amygdala. Nature. 1994;372:669–672. - PubMed
    1. Brothers L, Ring B, Kling A. Response of neurons in the macaque amygdala to complex social stimuli. Behav Brain Res. 1990;41:199–213. - PubMed
    1. Dicks D, Myers RE, Kling A. Uncus and amiygdala lesions: effects on social behavior in the free-ranging rhesus monkey. Science. 1969;165:69–71. - PubMed
    1. Ferguson JN, Aldag JM, Insel TR, Young LJ. Oxytocin in the medial amygdala is essential for social recognition in the mouse. J Neurosci. 2001;21:8278–8285. - PMC - PubMed
    1. Morris JS, et al. A differential neural response in the human amygdala to fearful and happy facial expressions. Nature. 1996;383:812–815. - PubMed

LinkOut - more resources