Comparative Study
. 2017 Jan 23;12(1):e0170628.
doi: 10.1371/journal.pone.0170628. eCollection 2017.

A Comparative Study of Serum Exosome Isolation Using Differential Ultracentrifugation and Three Commercial Reagents

Affiliations
Comparative Study

A Comparative Study of Serum Exosome Isolation Using Differential Ultracentrifugation and Three Commercial Reagents

Inas Helwa et al. PLoS One. .

Abstract

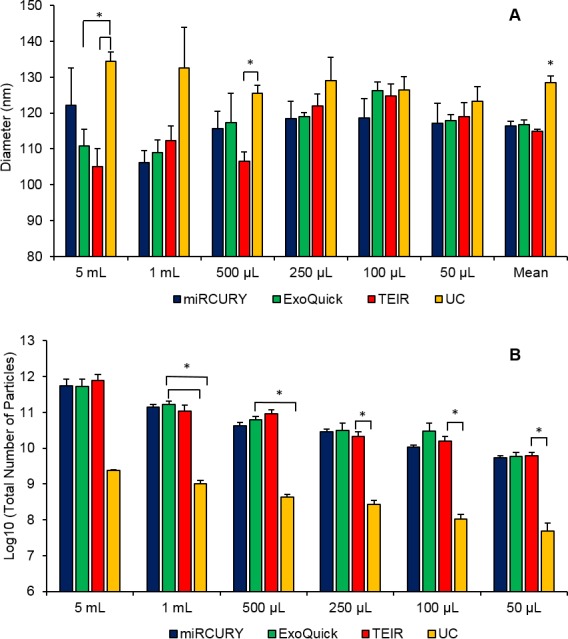
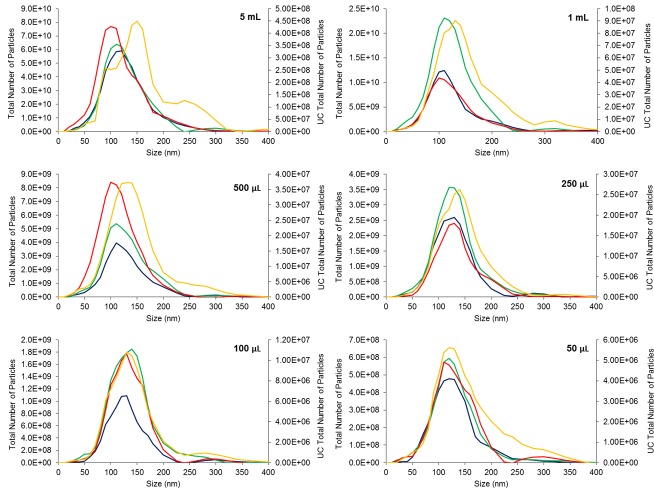
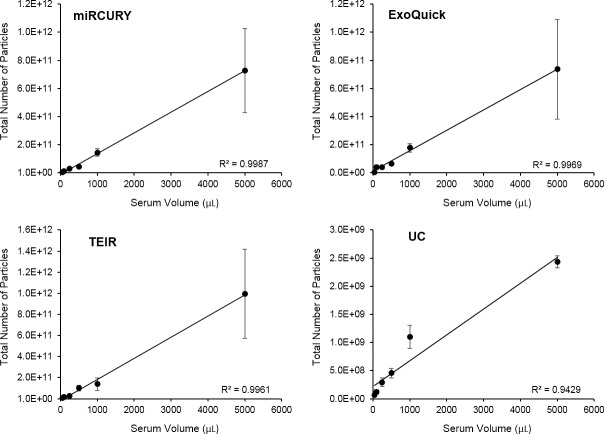
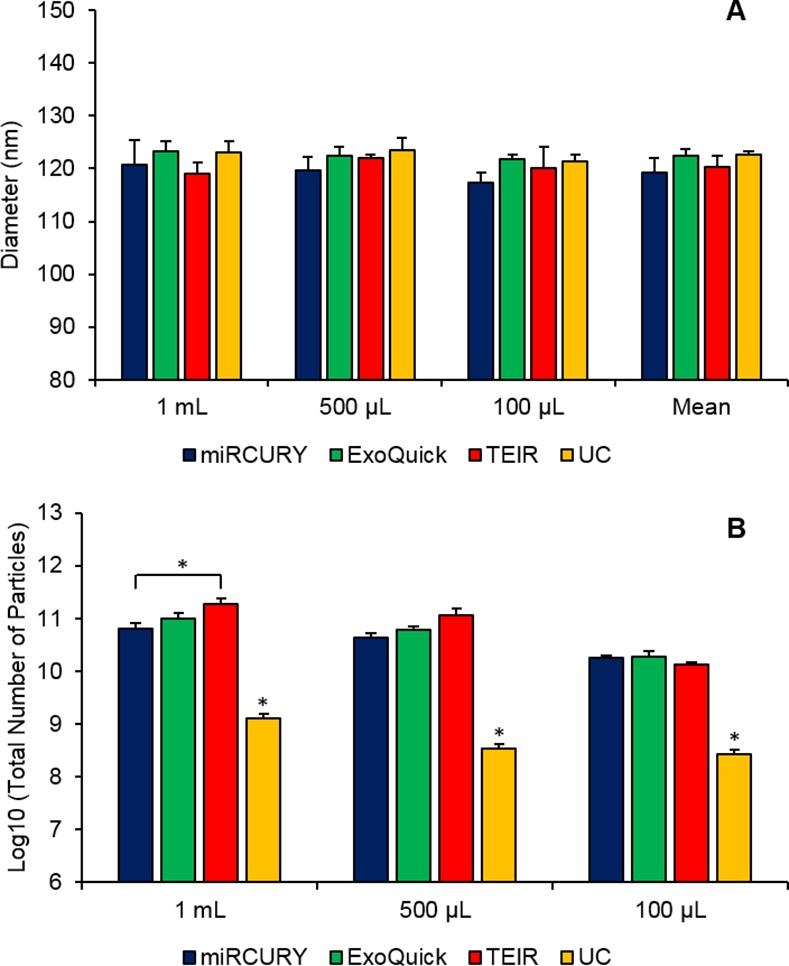
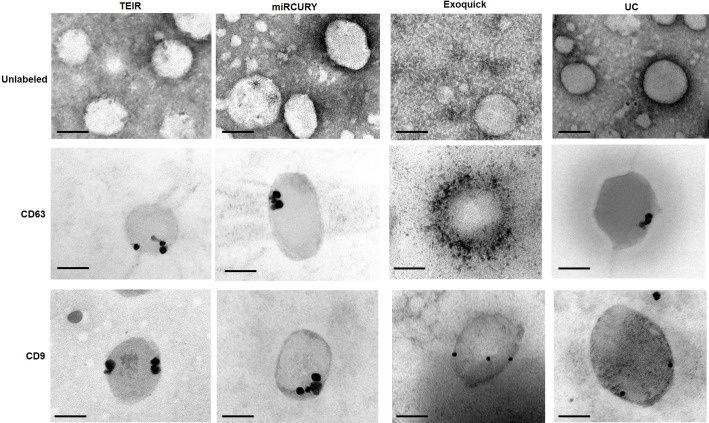
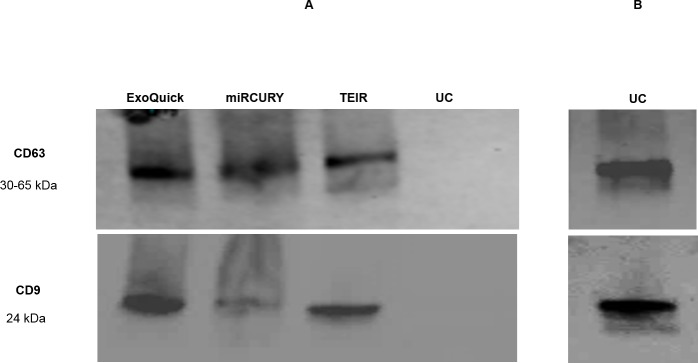
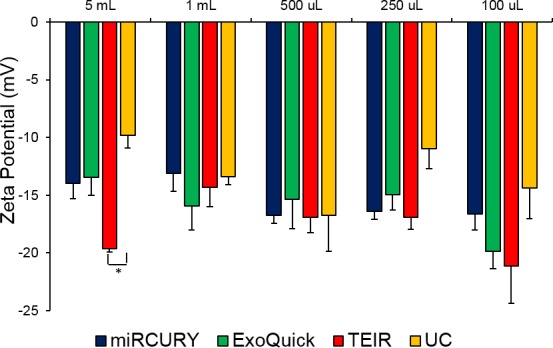
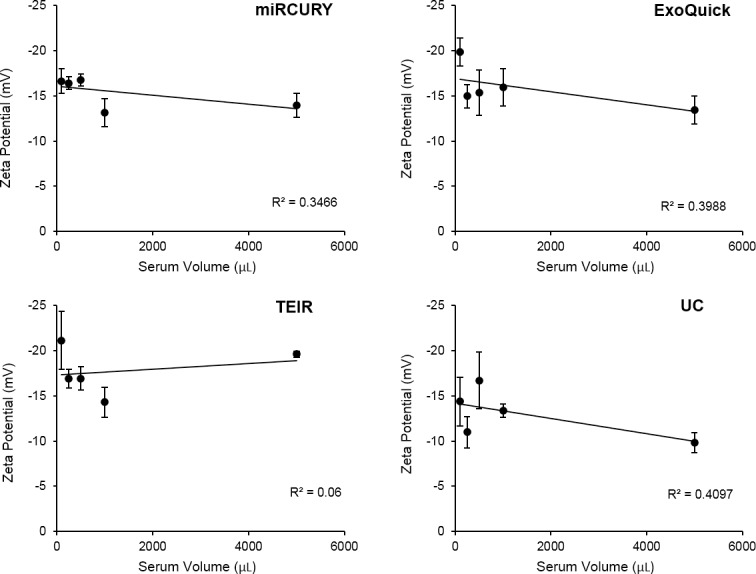
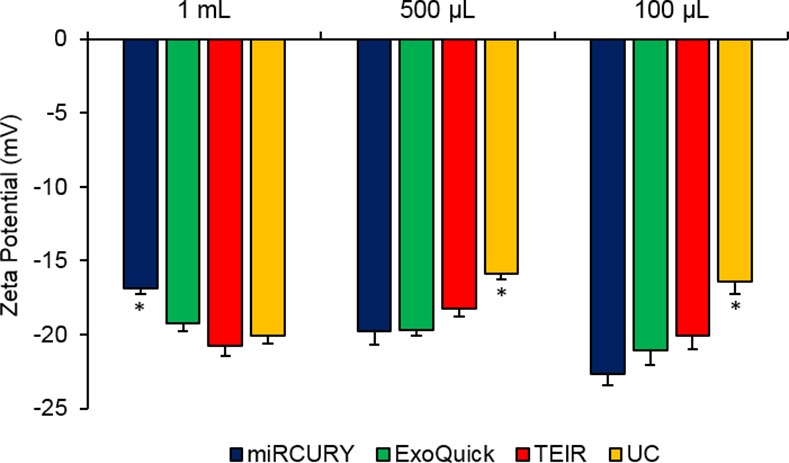
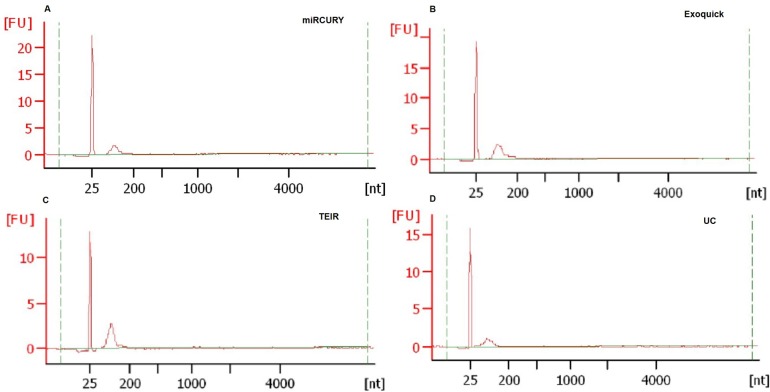
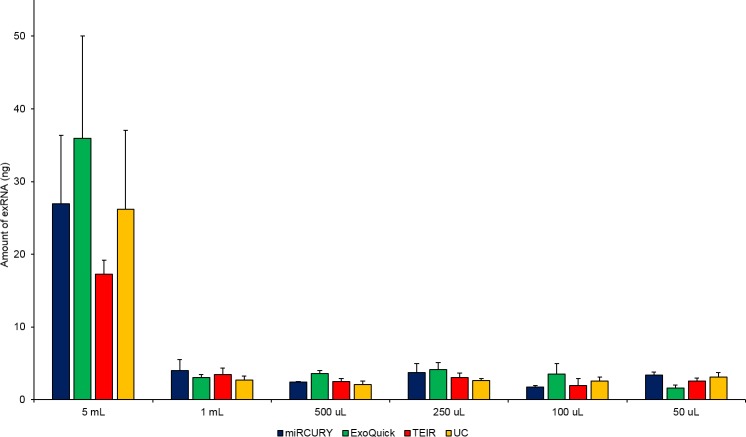
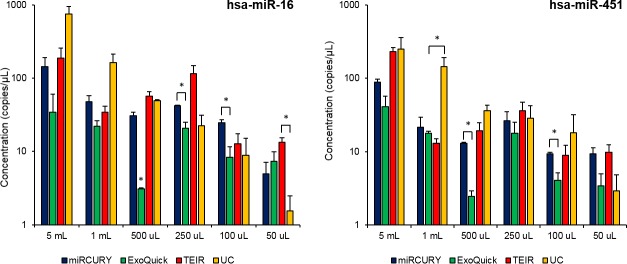
Exosomes play a role in cell-to-cell signaling and serve as possible biomarkers. Isolating exosomes with reliable quality and substantial concentration is a major challenge. Our purpose is to compare the exosomes extracted by three different exosome isolation kits (miRCURY, ExoQuick, and Invitrogen Total Exosome Isolation Reagent) and differential ultracentrifugation (UC) using six different volumes of a non-cancerous human serum (5 ml, 1 ml, 500 μl, 250 μl, 100 μl, and 50 μl) and three different volumes (1 ml, 500 μl and 100 μl) of six individual commercial serum samples collected from human donors. The smaller starting volumes (100 μl and 50 μl) are used to mimic conditions of limited availability of heterogeneous biological samples. The isolated exosomes were characterized based upon size, quantity, zeta potential, CD63 and CD9 protein expression, and exosomal RNA (exRNA) quality and quantity using several complementary methods: nanoparticle tracking analysis (NTA) with ZetaView, western blot, transmission electron microscopy (TEM), the Agilent Bioanalyzer system, and droplet digital PCR (ddPCR). Our NTA results showed that all isolation techniques produced exosomes within the expected size range (40-150 nm). The three kits, though, produced a significantly higher yield (80-300 fold) of exosomes as compared to UC for all serum volumes, except 5 mL. We also found that exosomes isolated by the different techniques and serum volumes had similar zeta potentials to previous studies. Western blot analysis and TEM immunogold labelling confirmed the expression of two common exosomal protein markers, CD63 and CD9, in samples isolated by all techniques. All exosome isolations yielded high quality exRNA, containing mostly small RNA with a peak between 25 and 200 nucleotides in size. ddPCR results indicated that exosomes isolated from similar serum volumes but different isolation techniques rendered similar concentrations of two selected exRNA: hsa-miR-16 and hsa-miR-451. In summary, the three commercial exosome isolation kits are viable alternatives to UC, even when limited amounts of biological samples are available.


Conflict of interest statement

The authors have declared that no competing interests exist.

Figures

Fig 1
Fig 1. ZetaView measurements of the exosomes extracted from the six serum starting volumes of pooled human serum using the 4 different isolation techniques.
NTA was done using the ZetaView instrument to measure (A) particles diameters (nm) and (B) the log10 of the total number of particles isolated using miRCURY (blue), ExoQuick (green), TEIR (red), and UC (yellow) from 5 ml, 1 ml, 500 μl, 250 μl, 100 μl, and 50 μl of human serum. The data in this graph are the mean values of three experimental replicates (±SEM), *p≤0.05.
Fig 2
Fig 2. Size distribution of the exosomes isolated from pooled human serum using the different techniques and serum volumes.
For each sample volume (5 ml, 1 ml, 500 μl, 250 μl, 100 μl, and 50 μl) and technique, the number of particles per a specific particle size (nm) was measured using the ZetaView for NTA. Each graph represents quadratic interpolation of the mean number of particles isolated by each technique (n = 3). Data from the commercial kits miRCURY (blue), ExoQuick (green), and TEIR (red) are graphed on the left y-axis, while the UC (yellow) data, being at a significantly lower magnitude, are mapped on the right y-axis.
Fig 3
Fig 3. Correlation between the volume of serum and the total number of particles isolated.
The relationship between the volume of serum and the total number of particles was linear for all four isolation techniques: (A) miRCURY, (B) ExoQuick, (C) TEIR, and (D) UC. The data in this graph represent the average number of isolated particles ± SEM (n = 3).
Fig 4
Fig 4. ZetaView measurements of the exosomes extracted from three different serum starting volumes of six individual human donors samples using the 4 different isolation techniques.
NTA was done using the ZetaView instrument to measure (A) particles diameters (nm) and (B) the log10 of the total number of particles isolated using miRCURY (blue), ExoQuick (green), TEIR (red), and UC (yellow) from 1 ml, 500 μl, and 100 μl of human serum. The data in this graph are the mean values of the six individual human samples (±SEM), *p≤0.05.
Fig 5
Fig 5. Microscopic analysis of the morphology of isolated exosomes using TEM.
Upper panel shows unlabeled negative staining, middle panel shows Immunogold labeling using anti-CD63 antibody, and lower panel shows Immunogold labeling using anti-CD9 antibody. Scale bar depicts 100 nm.
Fig 6
Fig 6. Western blot analysis of CD63 and CD9 expression in exosomes samples isolated by different techniques.
The expression of the common exosomal markers CD63 and CD9 were determined using rabbit polyclonal anti-CD63 antibody and rabbit monoclonal anti-CD9 antibody. IRDye 800CW goat anti-rabbit secondary antibody and IRDye 680RD goat anti-mouse secondary antibody were used, and membranes were imaged and analyzed using LI-COR Odyssey system. (A) Expression of CD63 and CD9 using equal volumes (10 μl) of protein lysates of samples isolated by all techniques (B) Expression after loading a greater volume of protein lysate (5-fold increase; 50 μl) from the ultracentrifugation sample.
Fig 7
Fig 7. Zeta potential measurements for exosomes isolated from the different techniques and serum volumes.
Using the ZetaView instrument, the zeta potential (mV) was measured for the exosomes isolated with miRCURY (blue), ExoQuick (green), TEIR (red), and UC (yellow) from 5 ml, 1 ml, 500 μl, 250 μl, and 100 μl of human serum. The data in this graph are the mean values of the zeta potential ± SEM (n = 3)
Fig 8
Fig 8. Correlation between the volume of serum and the zeta potential of the isolated solutions.
The data in this graph are the mean values of three experimental replicates (n = 3) ± SEM. (A) miRCURY, (B) ExoQuick, (C) TEIR, and (D) UC.
Fig 9
Fig 9. Zeta potential measurements for individual serum exosomes isolated from the different techniques and serum volumes.
Using the ZetaView instrument, the zeta potential (mV) was measured for the exosomes isolated from individual human serum samples using miRCURY (blue), ExoQuick (green), TEIR (red), and UC (yellow) with starting volumes of 1 ml, 500 μl, and 100 μl. The data in this graph are the mean values of the zeta potential (n = 3) ± SEM, *p≤0.05.
Fig 10
Fig 10. Characterization of exRNA extracted from exosomes isolated using the four techniques.
exRNA quality was evaluated using the Agilent Bioanalyzer with RNA 6000 Pico kit for the exosomes extracted using the different isolation techniques and serum volumes. The y-axis represents fluorescence, and the x-axis is the size of the RNA, measured in nucleotides (nt). (A) miRCURY, (B) ExoQuick, (C) TEIR, and (D) UC.
Fig 11
Fig 11. Quantity of exRNA extracted from exosomes isolated using the different techniques and serum volumes.
exRNA concentration was measured using the Agilent Bioanalyzer with RNA 6000 Pico kit for the exosomes extracted using miRCURY (blue), ExoQuick (green), TEIR (red), and UC (yellow) with the six different serum volumes. Total amount of exRNA in each isolation was compared between different techniques. The data in this graph are the mean RNA amount (ng) of three experimental replicates (n = 3) ± SEM.
Fig 12
Fig 12. Expression of miR-16 and miR-451 in the exosomes isolated from the different techniques and volumes of serum.
ddPCR was used to measure the absolute concentration of miR-16 and miR-451 in the exosomes isolated with miRCURY (blue), ExoQuick (green), TEIR (red), and UC (yellow) using the different volumes of human serum. The values in the graph are the mean concentration (copies/μl) ± SEM (n = 3), *p≤0.05.

References

    1. Admyre C, Johansson SM, Qazi KR, Filen JJ, Lahesmaa R, Norman M, et al. Exosomes with immune modulatory features are present in human breast milk. Journal of immunology. 2007;179(3):1969–78. - PubMed
    1. Alegre E, Sanmamed MF, Rodriguez C, Carranza O, Martin-Algarra S, Gonzalez A. Study of circulating microRNA-125b levels in serum exosomes in advanced melanoma. Archives of pathology & laboratory medicine. 2014;138(6):828–32. - PubMed
    1. Conde-Vancells J, Rodriguez-Suarez E, Embade N, Gil D, Matthiesen R, Valle M, et al. Characterization and Comprehensive Proteome Profiling of Exosomes Secreted by Hepatocytes. J Proteome Res. 2008;7(12):5157–66. - PMC - PubMed
    1. Hegmans JPJJ, Bard MPL, Hemmes A, Luider TM, Kleijmeer MJ, Prins J-B, et al. Proteomic Analysis of Exosomes Secreted by Human Mesothelioma Cells. Am J Pathol. 2004;164(5):1807–15. 10.1016/S0002-9440(10)63739-X - DOI - PMC - PubMed
    1. Nilsson J, Skog J, Nordstrand A, Baranov V, Mincheva-Nilsson L, Breakefield XO, et al. Prostate cancer-derived urine exosomes: a novel approach to biomarkers for prostate cancer. British journal of cancer. 2009;100(10):1603–7. PubMed Central PMCID: PMC2696767. 10.1038/sj.bjc.6605058 - DOI - PMC - PubMed

Publication types