. 2017 Apr 1;22(4):41011.
doi: 10.1117/1.JBO.22.4.041011.

Design of a multifiber light delivery system for photoacoustic-guided surgery

Affiliations

Design of a multifiber light delivery system for photoacoustic-guided surgery

Blackberrie Eddins et al. J Biomed Opt. .

Abstract

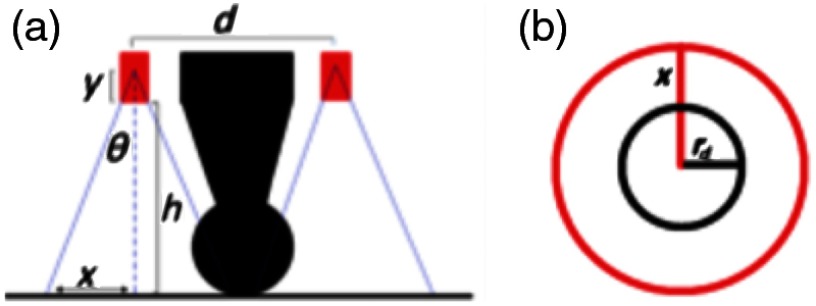
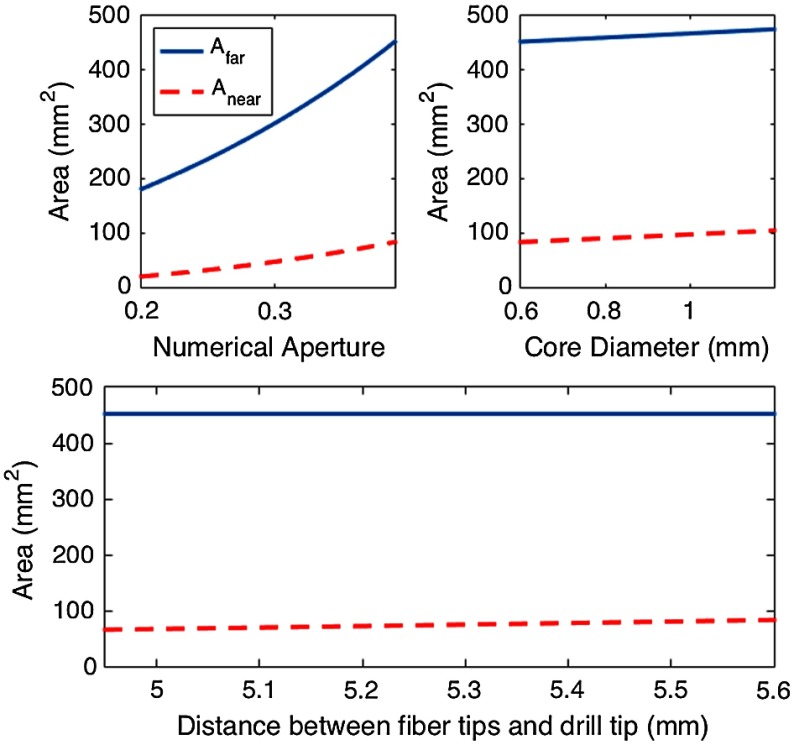
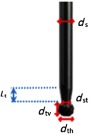
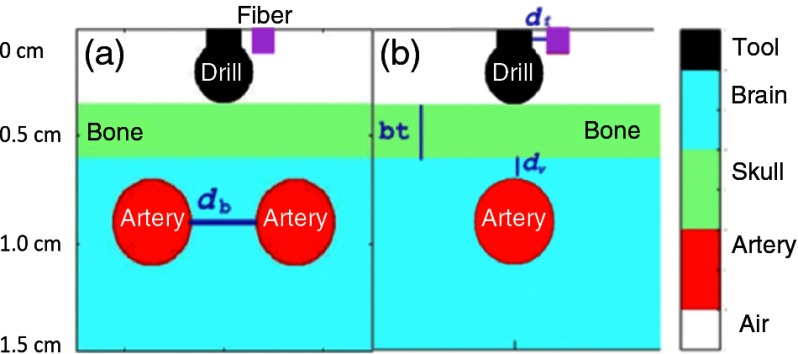
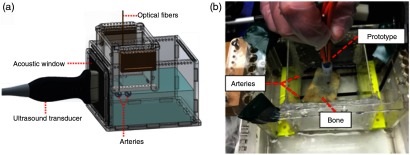
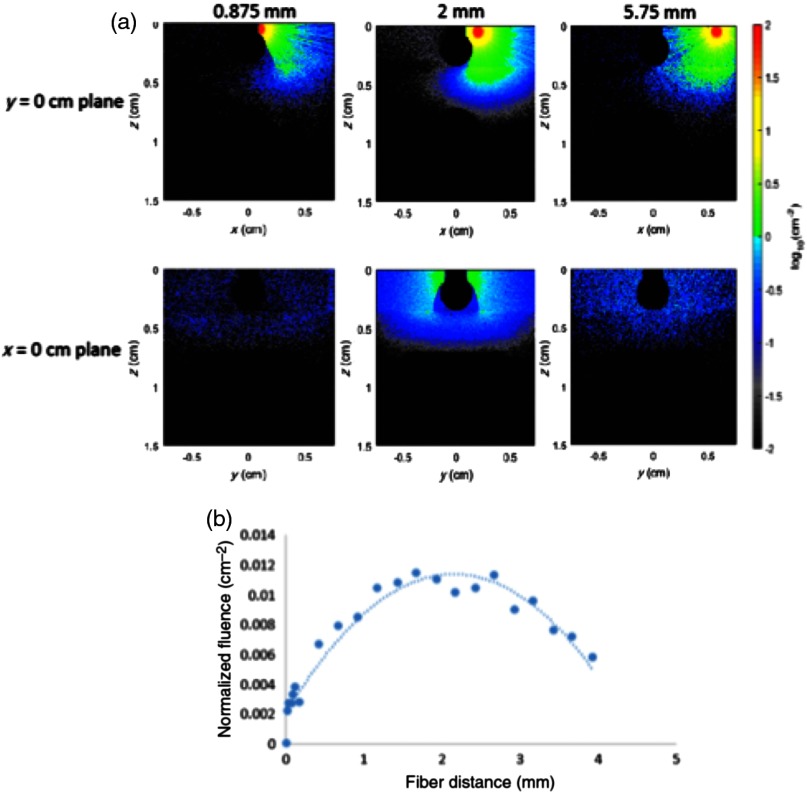
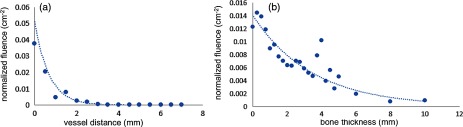
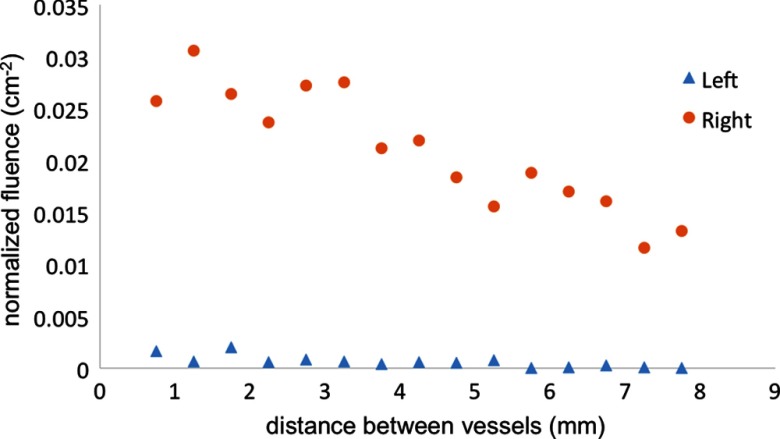
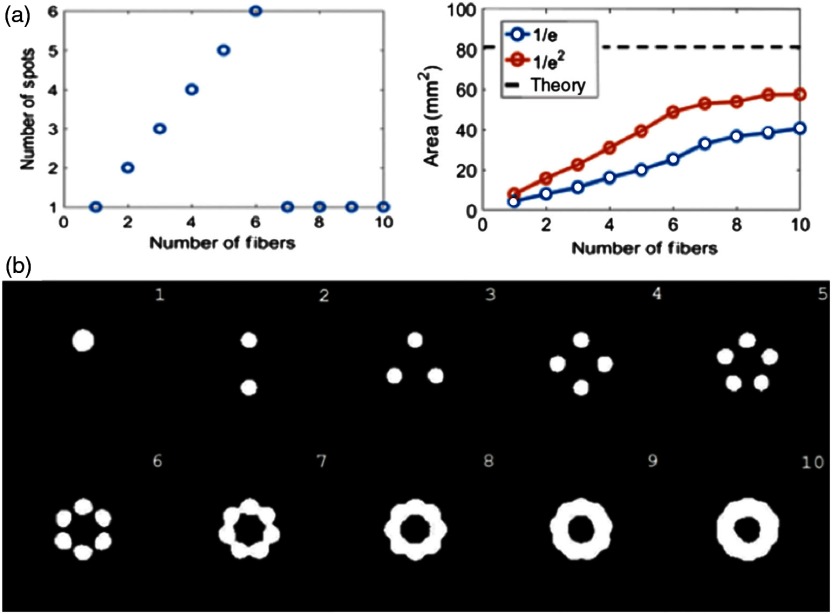
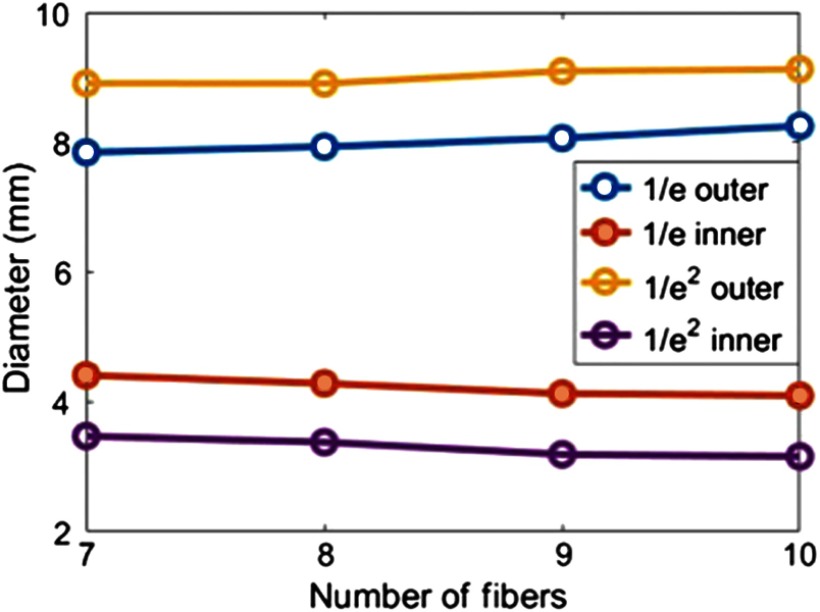
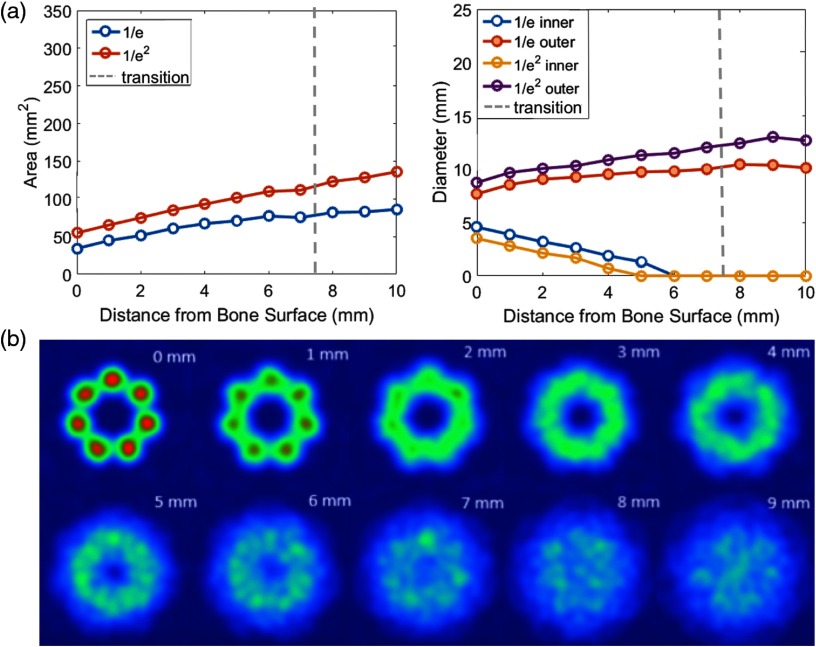
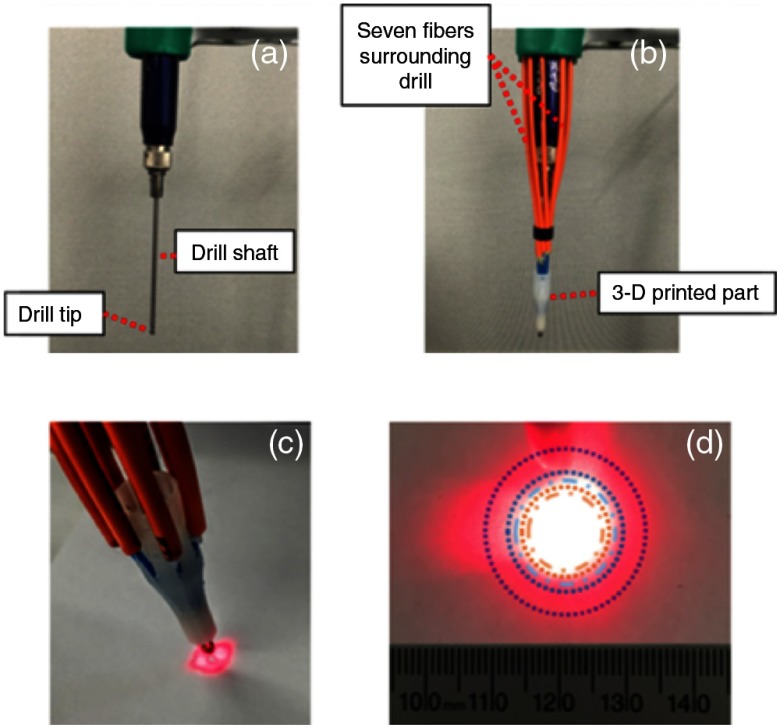
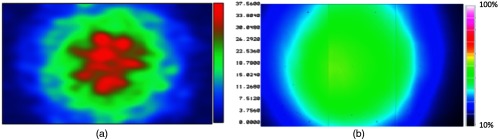
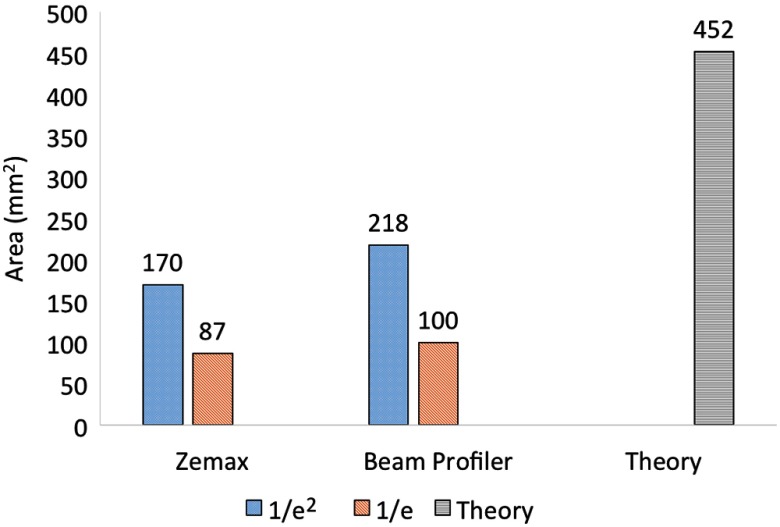
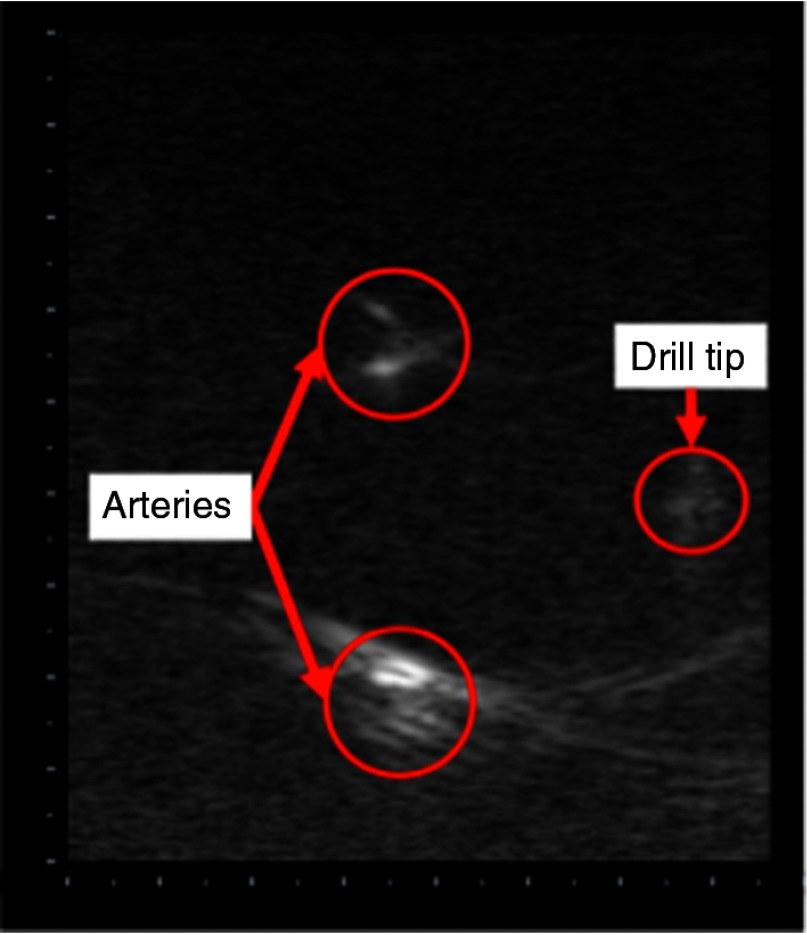
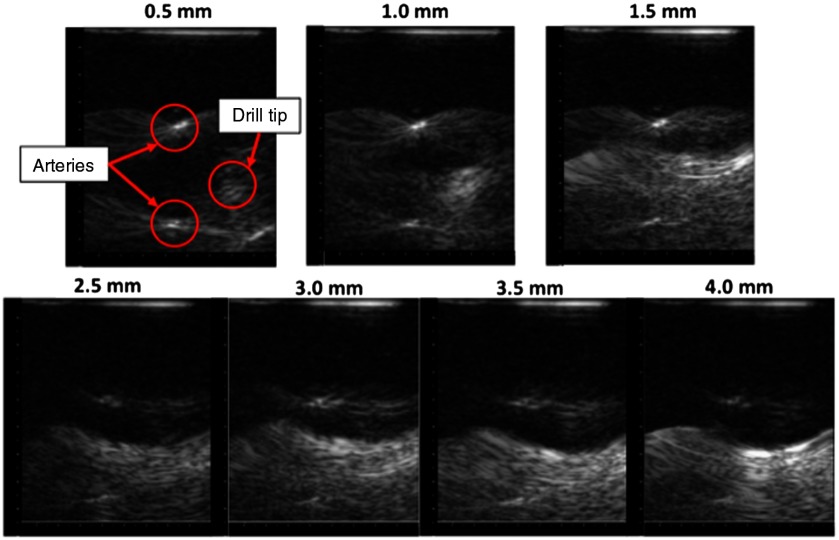
This work explores light delivery optimization for photoacoustic-guided minimally invasive surgeries, such as the endonasal transsphenoidal approach. Monte Carlo simulations were employed to study three-dimensional light propagation in tissue, comprising one or two 4-mm diameter arteries located 3 mm below bone, an absorbing metallic drill contacting the bone surface, and a single light source placed next to the 2.4-mm diameter drill shaft with a 2.9-mm diameter spherical drill tip. The optimal fiber distance from the drill shaft was determined from the maximum normalized fluence to the underlying artery. Using this optimal fiber-to-drill shaft distance, Zemax simulations were employed to propagate Gaussian beams through one or more 600 micron-core diameter optical fibers for detection on the bone surface. When the number of equally spaced fibers surrounding the drill increased, a single merged optical profile formed with seven or more fibers, determined by thresholding the resulting light profile images at 1 / e times the maximum intensity. We used these simulations to inform design requirements, build a one to seven multifiber light delivery prototype to surround a surgical drill, and demonstrate its ability to simultaneously visualize the tool tip and blood vessel targets in the absence and presence of bone. The results and methodology are generalizable to multiple interventional photoacoustic applications.


Figures

Fig. 1
Fig. 1
Geometry used to derive conical approximation of spot size showing views from (a) the side profile of the drill tip and tool shaft and (b) the detector surface touching the drill tip.
Fig. 2
Fig. 2
The theoretical near-field and far-field surface area approximations as functions of NA, fiber core diameter, and the distance that the fibers are set back from the drill tip. These plots are based on the actual drill geometry shown in Fig. 3 with a constant distance of h=20.1  mm from the fiber tips to the detector surface when measuring Afar, whereas Anear represents measurements calculated with the drill tip touching the detector surface as shown in Fig. 1(a). Unless otherwise noted, the NA is 0.39, the fiber core diameter is 0.6 mm, and the fibers are set back a distance of 5.6 mm from the drill tip.
Fig. 4
Fig. 4
Actual drill geometry: drill shaft diameter (ds)=2.37  mm, drill shaft diameter after tapering (dst)=1.88  mm, drill tip vertical diameter (dtv)=2.40  mm, drill tip horizontal diameter (dth)=2.89  mm, and length of taper (Lt)=3  mm.
Fig. 3
Fig. 3
Monte Carlo Simulation diagram. (a) Two vessel simulation. The variable in this simulation was the distance between two arteries (db). (b) Single vessel simulation. The variables in this simulation were bone thickness (bt), distance between artery and bone (dv), and distance between the fiber and the drill shaft (df).
Fig. 5
Fig. 5
(a) Solid model of phantom and (b) experimental setup with light delivery prototype used to image through a cadaveric bone specimen.
Fig. 6
Fig. 6
The distance of the fiber from the drill shaft alters the normalized fluence distribution. The images (a) display the normalized fluence when the fiber is located at distances of 0.875, 2, and 5.75 mm from the drill shaft (as indicated above each image), while the plot (b) shows measured data points along the artery surface as a function of multiple fiber distances. The quadratic curve FN=0.002df2+0.0086df+0.0021 was fit to the data points.
Fig. 7
Fig. 7
Normalized fluence as a function of (a) vessel distance and (b) bone thickness.
Fig. 8
Fig. 8
Normalized fluence as a function of the distance between two arteries.
Fig. 9
Fig. 9
(a) Number of spot sizes observed and 1/e area of the spot sizes as a function of the number of fibers surrounding the drill. (b) Images showing the 1/e thresholding used to calculate area as the number of fibers increased. The beam profiles converge with seven or more fibers.
Fig. 10
Fig. 10
Inner and outer diameters of 1/e and 1/e2 beam profiles detected on a planar surface that is coincident with the drill tip and orthogonal to the drill axis.
Fig. 11
Fig. 11
Near- and far-field beam profile results. (a) The plots show 1/e and 1/e2 beam profile areas and diameters as a function of the tool tip distance from the detector surface, which represents the bone that will be drilled. The dashed vertical line indicates the transition from near-field to far-field beam profiles (determined when the 1/e2 beam profile decreases to zero). (b) The pictures demonstrate this transition of the beam profile from a torus to a Gaussian as the distance between the drill tip and the surface increases from 0 mm to 9 mm.
Fig. 12
Fig. 12
(a) Surgical drill without attachments, (b) light delivery prototype with optical fibers surrounding the drill and secured into the 3-D printed part, (c) a 635-nm laser light coupled with this light delivery system shows the near-field spot size, (d) the resulting far-field laser spot size at a distance of 20  mm from the fiber tips, showing comparisons to theoretical, simulation, and experimental results (i.e., the rings from largest to smallest represent beam diameters measured based on the far-field theory, 1/e2 beam profiler and Zemax results, and 1/e beam profiler and Zemax results).
Fig. 13
Fig. 13
Beam profile 20.1 mm away from the fiber surface measured with (a) Zemax and (b) the beam profiler. The peak intensity is lower than 100% with the beam profiler result because data are not normalized. The dimensions of these images are 11.3  mm×18  mm.
Fig. 14
Fig. 14
Measured 1/e and 1/e2 spot sizes at a distance of 20.1 mm away from the fiber surface. The theoretical approximation for the total beam size is shown for reference.
Fig. 15
Fig. 15
Photoacoustic image obtained with our multifiber light delivery system design. The total vertical depth is 4.5 cm, and each mark depicts a spacing of 0.25 cm. A video (Video 1) showing synchronized fiber motion and real-time photoacoustic images are included as a multimedia file. The video starts with the prototype outside of the water. Photoacoustic signals appear on the left as the tool is inserted in the water and navigated around the two vessels (Video 1, MPEG 4.2 MB [URL: http://dx.doi.org/10.1117/1.JBO.22.4.041011.1]).
Fig. 16
Fig. 16
Photoacoustic images obtained when bone is placed between the drill tip and vessels, as shown in Fig. 5. The drill tip is consistently located between the two vessels and becomes increasingly difficult to visualize as bone thickness increases, particularly when the drill tip is not perfectly aligned with the image plane. It also appears that the thicker bone samples (e.g., 4 mm) are visible in the photoacoustic image. The total vertical depth of each image is 4.5 cm, each mark depicts a spacing of 0.25 cm, and all still images are shown with 60-dB dynamic range. A video (Video 2) showing real-time photoacoustic images obtained in the presence of 1.5-mm-thick bone is included as a multimedia file; images in the video are displayed with 30-dB dynamic range (Video 2, MPEG 347 kB [URL: http://dx.doi.org/10.1117/1.JBO.22.4.041011.2]).

References

    1. Mari J. M., et al. , “Interventional multispectral photoacoustic imaging with a clinical ultrasound probe for discriminating nerves and tendons: an ex vivo pilot study,” J. Biomed. Opt. 20(11), 110503 (2015). 10.1117/1.JBO.20.11.110503 - DOI - PMC - PubMed
    1. Bell M. A. L., et al. , “Localization of transcranial targets for photoacoustic-guided endonasal surgeries,” Photoacoustics 3(2), 78–87 (2015). 10.1016/j.pacs.2015.05.002 - DOI - PMC - PubMed
    1. Piras D., et al. , “Photoacoustic needle: minimally invasive guidance to biopsy,” J. Biomed. Opt. 18(7), 070502 (2013). 10.1117/1.JBO.18.7.070502 - DOI - PubMed
    1. Bell M. A. L., et al. , “In vivo visualization of prostate brachytherapy seeds with photoacoustic imaging,” J. Biomed. Opt. 19(12), 126011 (2014). 10.1117/1.JBO.19.12.126011 - DOI - PMC - PubMed
    1. Xi L., et al. , “Evaluation of breast tumor margins in vivo with intraoperative photoacoustic imaging,” Opt. Express 20, 8726–8731 (2012). 10.1364/OE.20.008726 - DOI - PubMed

MeSH terms