. 2017 Jan 1;17(1):8.
doi: 10.1167/17.1.8.

Filling-in rivalry: Perceptual alternations in the absence of retinal image conflict

Affiliations

Filling-in rivalry: Perceptual alternations in the absence of retinal image conflict

Zhimin Chen et al. J Vis. .

Abstract

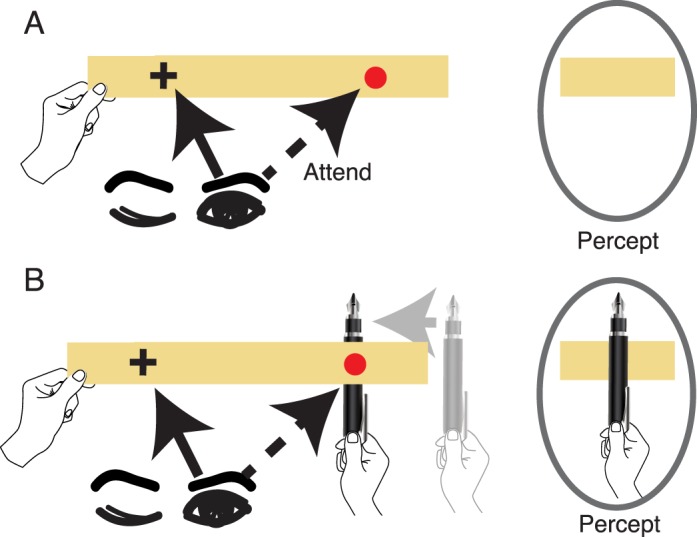
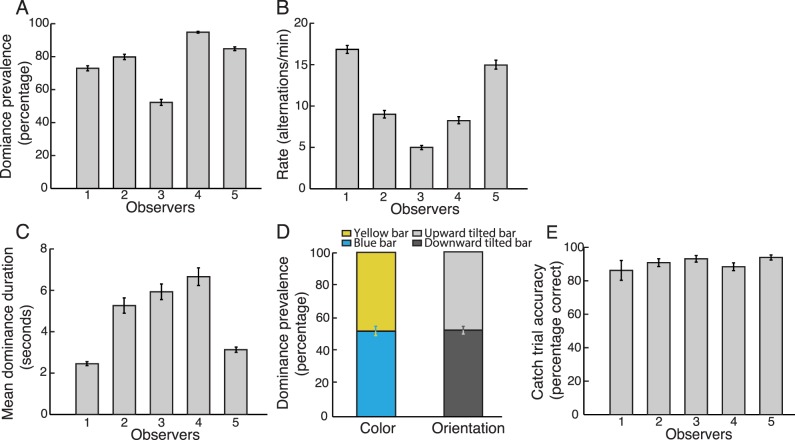
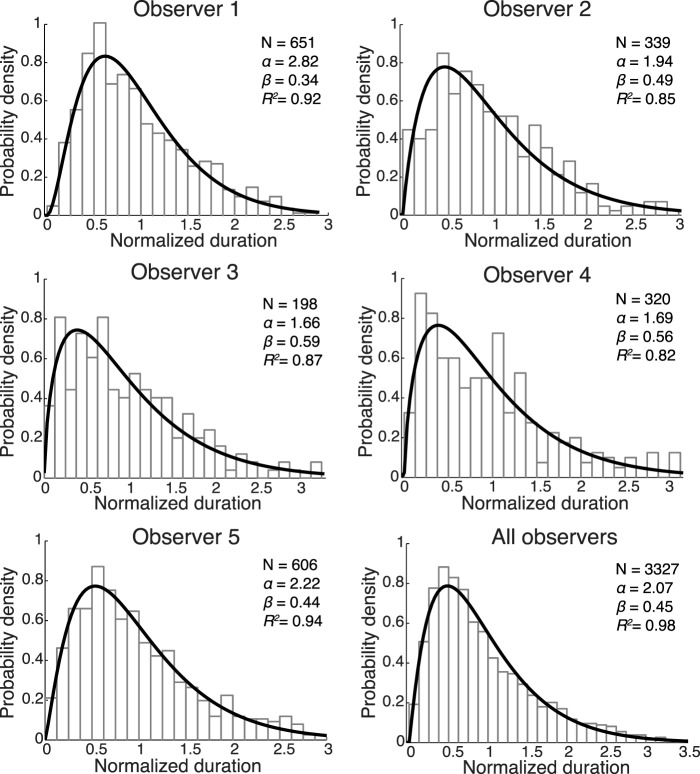
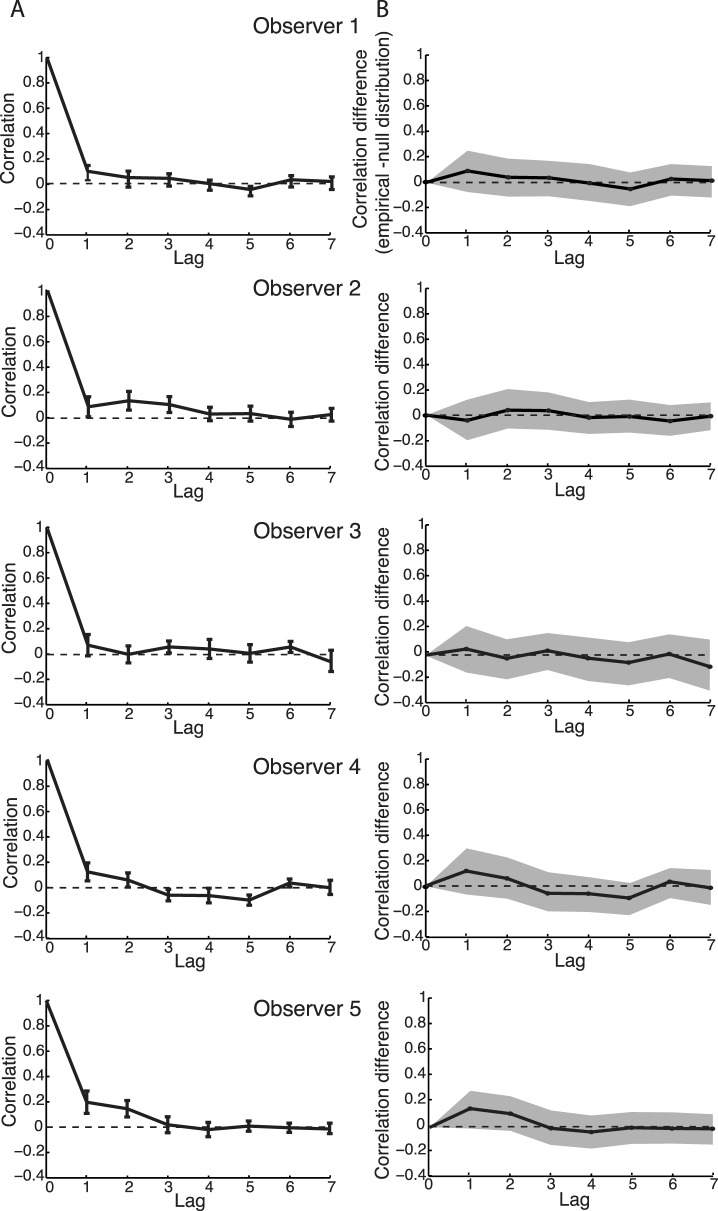
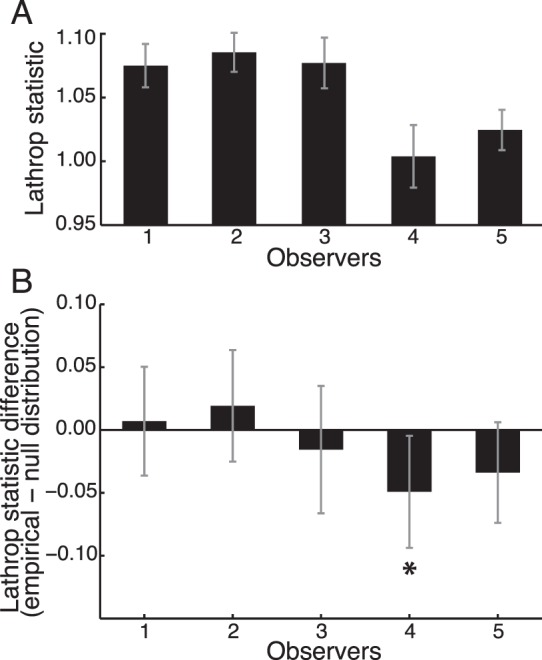
During perceptual rivalry, an observer's perceptual experience alternates over time despite constant sensory stimulation. Perceptual alternations are thought to be driven by conflicting or ambiguous retinal image features at a particular spatial location and modulated by global context from surrounding locations. However, rivalry can also occur between two illusory stimuli-such as two filled-in stimuli within the retinal blind spot. In this "filling-in rivalry," what observers perceive in the blind spot changes in the absence of local stimulation. It remains unclear if filling-in rivalry shares common mechanisms with other types of rivalry. We measured the dynamics of rivalry between filled-in percepts in the blind spot, finding a high degree of exclusivity (perceptual dominance of one filled-in percept, rather than a perception of transparency), alternation rates that were highly consistent for individual observers, and dynamics that closely resembled other forms of perceptual rivalry. The results suggest that mechanisms common to a wide range of rivalry situations need not rely on conflicting retinal image signals.


Figures

Figure 1
Figure 1
The jumping pen illusion, a demonstration of filling-in rivalry. (A) Step 1: Use a strip of paper with a fixation cross and a blind spot indicator (red circle) to find your blind spot. With the cross on the left, close your left eye, fixate the cross, and move the strip toward or away from you until the red circle disappears. (B) Step 2: While keeping the blind spot indicator in your blind spot, take a pen and hold it vertically behind the card. Slide the pen behind the card into your blind spot. The pen may appear to jump in front of the strip. When the pen and strip are held in fixed positions, the pen and strip can alternate as the object seen in front. Anecdotally, increasing the saliency of the pen using motion (e.g. wiggling the pen) or color (e.g. a red pen with a neutral-colored strip) tends to increase the perceptual dominance of the pen.
Figure 2
Figure 2
The blind spot measurement procedure. Observers moved a blinking mouse cursor into the blind spot at six locations and indicated with a mouse click where they could no longer see the blinking cursor.
Figure 3
Figure 3
Stimuli. (A) Stimuli for the main experiment: A blue and yellow isoluminant cross was presented continuously for 60 s. The intersection of the cross was covered by a black square and centered within the blind spot area (white dashed ellipse). To prevent Troxler fading, the cross continuously moved along a circular trajectory (black arrow), keeping the intersection point well within the blind spot. (B) During unambiguous catch trial periods, one of the two bars of the cross was shown to the fellow eye.
Figure 4
Figure 4
Blind spot centers and boundaries for five observers (both eyes) in degrees of visual angle. Different colors represent different observers.
Figure 5
Figure 5
Results for the rivalry experiment: (A) Dominance prevalence, the percentage of time that either bar was reported unambiguously in front. (B) Rivalry alternation rate, the number of times each observer perceived a perceptual switch per minute. (C) Mean dominance durations, the duration of each individual key press for an unambiguous percept. (D) Dominance prevalence for bar color and orientation. (E) Catch trial accuracy. Error bars show ±1 SEM.
Figure 6
Figure 6
Distributions of normalized dominance durations for individual observers and combined across observers. The durations were binned into 125-ms intervals for plotting and calculating R2. Black curves show the best-fitting gamma distributions. N is the number of dominance durations that were used to estimate a distribution; α and β are the estimated shape and scale parameters of the fitted distribution.
Figure 7
Figure 7
Autocorrelation analysis. (A) Mean autocorrelation of the sequence of dominance durations for individual observers. Error bars show ±1 SEM. (B) Mean difference between empirical autocorrelations and expected autocorrelations calculated from a permutation analysis (5,000 shuffled sequences to form a null distribution, see Methods) across trials for each observer. 95% confidence intervals (shaded regions) for the difference between empirical and shuffled data all include zero, which indicates non-significant results from the permutation analysis.
Figure 8
Figure 8
Lathrop statistic for first-order sequential dependence. (A) Mean Lathrop statistic across trials for each observer. Error bars show ±1 SEM. (B) Mean difference between empirical Lathrop values and expected Lathrop values calculated from shuffled sequences (null distribution) across trials for each observer. Error bars show 95% confidence intervals. * p < 0.05/5 = 0.01 (Bonferroni correction).

Similar articles

Cited by

References

    1. Aafjes M., Hueting J. E., & Visser P.. (1966). Individual and interindividual differences in binocular retinal rivalry in man. Psychophysiology, 3 1, 18–22, doi:10.1111/j.1469-8986.1966.tb02674.x. - DOI - PubMed
    1. Alais D., & Blake R.. (1998). Interactions between global motion and local binocular rivalry. Vision Research, 38 5, 637–644, doi:10.1016/S0042-6989(97)00190-9. - DOI - PubMed
    1. Alais D., & Blake R.. (1999). Grouping visual features during binocular rivalry. Vision Research, 39 26, 4341–4353, doi:10.1016/S0042-6989(99)00146-7. - DOI - PubMed
    1. Alais D., Cass J., O'Shea R. P., & Blake R.. (2010). Visual sensitivity underlying changes in visual consciousness. Current Biology, 20 15, 1362–1367, doi.org/10.1016/j.cub.2010.06.015. - DOI - PMC - PubMed
    1. Alais D., O'Shea R. P., Mesana-Alais C., & Wilson I. G.. (2000). On binocular alternation. Perception, 29 12, 1437–1445, doi:10.1068/p3017. - DOI - PubMed