

Association Between Serum MicroRNAs and Magnetic Resonance Imaging Measures of Multiple Sclerosis Severity
- PMID: 28114622
- PMCID: PMC6014611
- DOI: 10.1001/jamaneurol.2016.5197
Association Between Serum MicroRNAs and Magnetic Resonance Imaging Measures of Multiple Sclerosis Severity
Abstract
Importance: MicroRNAs (miRNAs) are promising multiple sclerosis (MS) biomarkers. Establishing the association between miRNAs and magnetic resonance imaging (MRI) measures of disease severity will help define their significance and potential impact.
Objective: To correlate circulating miRNAs in the serum of patients with MS to brain and spinal MRI.
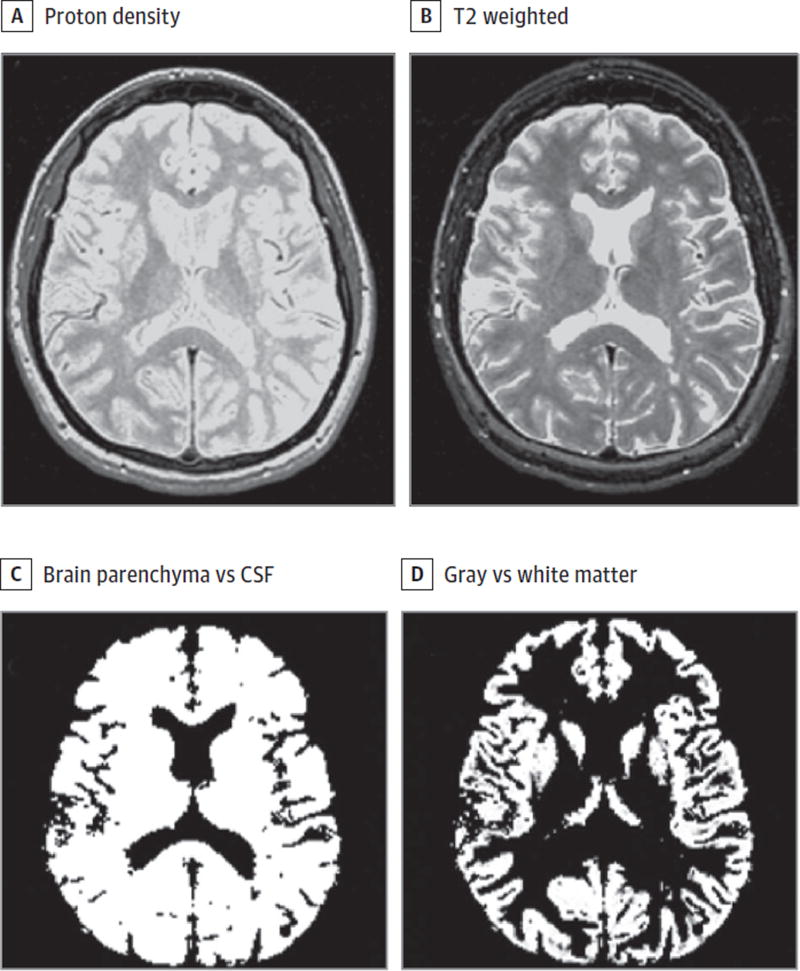
Design, setting, and participants: A cross-sectional study comparing serum miRNA samples with MRI metrics was conducted at a tertiary MS referral center. Two independent cohorts (41 and 79 patients) were retrospectively identified from the Comprehensive Longitudinal Investigation of Multiple Sclerosis at the Brigham and Women's Hospital. Expression of miRNA was determined by locked nucleic acid-based quantitative real-time polymerase chain reaction. Spearman correlation coefficients were used to test the association between miRNA and brain lesions (T2 hyperintense lesion volume [T2LV]), the ratio of T1 hypointense lesion volume [T1LV] to T2LV [T1:T2]), brain atrophy (whole brain and gray matter), and cervical spinal cord lesions (T2LV) and atrophy. The study was conducted from December 2013 to April 2016.
Main outcomes and measures: miRNA expression.
Results: Of the 120 patients included in the study, cohort 1 included 41 participants (7 [17.1%] men), with mean (SD) age of 47.7 (9.5) years; cohort 2 had 79 participants (26 [32.9%] men) with a mean (SD) age of 43.0 (7.5) years. Associations between miRNAs and MRIs were both protective and pathogenic. Regarding miRNA signatures, a topographic specificity differed for the brain vs the spinal cord, and the signature differed between T2LV and atrophy/destructive measures. Four miRNAs showed similar significant protective correlations with T1:T2 in both cohorts, with the highest for hsa.miR.143.3p (cohort 1: Spearman correlation coefficient rs = -0.452, P = .003; cohort 2: rs = -0.225, P = .046); the others included hsa.miR.142.5p (cohort 1: rs = -0.424, P = .006; cohort 2: rs = -0.226, P = .045), hsa.miR.181c.3p (cohort 1: rs = -0.383, P = .01; cohort 2: rs = -0.222, P = .049), and hsa.miR.181c.5p (cohort 1: rs = -0.433, P = .005; cohort 2: rs = -0.231, P = .04). In the 2 cohorts, hsa.miR.486.5p (cohort 1: rs = 0.348, P = .03; cohort 2: rs = 0.254, P = .02) and hsa.miR.92a.3p (cohort 1: rs = 0.392, P = .01; cohort 2: rs = 0.222, P = .049) showed similar significant pathogenic correlations with T1:T2; hsa.miR.375 (cohort 1: rs = -0.345, P = .03; cohort 2: rs = -0.257, P = .022) and hsa.miR.629.5p (cohort 1: rs = -0.350, P = .03; cohort 2: rs = -0.269, P = .02) showed significant pathogenic correlations with brain atrophy. Although we found several miRNAs associated with MRI outcomes, none of these associations remained significant when correcting for multiple comparisons, suggesting that further validation of our findings is needed.
Conclusions and relevance: Serum miRNAs may serve as MS biomarkers for monitoring disease progression and act as surrogate markers to identify underlying disease processes.
Figures

Comment in
-
Are miRNAs Appropriate Biomarkers for Radiologic Measures of Tissue Injury in Multiple Sclerosis?JAMA Neurol. 2017 Mar 1;74(3):260-261. doi: 10.1001/jamaneurol.2016.5384. JAMA Neurol. 2017. PMID: 28114651 No abstract available.
References
-
- Kutzelnigg A, Lassmann H. Pathology of multiple sclerosis and related inflammatory demyelinating diseases. Handb Clin Neurol. 2014;122:15–58. - PubMed
-
- Geurts JJ, Calabrese M, Fisher E, Rudick RA. Measurement and clinical effect of grey matter pathology in multiple sclerosis. Lancet Neurol. 2012;11(12):1082–1092. - PubMed
-
- Filippi M, Rocca MA, Arnold DL, et al. EFNS guidelines on the use of neuroimaging in the management of multiple sclerosis. Eur J Neurol. 2006;13(4):313–325. - PubMed
-
- Filippi M, Wolinsky JS, Comi G CORAL Study Group. Effects of oral glatiramer acetate on clinical and MRI-monitored disease activity in patients with relapsing multiple sclerosis: a multicentre, double-blind, randomised, placebo-controlled study. Lancet Neurol. 2006;5(3):213–220. - PubMed
Publication types
MeSH terms
Substances
Grants and funding
LinkOut - more resources
Full Text Sources
Other Literature Sources
Medical
Miscellaneous
