. 2017 Jan 23;17(1):32.
doi: 10.1186/s12862-017-0880-8.

Mid-day siesta in natural populations of D. melanogaster from Africa exhibits an altitudinal cline and is regulated by splicing of a thermosensitive intron in the period clock gene

Affiliations

Mid-day siesta in natural populations of D. melanogaster from Africa exhibits an altitudinal cline and is regulated by splicing of a thermosensitive intron in the period clock gene

Weihuan Cao et al. BMC Evol Biol. .

Abstract

Background: Many diurnal animals exhibit a mid-day 'siesta', generally thought to be an adaptive response aimed at minimizing exposure to heat on warm days, suggesting that in regions with cooler climates mid-day siestas might be a less prominent feature of animal behavior. Drosophila melanogaster exhibits thermal plasticity in its mid-day siesta that is partly governed by the thermosensitive splicing of the 3'-terminal intron (termed dmpi8) from the key circadian clock gene period (per). For example, decreases in temperature lead to progressively more efficient splicing, which increasingly favors activity over sleep during the mid-day. In this study we sought to determine if the adaptation of D. melanogaster from its ancestral range in the lowlands of tropical Africa to the cooler temperatures found at high altitudes involved changes in mid-day sleep behavior and/or dmpi8 splicing efficiency.

Results: Using natural populations of Drosophila melanogaster from different altitudes in tropical Africa we show that flies from high elevations have a reduced mid-day siesta and less consolidated sleep. We identified a single nucleotide polymorphism (SNP) in the per 3' untranslated region that has strong effects on dmpi8 splicing and mid-day sleep levels in both low and high altitude flies. Intriguingly, high altitude flies with a particular variant of this SNP exhibit increased dmpi8 splicing efficiency compared to their low altitude counterparts, consistent with reduced mid-day siesta. Thus, a boost in dmpi8 splicing efficiency appears to have played a prominent but not universal role in how African flies adapted to the cooler temperatures at high altitude.

Conclusions: Our findings point towards mid-day sleep behavior as a key evolutionary target in the thermal adaptation of animals, and provide a genetic framework for investigating daytime sleep in diurnal animals which appears to be driven by mechanisms distinct from those underlying nighttime sleep.

Keywords: Altitude; Circadian; Drosophila; Mid-day siesta; Period gene; Sleep; Splicing; Temperature; Thermal adaptation; dmpi8 intron.


Figures
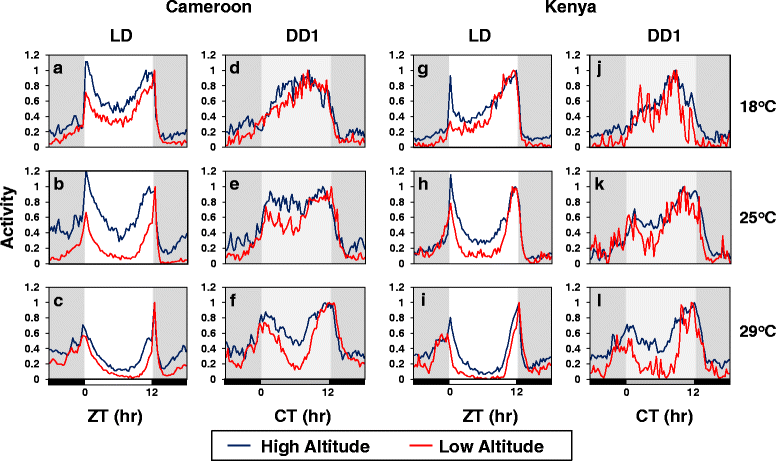
Fig. 1
Fig. 1
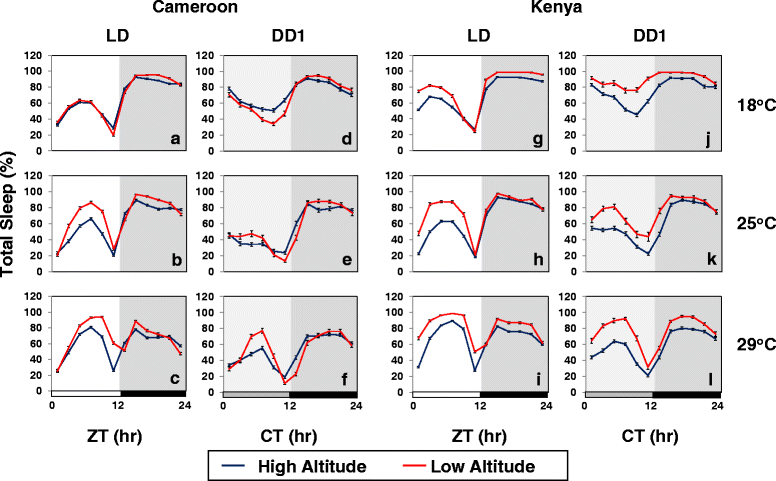
High altitude flies exhibit more of a ‘cold’ phenotype in daily wake-sleep profiles compared to low altitude flies. a-l Adult male flies from low and high altitudes representing several different locations in Cameroon (a-f) and Kenya (g-l) were kept at the indicated temperature (right of panels) and entrained to five days of 12 h light/12 h dark cycles (LD) followed by constant dark conditions (DD). For each country and temperature, the locomotor activity data of individual flies (16 flies per line) from the same altitude group (low or high) were pooled, and shown are group averages of daily activity rhythms (blue, high altitude group; red, low altitude group). To facilitate comparisons, the peak value in daily activity for each fly was set to 1.0 and the normalized profiles superimposed. For LD, the last three days’ worth of data was pooled; for DD, the first day is shown (DD1). The following fly lines were used in this experiment (see Additional file 1: Table S1 for further details); Cameroon low altitude (CM16, CM17, CM22, CM54, CY1); Cameroon high altitude (CO1, CO2, CO4, CO8, CO10, CO13, CO15, CO16); Kenya low altitude (KM10, KM16, and KM20); Kenya high altitude (KN5, KN6M, KN11M, KN13M, KN19M, KN23M, KO2, KO6, KO10M). Horizontal bars at bottom of panels denote 12-h periods of light (white bar), dark (black bar) and ‘subjective daytime’ in DD (gray bar). ZT, zeitgeber time (hr); CT, circadian time (hr). The results shown in this figure are representative of at least two independent experiments, using the same or additional lines from Cameroon or Kenya (see Additional file 1: Table S1). The results show that during LD high altitude flies from both Cameroon and Kenya exhibit a more pronounced ‘cold-type’ daily activity pattern, highlighted by a shorter and less robust midday siesta, earlier onset of evening activity and later offset of morning activity
Fig. 2
Fig. 2
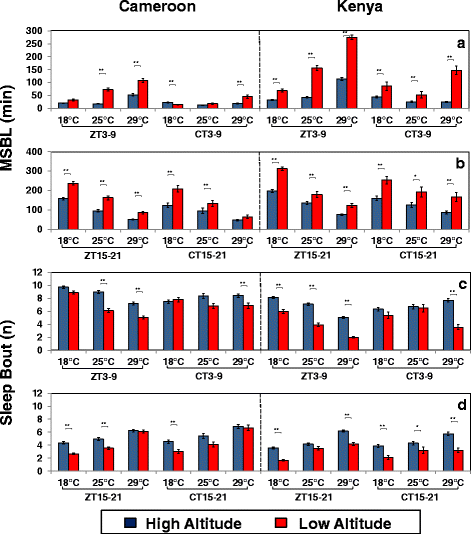
High altitude flies sleep less during the day. a-l The results are based on the same flies and activity data used in Fig. 1 and show group averages for daily sleep levels (expressed as the percentage of time flies are sleeping during 2 h time-windows) for either high altitude (blue line) or low altitude (red line) adult male flies from Cameroon and Kenya maintained at the indicated temperatures (right of panels) and light/dark conditions (top of panels). For LD, sleep data from the last 3 days were pooled, whereas for DD, the first day is shown (DD1). Horizontal bars at bottom of panels denote 12-h periods of light (white bar), dark (black bar) and ‘subjective daytime’ in DD (gray bar). ZT, zeitgeber time (hr); CT, circadian time (hr)
Fig. 3
Fig. 3
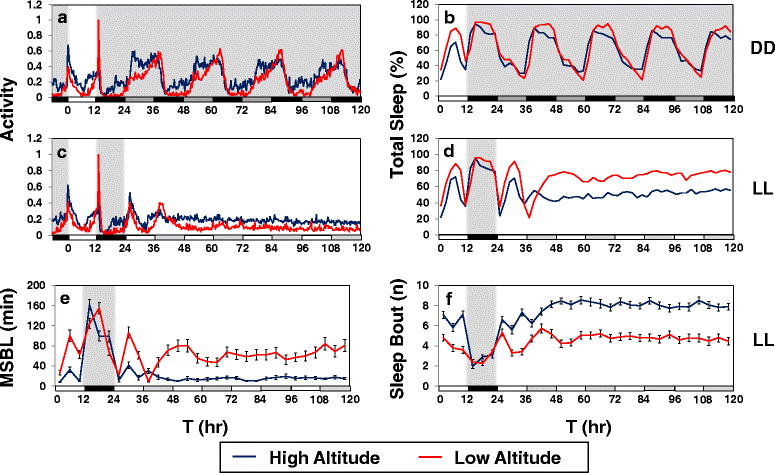
Daytime and nighttime sleep are more fragmented in high altitude flies. a-d Shown are group averages for median sleep bout length (MSBL) (a, b) and number of sleep bouts (c, d) for either high (blue bar) or low (red bar) altitude flies from Cameroon and Kenya at the indicated temperatures and 6-h time interval during LD (i.e., ZT3-9 or ZT15-21) or DD1 (i.e., CT3-9 or CT15-21) (bottom of panels). The results shown are based on the same flies and activity data used to generate Figs. 1 and 2. ZT3-9 and ZT15-21 denote 6-h periods during the mid-day and mid-night in LD, respectively; CT3-9, and CT15-21 denote 6-h periods of ‘subjective mid-day’ and ‘subjective mid-night’ in DD1, respectively. Values for high altitude and low altitude flies are significantly different using student’s t-test; *, p < 0.05; **, p < 0.01
Fig. 4
Fig. 4
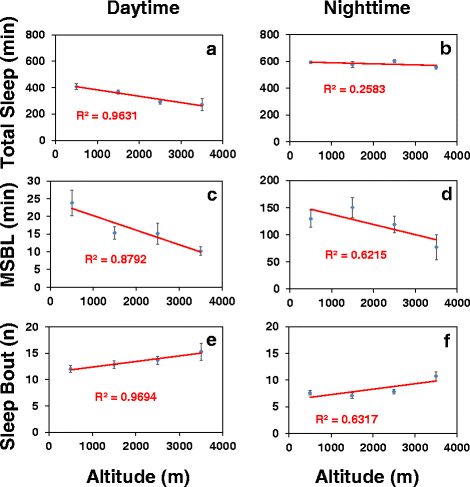
Reduced and more fragmented sleep in high altitude flies continues even in constant light conditions where circadian clock function is abolished. a-f Shown are group averages of fly activity (a and c), sleep levels (b and d), median sleep bout length (e), and number of sleep bouts (f) for Cameroon male flies from either the high (blue line) or low (red line) altitude groups. For this experiment, two representative lines were used for each altitude; Cameroon low altitude (CO1, CO4); Cameroon high altitude (CM16, CM54). Flies were maintained at 25 °C and entrained for five days in LD. Subsequently, half of the high and low altitude groups were placed in constant darkness (DD), whereas the other half was placed in constant light (LL). White, black, dark gray, and light gray horizontal bars below panels represent 12-h periods of light, dark, ‘subjective daytime’ in DD, and ‘subjective nighttime’ in LL, respectively. In LL, comparison of low and high altitude flies for daily activity profiles (c), daily sleep levels (d), median sleep bout length (e), and number of sleep bouts (f) showed highly significant differences (one-way ANOVA, p < 0.0001). Similar results showing that high altitude flies exhibit less total sleep that is more fragmented in LL compared to low altitude flies were also obtained with flies from Kenya (data not shown)
Fig. 5
Fig. 5
Altitudinal cline in daytime sleep behavior is widely observed in flies from tropical Africa. a-f Shown are group averages of total sleep (a-b), median sleep bout length (c-d), and number of sleep bouts (e-f) during the 12-h period of either daytime or nighttime in LD for a total of 91 independent lines (16 flies per line) from 20 localities in 10 different countries (see Additional file 1: Table S1). Flies were exposed to at least 5 days of LD at 25 °C and activity data from the last three days of LD was pooled and analyzed in 1000 m increments. The lines in the panels represent the regression analysis of phenotypic means (y-axis) as a function of altitude (x-axis). The results show that there is a more pronounced altitudinal cline in daytime sleep levels and quality compared to nighttime sleep, although the daytime trend of more fragmented daytime sleep with increasing altitude is still observed with nighttime sleep
Fig. 6
Fig. 6
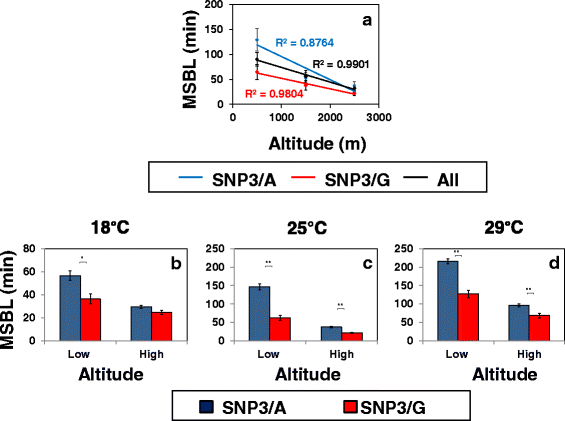
SNP3/A flies exhibit a larger altitudinal effect on mid-day sleep compared to the SNP3/G variant. a Shown are the group averages of median sleep bout length during the mid-day (ZT3-9) for flies with SNP3/A (blue dot and line), SNP3/G (red dot and line), or the combination of all 91 lines tested (black dot and line), as a function of altitude in 1000 m increments. The results shown are based on the same activity data used to generate Fig. 5, except that for SNP3/A and SNP3/G flies we only used data from the 67 independent lines where the identity of the SNP3 variant was known (see Additional file 1: Table S1). Briefly, flies were exposed to at least 5 days of LD at 25 °C and activity data from the last three days of LD was pooled. The lines in the panel represent the regression analysis of phenotypic means (y-axis) as a function of altitude (x-axis). b-d Shown are group averages of median sleep bout length during the mid-day (ZT3-9) for flies from Cameroon and Kenya that were exposed to at least 5 days of LD at the indicated temperature (top of panels). The results are based on the same flies used in Fig. 1; listed according to altitude group and SNP variant the flies analyzed were; low altitude SNP3/A (CM16, KM10, KM16, KM20); high altitude SNP3/A (CO4, CO8, CO16, KN5, KN6M, KN11M, KN19M, KO2, KO6, KO10M); low altitude SNP3/G (CM17, CM22, CM54, CY1); high altitude SNP3/G (CO1, CO2, CO10, CO13, CO15, KN13M, KN23M). Values for SNP3/A and SNP3/G flies are significantly different using student’s t-test; *, p < 0.05; **, p < 0.01
Fig. 7
Fig. 7
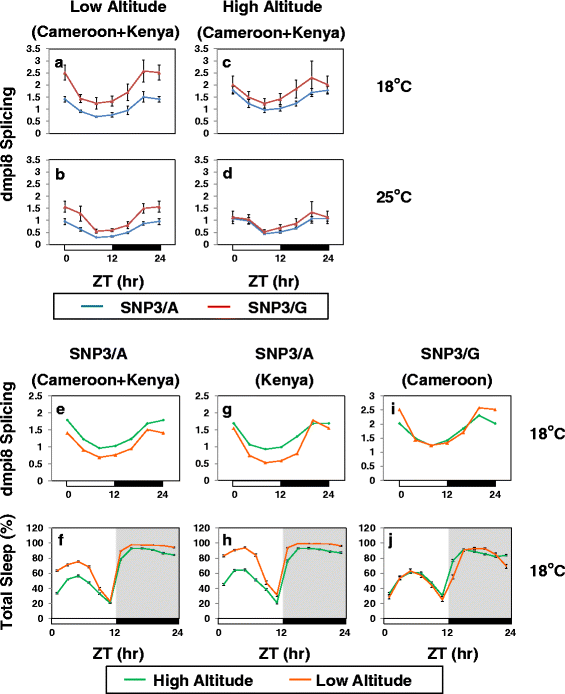
Strong association between daily levels of dmpi8 splicing and mid-day sleep at cold temperatures. a-d Shown are group averages for the splicing efficiency of dmpi8 (expressed as the ratio of spliced to unspliced levels) throughout an LD cycle for low and high altitude flies from Cameroon and Kenya pooled according to the SNP3 variant. The same fly lines as those used for the sleep analysis shown in Fig. 6b and c (see legend to Fig. 6) were also used to measure dmpi8 splicing, allowing for comparison between the behavioral and molecular results. Briefly, for each isofemale line approximately 40 flies were placed into each of 12 vials. Half of the vials were exposed to 5 days of LD at 18 °C, whereas the other half was exposed to 5 days of LD at 25 °C. On the last day of LD, flies were collected by removing a vial every 4 h, total RNA prepared and dmpi8 splicing efficiency measured for each line separately, followed by pooling results from different lines to yield group averages. For low altitude flies, the daily dmpi8 splicing curves at 18° and 25 °C were significantly different between the SNP3/A and SNP3/G variants (18 °C; one-way ANOVA, p < 0.01; 25 °C, one-way ANOVA, p < 0.05), whereas no significant differences were observed for the dmpi8 splicing curves from high altitude flies. e, g, i Using the same splicing data shown above for flies at 18 °C (a, c), the data from individual fly lines was sorted to compare the dmpi8 splicing curves from the low and high altitude groups with the same SNP3 variant. The error bars were removed to facilitate comparison. Comparison of the daily dmpi8 splicing curves for low and high altitude flies with SNP3/A (e, g) were significantly different (one-way ANOVA, p < 0.01) but no significant difference was observed for the comparison using SNP3/G flies from Cameroon (j). Directly below each splicing panel (e, g, i) is shown the corresponding daily sleep profile (f, h, j) for the same group of flies used to generate the splicing results. Similar results were obtained in several smaller scale experiments (data not shown)

Similar articles

Cited by

References

    1. Hardin PE. Molecular genetic analysis of circadian timekeeping in Drosophila. Adv Genet. 2011;74:141–173. - PMC - PubMed
    1. Lowrey PL, Takahashi JS. Genetics of circadian rhythms in Mammalian model organisms. Adv Genet. 2011;74:175–230. - PMC - PubMed
    1. Cajochen C, Chellappa S, Schmidt C. What keeps us awake? The role of clocks and hourglasses, light, and melatonin. Int Rev Neurobiol. 2010;93:57–90. doi: 10.1016/S0074-7742(10)93003-1. - DOI - PubMed
    1. Majercak J, Sidote D, Hardin PE, Edery I. How a circadian clock adapts to seasonal decreases in temperature and day length [see comments] Neuron. 1999;24(1):219–230. doi: 10.1016/S0896-6273(00)80834-X. - DOI - PubMed
    1. Rensing L, Ruoff P. Temperature effect on entrainment, phase shifting, and amplitude of circadian clocks and its molecular bases. Chronobiol Int. 2002;19(5):807–864. doi: 10.1081/CBI-120014569. - DOI - PubMed

LinkOut - more resources